TOTAL DEFI: HTF Reaccumulation Underway — $200B+ In SightThis is one of the cleanest HTF setups in the market right now — and it’s flying under the radar.
We're looking at TOTAL DEFI market cap, and it’s showing all the signs of strong reaccumulation following a textbook breakout–retest structure off a larger HTF accumulation base.
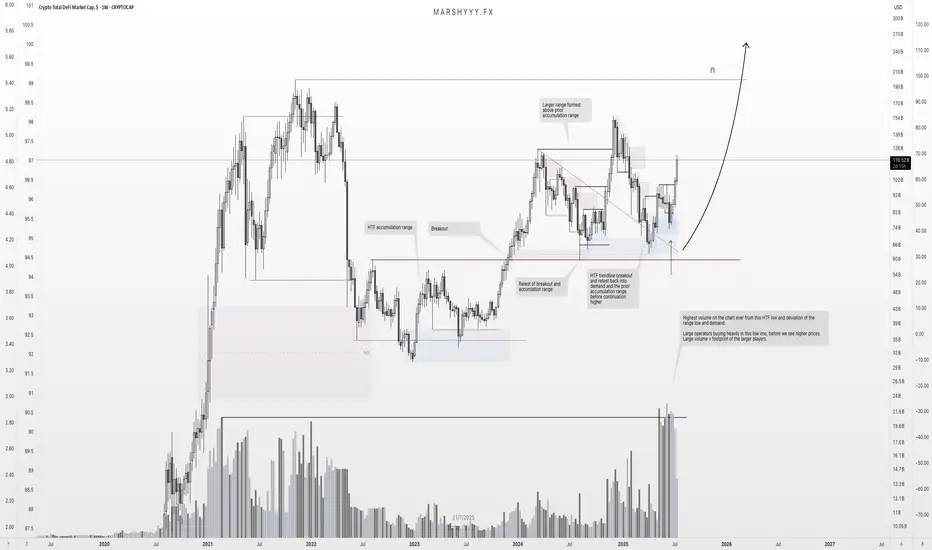
Price broke out from the 2023–2024 accumulation range, retested that breakout zone and range highs in August 2024, swept liquidity, and tapped into unmitigated demand within the accumulation range — before climbing back to the $155B region, creating a larger range above the prior accumulation range it broke out from.
Since then, price pulled all the way back to range lows and HTF demand at $65B, forming a new bullish reversal from this key region and retesting the trendline breakout before continuing another leg higher — as we’re now seeing unfold.
But here’s the key:
🧠 That recent deviation came with the highest volume ever recorded on this chart — right off the range low and HTF demand.
That’s not retail. That’s large operators loading up, leaving their footprint ahead of the next expansion leg.
We’ve now:
- Broken the descending trendline cleanly
- Flipped key SR levels back into support
- Started pushing higher with strong HTF closes
📈 Expectation:
This is a spring + test setup within a reaccumulation range. I’m targeting continuation toward the range highs, followed by a macro breakout that could take DeFi market cap to $200B+ — especially once the prior distribution zone is reclaimed.
This aligns with the broader cycle narrative — liquidity rotating back into altcoins, particularly DeFi, as stablecoin dominance declines and the market shifts fully risk-on into the final phase of the bull cycle.
Key Structure Summary:
- HTF accumulation base → breakout → retest → demand sweep
- Largest volume spike = operator footprint
- Higher lows forming = market structure flipping
- Expecting expansion to $200B+ as trend continues
One to watch closely.
Don’t fade the volume. Don’t fade the structure.
Cryptomarket
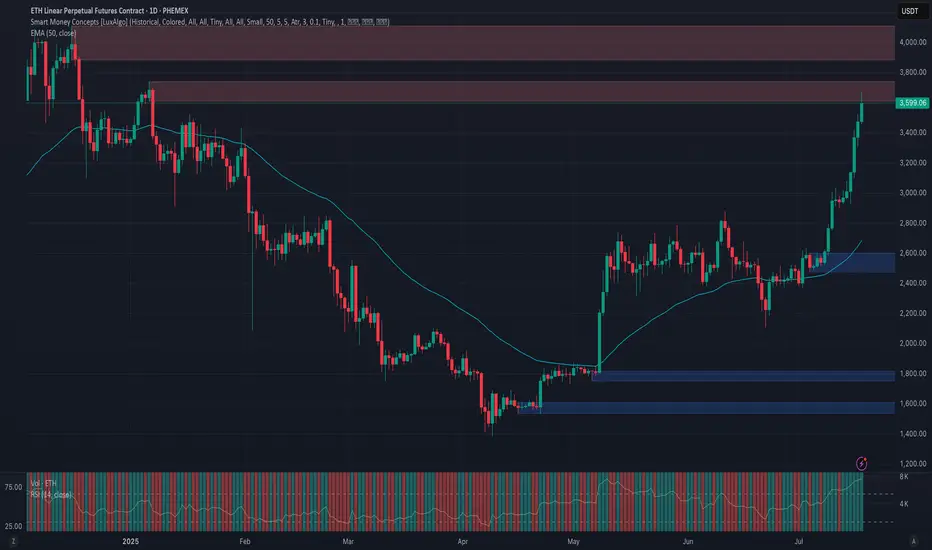
Phemex Analysis #98: ETH Price Explodes— Is $5,000 Finally Next?Ethereum ( PHEMEX:ETHUSDT.P ) has recently shown impressive strength, surging past significant resistance levels and stirring excitement in the crypto market. After an extended consolidation, ETH decisively broke through the crucial $3,300 resistance level, rallying more than 15% in just three days, and is now trading confidently around $3,500.
This renewed bullish momentum has traders and investors eagerly speculating: Could this be the start of Ethereum's next major run? Or should caution prevail amid ongoing market uncertainty? To help navigate this critical period, let's explore several key trading scenarios.
Possible Scenarios
1. Bullish Continuation – Targeting New Highs
Ethereum’s recent breakout above the $3,300 resistance signals strong bullish sentiment. If buying volume continues increasing, ETH could swiftly move towards higher resistance levels at $3,800 and potentially challenge the psychological milestone of $4,100.
Pro Tips:
Profit Targets: Consider locking in partial profits as ETH approaches strong resistance zones around $3,800 and $4,100.
Risk Management: Place tight stop-loss orders on recent lows, approximately around $2,902 to minimize downside risks.
2. Short-term Retracement – Healthy Pullback
Given ETH’s rapid surge, a short-term pullback to retest the recently broken resistance zone at $3,300 to $3,000 (now acting as strong support zone) is plausible. A successful retest would strengthen the bullish case, signaling healthy consolidation before further upward momentum.
Pro Tips:
Buying the Dip: If ETH holds above $3,000 with declining volume, consider cautiously adding to your positions or initiating new longs.
Volume Confirmation: Closely watch trading volume; lower volume during pullbacks typically indicates a healthy retracement rather than a bearish reversal.
3. Bearish Reversal – Breaking Below Critical Support
If Ethereum’s price experiences heavy selling pressure and breaks below the key support at $3,000, bearish sentiment could escalate, potentially driving ETH towards lower support levels near $2,470 and possibly even $2,110.
Pro Tips:
Short Positions: Experienced traders might consider initiating short positions if ETH decisively breaks below the crucial $3,000 support zone on increasing selling volume.
Long-term Accumulation: Long-term investors may strategically accumulate ETH near stronger support areas at $2,470 and $2,110, after clear signs of price stabilization.
Conclusion
Ethereum (ETH) currently offers attractive opportunities, propelled by recent bullish momentum yet balanced by market uncertainties. Traders must closely observe key resistance at $4,000, critical support around $3,000, and carefully analyze trading volumes for confirmation of market direction. By maintaining disciplined risk management and strategically capitalizing on outlined scenarios, investors can effectively navigate ETH’s price action in the weeks ahead.
🔥 Tips:
Armed Your Trading Arsenal with advanced tools like multiple watchlists, basket orders, and real-time strategy adjustments at Phemex. Our USDT-based scaled orders give you precise control over your risk, while iceberg orders provide stealthy execution.
Disclaimer: This is NOT financial or investment advice. Please conduct your own research (DYOR). Phemex is not responsible, directly or indirectly, for any damage or loss incurred or claimed to be caused by or in association with the use of or reliance on any content, goods, or services mentioned in this article.
The Correction Is Over! Bull FlagThe bull flag is a popular pattern. Everybody who has seen a chart is familiar with this pattern. It is a continuation pattern.
When I say that the correction is over I am not talking about the short short-term, I am talking about the bigger picture.
Yes, bullish action is expected to start and intensify within weeks, no!, days. But still, with thousands of projects, it takes lots of time before energy (money) reaches all sectors of the market. Allow for strong variations but the correction is over which means growth.
The correction is over means that the low is already in for most pairs and will be in, in the coming days for all remaining pairs.
The correction is over means that everything will grow, just as it did after the 7-April bottom low. The difference is that this new wave will be many times bigger and stronger than before.
TOTAL2 produced an advance from early April until late May. The retrace produced a bull flag continuation pattern. The pattern has run its course, it will resolve with a new phase of growth. It won't take long. It will be obvious in a matter of days. No need to pray, Crypto is going up.
Namaste.

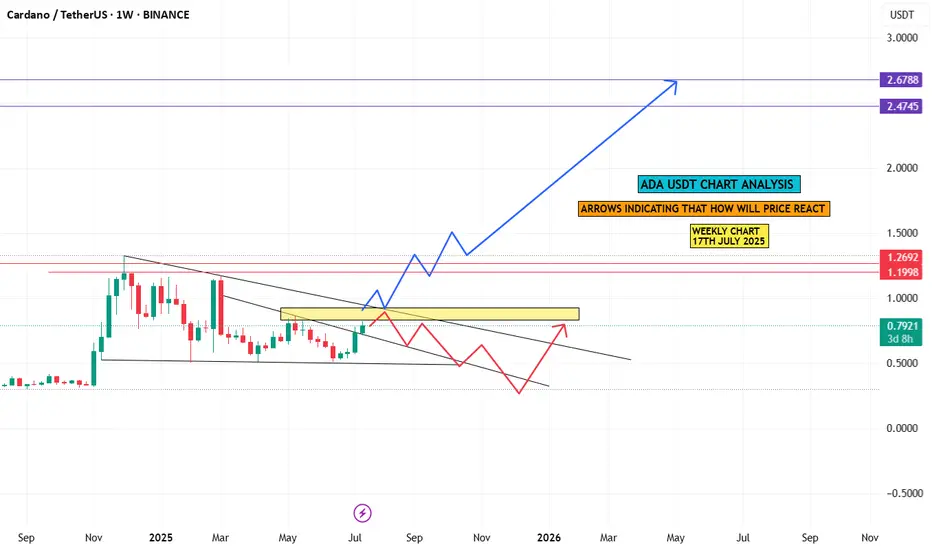
ada chart analysiscardano weekly chart analysis n arrows indicating that how will price react in upcoming
days or months,
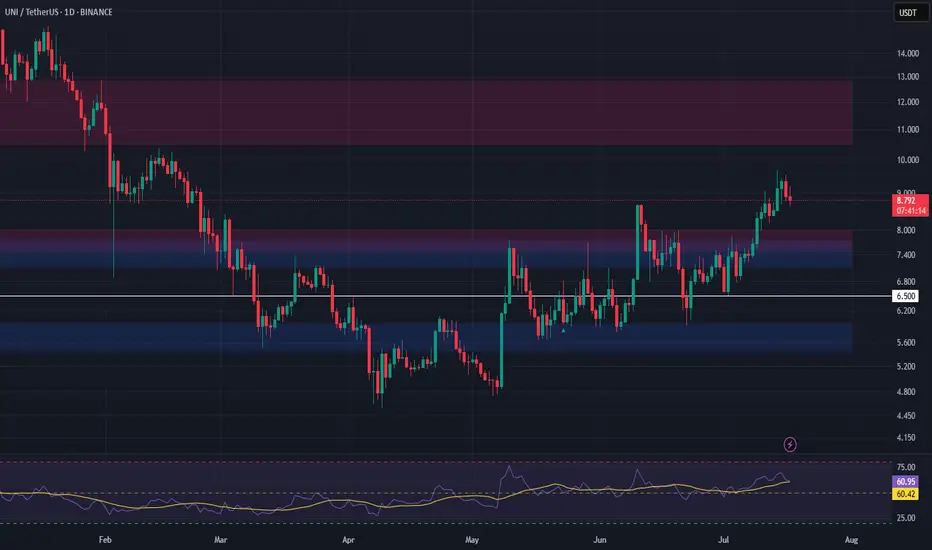
UNI Long Setup – Breakout Retest into High-Confluence SupportUniswap (UNI) has broken out of resistance and is now pulling back into a high-confluence zone, forming a strong bullish structure. The $7.13–$7.73 area presents a favorable entry on the retest.
📌 Trade Setup:
• Entry Zone Around: $7.13 – $7.73
• Take Profit Targets:
o 🥇 $10.50 – $12.85
• Stop Loss: Daily close below $6.50
ETH vs 200MA: Another TestETH on the daily has been pushed back so many times by the 200MA. Will price conquer it this time? I guess we’ll just have to wait and see.
Today is Friday, July 4th, so probably a long weekend for most traders. Somehow, price got pushed back again. Just a hunch, but I believe long traders are touching grass this weekend while sellers are grinding.
Anyway, we now have a support zone under price, made up of the 200MA and the 0.5 Fib — which, in theory, should hold against any attempts to push the price lower this weekend.
Always take profits and manage risk.
Interaction is welcome.

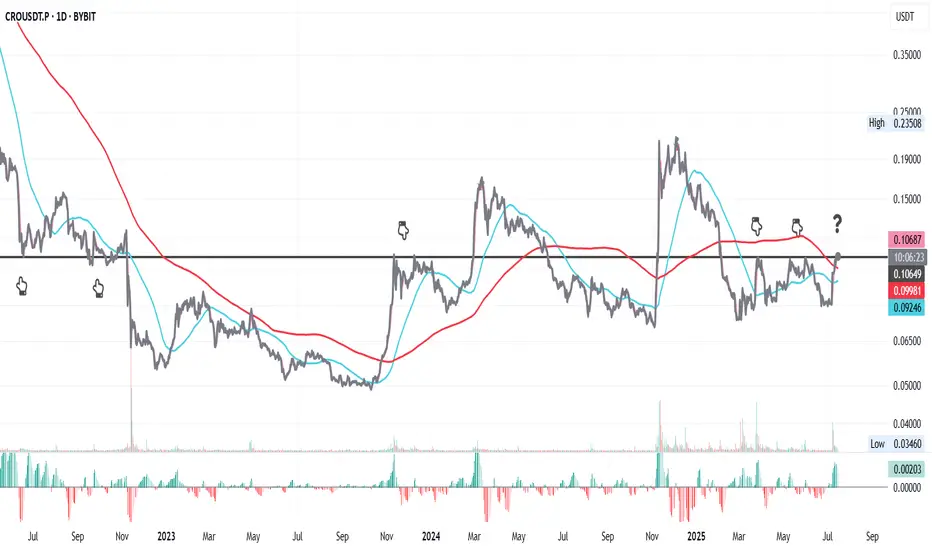
CRO at a Turning Point ?This is CRO on the daily chart.
Price has interacted multiple times with the key resistance at **0.10649** (black line). It’s now testing that level again, and there's a real possibility it flips it into support.
On top of that, CRO is attempting to reclaim the 200MA, while the 50MA is starting to flatten out—potential signs of a longer-term shift.
That said, this process might take some time and could be volatile. CRO’s relatively small market cap of \$3.33B and this week’s major macro events (starting today with CPI) could add pressure in both directions.
Always take profits and manage risk.
Interaction is welcome.
MELANIA: Divergence, Signal, BaseThis is MELANIA on the 1-day chart.
First, I want to emphasize the bullish divergence on the RSI, which started on April 21, while price continued to drop, RSI held or even moved higher.
Second, although we’re still below the 50MA and the chart doesn’t yet have a 200MA, both systems are long:
• PSAR is bullish
• MLR > SMA > BB Center
Third, it appears a base has been forming since June 27.
All these factors combined led me to open a long position, but of course, this is just my view, not financial advice.
Always take profits and manage risk.
Interaction is welcome.

NEoWave Analysis of Ethereum 2025 Cash data chart shows that Ethereum is in a corrective phase and the wave structure from (A) to (C) has been completed. Initially, we expected a flat pattern to form; however, the wave structure-(C) was not an impulse and the flat was not confirmed.
As a result, given that the wave structure (A)-(B)-(C) is corrective and the waves differ in time, it seems that a contracting triangle pattern is forming and we are currently in wave-(D) of this triangle. Furthermore, wave-(D) could rise to $3630-3880 and end. Then a price correction in the form of wave-(E) may occur. This correction could end between $2900-3086 and if this range is broken downwards, wave-(E) could decline to $2000-2230, after which the main bullish move for Ethereum is expected to begin.
Good luck
NEoWaveChart

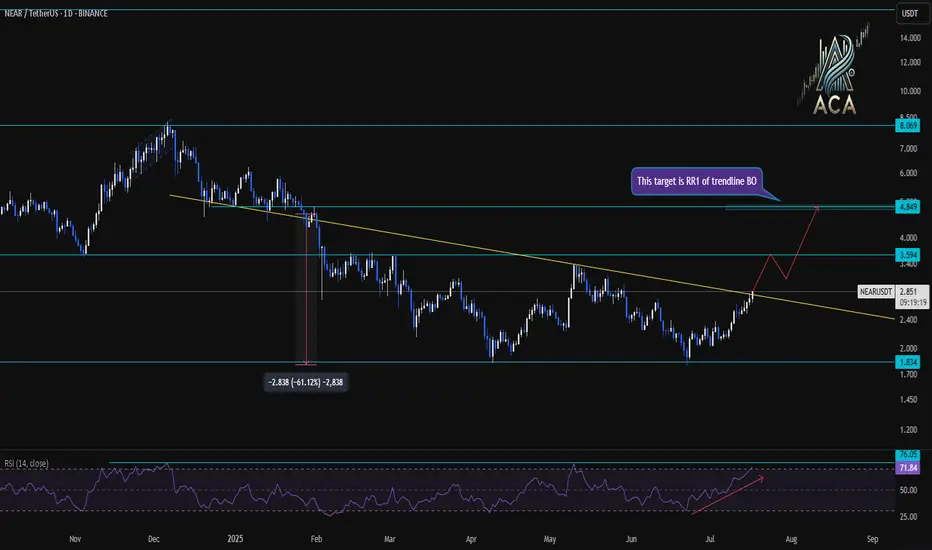
NEARUSDT Daily Chart Analysis|Strong Breakout & RSI ConfirmationNEARUSDT Daily Chart Analysis | Strong Breakout & RSI Confirmation
🔍 Let’s break down the latest NEAR/USDT daily chart, spotlighting critical resistance, target levels, and momentum signals.
⏳ Daily Overview
NEAR has confirmed a bullish breakout above its long-term descending trendline. This move comes with a surge in price and a strong daily candle—clear evidence of renewed bullish momentum.
📊 Momentum & RSI
RSI has surged to 76 (overbought zone), higher than the typical overbought level of 70. This spike reflects strong buying pressure, but also signals the possibility of near-term pullback or consolidation.
RSI-Momentum Convergence: The RSI uptrend is in lockstep with price action, confirming that bullish momentum is genuine and backed by increasing strength—not a divergence.
🔑 Key Levels
- First Resistance: $3.59—watch this closely as the next hurdle for bulls.
- Breakout Target: $4.85, which corresponds to the measured move (RR1) from the trendline breakout and aligns with the next horizontal resistance.
- Extension Target: $8.01 if momentum persists and price sustains above $4.85 in the coming weeks.
📌 Highlights
- Clear trendline breakout validated by strong RSI convergence.
- RSI has entered the overbought zone (76), backing momentum—watch for either breakout follow-through or brief cooling.
- Key levels: $3.59 (first resistance), $4.85 (breakout target).
🚨 Conclusion
Momentum is with the bulls after the breakout. Eyes on $3.59 as the near-term test; a clean move above opens up $4.85 and potentially $8.01 if momentum continues.
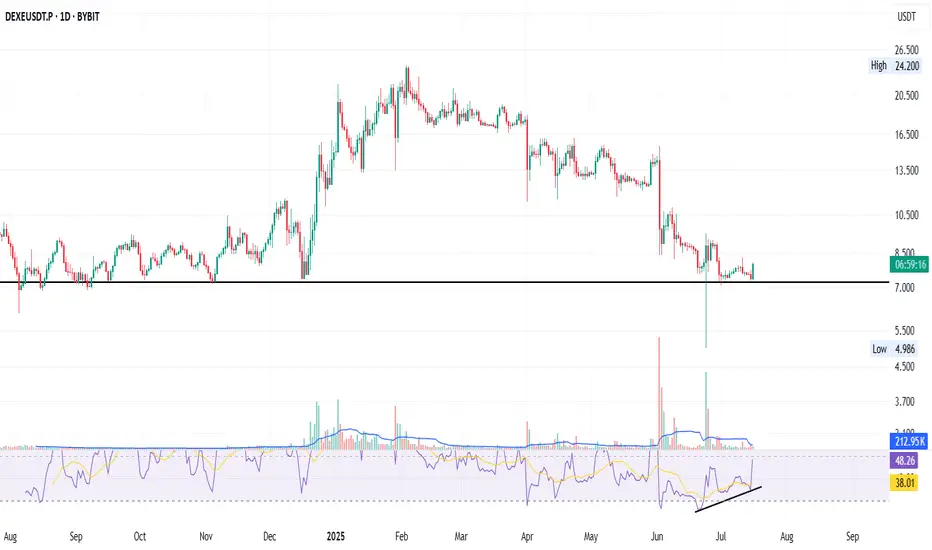
DEXE: Bounce + RSI Divergence + DeFi Strength
DEXE on the daily just bounced off an 11-month-old support - the key black line.
A strong bullish divergence on the RSI has been building for over a month — now confirming with momentum.
That long green wick under support? It’s signalling buyer interest and possible accumulation.
Fundamentals:
DEXE powers decentralized governance (DAO) with AI + DeFi alignment.
It enables transparent on-chain decision-making and sustainable DAO growth.
Backed by real partnerships, aiming for fair, merit-based participation.
I’m long: not financial advice.
Always take profits and manage risk.
Interaction is welcome.
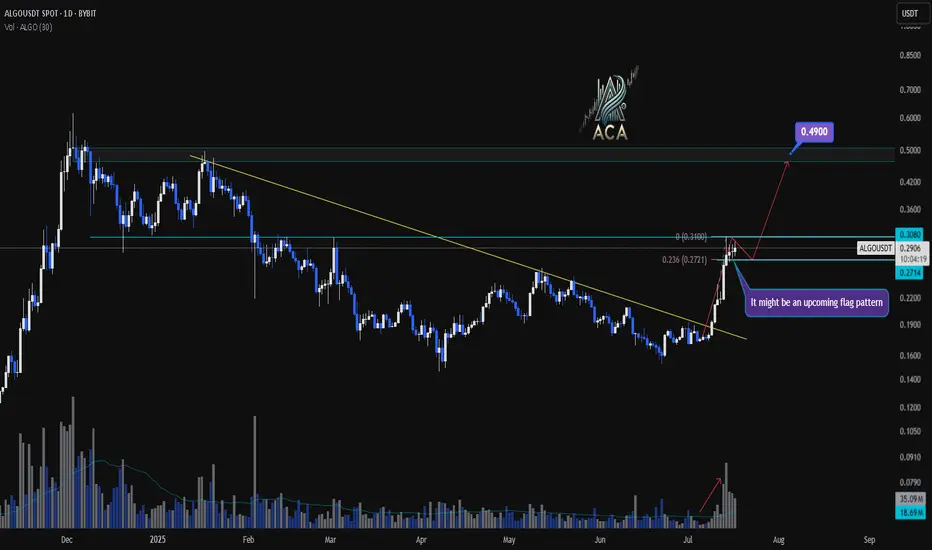
ALGOUSDT Daily Chart Analysis | Continuational patternsALGOUSDT Daily Chart Analysis | Momentum Picks Up on Higher Timeframe
🔍 Let’s break down the latest ALGO/USDT daily chart, highlighting a shift in market structure and key bullish signals.
⏳ Daily Overview
A decisive breakout above the long-standing descending trendline has flipped the narrative for ALGOUSDT. Increased volume during the breakout points to robust bullish momentum, suggesting buyers are regaining control at this multi-month inflection point.
🔔 Flag Pattern & Chart Structure
- Bullish flag pattern is emerging after the recent breakout, as price consolidates in a tight range—a classic continuation formation.
- Former trendline resistance is now acting as support, confirming a notable shift on the higher timeframe.
📐 Fibonacci & Target Levels
- The 0.236 Fibonacci retracement at $0.2771 is providing immediate support, with price consolidating above this anchor level.
- Upside targets:
- First resistance at $0.3080, which aligns with horizontal supply and previous pivot highs.
- If the flag pattern resolves upward, the next Fibonacci extension points to $0.4900, marking a significant confluence and potential for further gains.
📊 Key Highlights
- Strong daily candle and surging volume confirm momentum shift.
- Watch the developing flag pattern for breakout confirmation.
- Major trendline break on the daily signals structural reversal.
- $0.3080 is the immediate target; $0.4900 is the extended objective from the flag/Fibonacci alignment.
🚨 Conclusion
ALGOUSDT is setting up a compelling bullish scenario—keep a close eye on price behavior at the flag and $0.3080 level. A breakout may trigger the next impulsive move toward $0.4900.
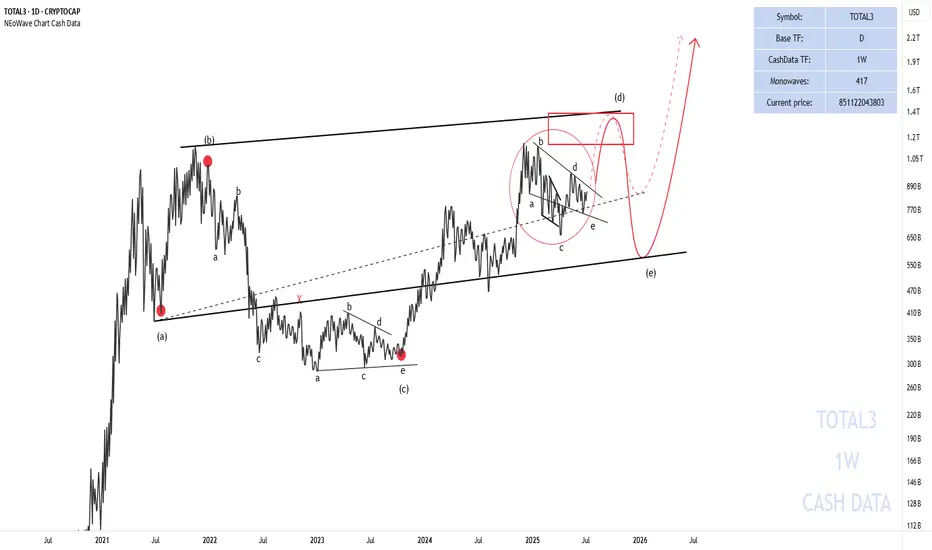
Has the Alt Season Started?Total 3 seems to be forming a neutral triangle (marked with a red circle) and will soon move towards the red box to complete wave-(d) of the higher degree triangle.
The price path is marked for you on the chart.
Good luck
NEoWave Chart
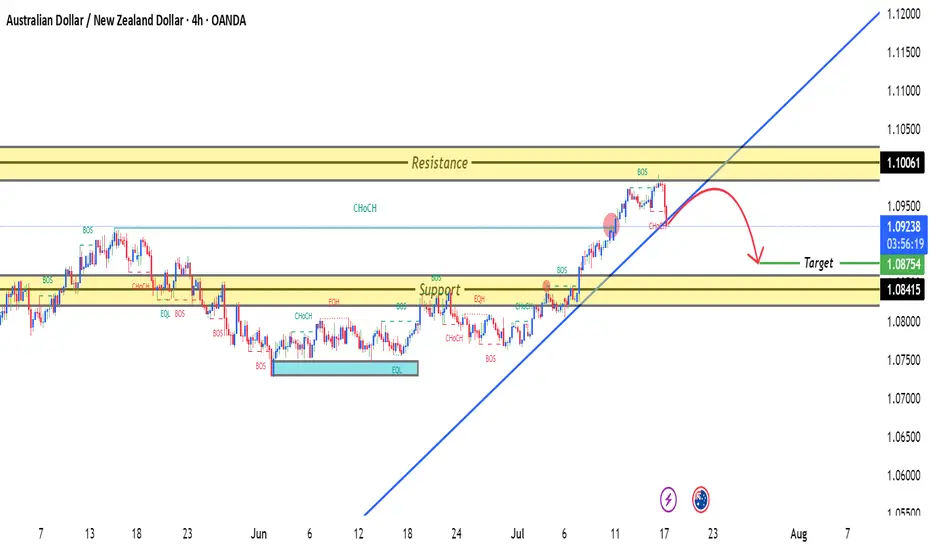
AUDNZD 4H TIME FRAME ANALYSISAUDNZD is currently in a short-term downtrend on the 4-hour chart. Price has been forming lower highs and lower lows, confirming bearish pressure. Recent candles show rejection at higher levels, supporting downside continuation.
1.09400 – 1.09550: Strong resistance zone where price was previously rejected multiple times.
1.09380 (your entry) aligns with a minor lower high, reinforcing this level as a valid sell area.
ETHUSD 4H TIME FRAME ETHUSD is showing bullish momentum on the 4-hour chart with a strong structure to support further upside. The setup targets a potential continuation to 3,718.8, with protective risk control below 3,250.4. Watch for a clean break above 3,540 to accelerate the bullish move.

"ORDI/USDT: Pirate’s Treasure Trade! Bullish & Loaded"🚨 ORDI/USDT HEIST ALERT! 🚨 ORDI/USDT Bullish Raid Plan (Thief Trading Style) 💰🎯
🌟 Attention Market Pirates & Profit Raiders! 🌟
🔥 Thief Trading Strategy Activated! 🔥
📌 Mission Brief:
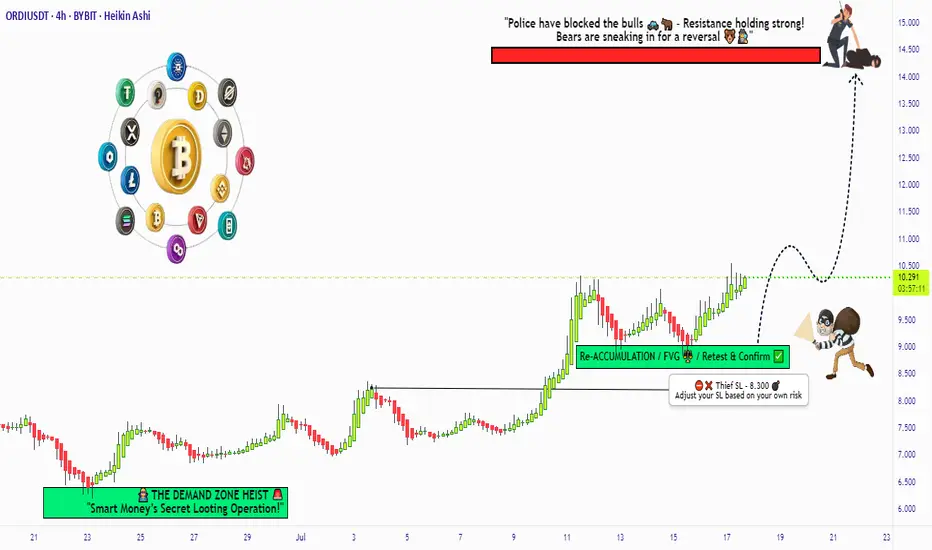
Based on our elite Thief Trading analysis (technical + fundamental heist intel), we’re plotting a bullish robbery on ORDI/USDT. Our goal? Loot profits near the high-risk resistance zone before the "Police Barricade" (bear traps & reversals) kicks in!
🚨 Trade Setup (Day/Swing Heist Plan):
Entry (📈): "The vault is open! Swipe bullish loot at any price!"
Pro Tip: Use buy limits near 15M/30M swing lows for safer pullback entries.
Advanced Thief Move: Layer multiple DCA limit orders for maximum stealth.
Stop Loss (🛑): 8.300 (Nearest 4H candle body swing low). Adjust based on your risk tolerance & lot size!
Target (🎯): 14.400 (or escape early if the market turns risky!).
⚡ Scalper’s Quick Loot Guide:
Only scalp LONG!
Rich thieves? Go all-in! Broke thieves? Join swing traders & execute the plan slowly.
Use trailing SL to lock profits & escape safely!
💎 Why ORDI/USDT? (Fundamental Heist Intel)
✅ Bullish momentum in play!
✅ Macro trends, & intermarket signals favor upside!
✅ News-driven volatility? Expect big moves!
⚠️ WARNING: Market Cops (News Events) Ahead!
Avoid new trades during high-impact news!
Trailing stops = Your best escape tool!
💥 BOOST THIS HEIST!
👉 Hit LIKE & FOLLOW to strengthen our robbery squad! More lucrative heists coming soon! 🚀💰
🎯 Final Note: This is NOT financial advice—just a thief’s masterplan! Adjust based on your risk & strategy!
🔥 Ready to Raid? Let’s STEAL Some Profits! 🏴☠️💸
👇 Drop a comment & boost the plan! 👇
(🔔 Stay tuned for the next heist!) 🚀🤫
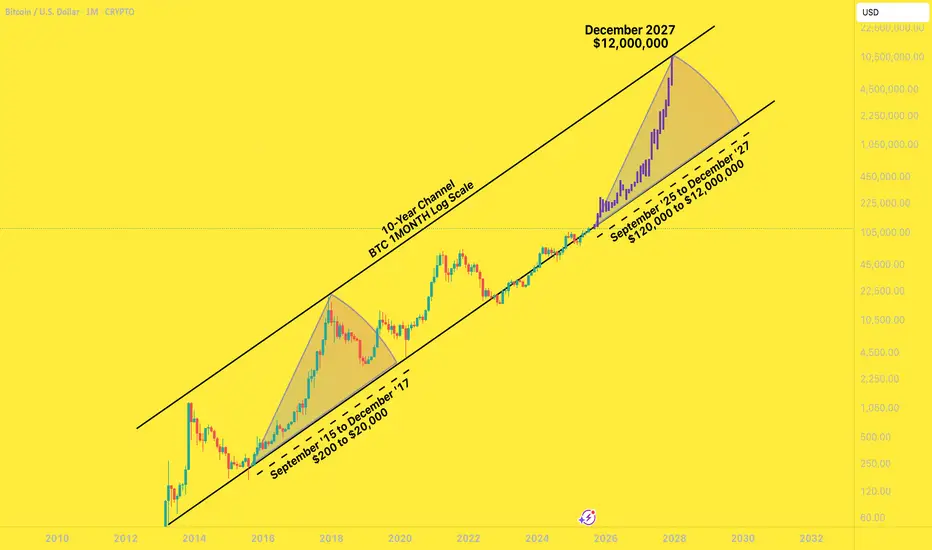
BTC to $12,000,000 December '27I had a years-old bookmarked chart from @MillionaireEconomics that I wanted to update and pick a random, extremely bullish candle pattern from the last time BTC came off the bottom channel to slap on it.
Riddle me this:
Why shouldn't Bitcoin go to $12,000,000 by December 2027?
Saylor continues to lead the way for global companies to scramble to build their own BTC warchests. These early adopters are having investor money dumped into them by the truckload.
Countries are stacking BTC
The BTC ETFs are a smash hit
Trump is all for making his own multi-billy family bitty stack
Mid-curvers will sell far too early, for far too little.
In the next two years, you'll be bombarded with countless, seemingly good reasons to sell your Bitcoins for hundreds of thousands of dollars - and then millions of dollars.
A shocking number of people will be far too early to sell. They will wake up in a cold sweat, night after night, haunted by their "could-have-been" stack, the number that updates in their head ten times a day, going up by six or seven figures a day .
... until they FOMO right back in at $11,999,999.
ETH — Trade Closed! Massive Profit SecuredI’m officially closing my Ethereum position — this trade is now a success story!
I posted right here that ETH was a buy at $2400, then doubled down at $1800. I even echoed the call on Reddit for good measure.
Today, I’m liquidating the entire position with a huge gain. No regrets, just clean execution. 🧠💸
To all the mad lads still holding — good luck and may your conviction be rewarded.
See you next year for the next big swing.
Take your profits, you lunatics! 😄🔥

Total crypto MC - 1DThe total crypto market capitalization on the daily timeframe has formed a Falling Wedge pattern, which is typically a bullish reversal pattern. The price has broken out above the upper resistance line of the wedge, confirming the breakout. Currently, the price is undergoing a retest of the breakout level, which now acts as support. If this support holds successfully, it is expected that the market will experience an upward move in the near term, signaling potential bullish momentum.

HBAR Is About to Melt Faces!I see a powerful reversal coming on HBAR due to a breakout from this falling wedge pattern. A new high above the $0.35 resistance should be coming soon. I’m bullish!
As always, stay profitable.
– Dalin Anderson

#DOGEUSDT: Swing Trade Targeting $0.50| Swing Trade| Setupsfx_|Hey there! Everyone
DOGEUSDT is at a turning point right now, and it looks like it might just reverse course and head towards its target price of $0.50. This is a swing trade, which means it could take a few weeks, or even months, to complete.
We’d really appreciate your support.
Thanks
Team Setupsfx_

Ethereum Breakout and Liquidations – A Lesson in Bear Traps and 📚💥 Ethereum Breakout and Liquidations – A Lesson in Bear Traps and Risk Management 🧠📈
Today, July 16th, Ethereum gave us a real-time masterclass in market psychology and risk management.
Let’s start with the facts:
📊 Liquidation Data
🔻 $36.34M in long liquidations
🔺 $86.02M in short liquidations
💣 Total ETH liquidations: $122.36M (data mentioned on video might differ, i made a small mistake)
🌐 Across crypto: $351M liquidated (more shorts than longs)
This imbalance tells us one thing: a bear trap played out, and it played out hard.
🧠 Educational Takeaways
1. Bear Traps Are Real — and Expensive
A bear trap occurs when the market appears bearish, drawing in short sellers — only to violently reverse upward. Today’s Ethereum move was a textbook example. If you’ve been following my analysis, we discussed the regression lines, divergences, and structure that all warned against going short at support.
2. Open Interest and Sentiment Signals
Open interest has been declining — which means fewer speculative positions. That often creates space for a real, organic move, not one fueled by overleveraged noise.
3. Spot vs. Leverage – Risk Control First
Leverage isn’t the enemy — unmanaged leverage is. I personally use a dedicated high-risk account to trade fast setups. This keeps my core capital untouched and my psychology stable.
✅ Risk is defined before the trade.
✅ Entries are structured like bullets — small, multiple attempts.
4. The Mental Game is the Real Game
Trading isn’t just technical. It’s deeply psychological. Whether you’re trading Ethereum, Bitcoin, or altcoins like AVAX and XRP, emotions must be managed before capital is deployed.
5. Like-Minded Community = Sharper Edge
My best trades and insights often come from conversations with trusted, sharp minds in this space. Surrounding yourself with serious traders can be the difference between evolving — and evaporating. To my brother Vlatko (met on Tradingview, been hanging around online ever since, met in person once, now a true friend that we frequently disagree but always agree to respect and empower each other = The power of our community here on TV!)
Final Word:
When markets move fast, lessons appear even faster.
Study the traps. Respect the levels. Structure your risk.
And above all: trade with a plan that allows joy.
One Love,
The FXPROFESSOR 💙
Disclosure: I am happy to be part of the Trade Nation's Influencer program and receive a monthly fee for using their TradingView charts in my analysis. Awesome broker, where the trader really comes first! 🌟🤝📈

Breakout Alert: $DEEP Aiming for 80%+ If Resistance Flips$DEEP/USDT just broke out of a clean downtrend line and is now approaching a strong resistance zone around $0.22.
Momentum looks solid, and the breakout is backed by strong bullish candles.
If price can flip this zone into support, we might see a potential 80%+ move toward the $0.34–$0.35 region.
DYOR, NFA
