COIN long -- currently in Wave 3 of 5 wave advance I've been using Elliott Wave Theory to look at COIN's price action. We seem to be in the middle of Wave 3.
- Wave 1: April 7, 2025 to May 22, 2025
- Wave 2: May 23, 2025 to June 13, 2025 - we pulled back right below the 23.6% Fibonacci retracement level with ~$244 serving as support.
- Wave 3: June 14, 2025 - now. The third wave usually has 5 distinct sub-waves. As of July 7, 2025 We appear to be in the 3rd sub-wave of wave 3. Using the upper channel line, price target for this wave is around $408-$410. Quite possible if we see BTC move up explosively, which also seems imminent given the highest weekly close on July 6, 2025.
COIN is a very volatile stock that has explosive moves to the up and downside. I think we still have more room to run in this current wave 3--even beyond sub-wave 1 peak at $380.
Cryptomarket

Bitcoin Breaks All-Time High: What’s Next?Bitcoin (BTC) has once again captured the world’s attention by smashing through its previous all-time high (ATH). This milestone has sparked excitement and speculation across the crypto community and beyond. But the key question remains: Will BTC continue its upward trajectory, or is a correction on the horizon?
Long-Term Outlook: The Bullish Case
In the long run, the fundamentals for Bitcoin remain strong. Several factors support a positive outlook:
Institutional Adoption: More institutional investors are entering the market, providing greater liquidity and legitimacy.
Scarcity and Halving Cycles: Bitcoin’s fixed supply and periodic halving events historically drive long-term price appreciation.
Macro Trends: Ongoing concerns about inflation and fiat currency devaluation continue to make BTC an attractive hedge.
Given these dynamics, we believe Bitcoin’s long-term trajectory remains upward.
Short-Term Caution: A Correction May Be Coming
While the long-term view is optimistic, the short-term picture may be less rosy:
Overheated Market Indicators: Rapid price surges often lead to overbought conditions, increasing the likelihood of a pullback.
Profit-Taking: After breaking ATH, some investors may lock in gains, adding selling pressure.
Technical Resistance: Historical patterns suggest that corrections often follow major breakouts.
We anticipate a potential correction, possibly pulling BTC back to the $90,000 range. This adjustment could unfold in the coming week or weeks as the market digests recent gains.
What Should Investors Do?
Stay Calm: Volatility is part of the crypto landscape. Corrections are healthy for sustainable growth.
Focus on Fundamentals: Remember why you invested in BTC in the first place.
Consider Dollar-Cost Averaging: Spreading out purchases can help mitigate the impact of short-term swings.
Conclusion
Bitcoin’s break above its all-time high is a testament to its enduring appeal and the growing confidence of investors. While a short-term correction may be likely, the long-term case for BTC remains compelling. As always, prudent risk management and a focus on fundamentals are key to navigating the exciting—and sometimes turbulent—world of crypto.
Do not consider it as investment advice.
#crypto #bitcoin #analysis

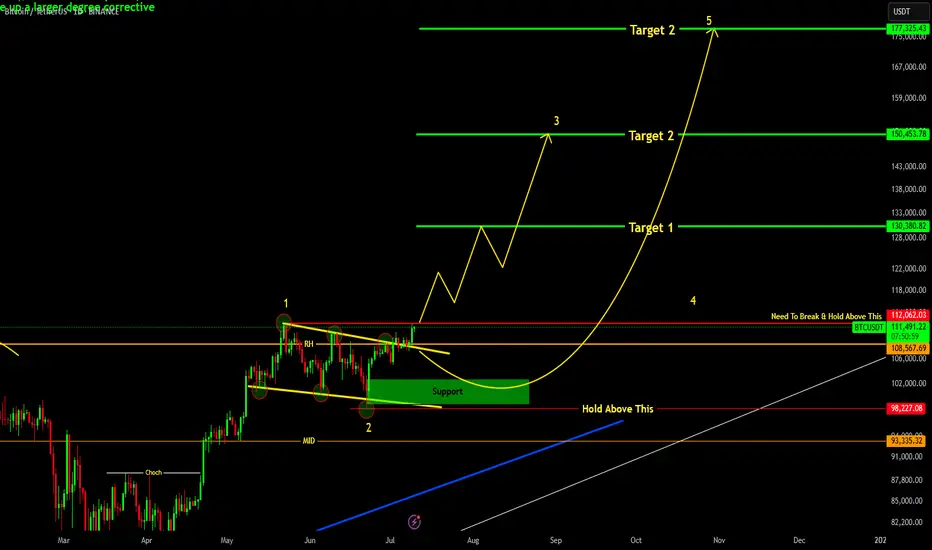
ARE YOU READY FOR 150K+ BTC RALLY !!!BTC has successfully broken out it's bull flag resistance and currently testing above it.
Major resistance resides above is 112K level , if we successfully break and hold above it then easy targets would be 130-150k levels.
Elliott Wave Count final targets 180k level.
If we goes below 106k level then we may see BTC getting into support region of 102-100K region.
For all of this, BTC should remain above 98K level.
Wyckoff Pattern- To understand trading at its core, you need to understand the Wyckoff Theory.
- Everything you need is in the chart and yes, it's simple and might look like copy-paste, but it's pure Wyckoff.
- Remember this post i made in 2021 ? check it again :
Remember, trading is like a washing machine, it shakes you up, spins you around, and pressures you to sell when you should be buying or Holding.
Not a price prediction, just a smarter way to level up your strategy.
Happy Tr4Ding !

SOL TO 167?Good morning folks
so it looks like we are correcting down possibly down to 153 then seeing a drive up to 167. What are your thoughts on the market for Solana
Looks like things are heating up for Solana
Kris/Mindbloome Exchange
Trade Smarter Live Better

ETH Not Taking Profits Yet – System Still Long
ETH on the 4H is pausing right at the 3D 200MA, picture perfect, actually.
Now we wait to see if this resistance flips into support.
If that happens, price could go for the 0.382 Fib level around $3,040.
Of course, that’s the ideal scenario, but the market could easily contradict me, so keep that in mind.
Personally, it’s not time to take profits yet.
Both my 4H and 1D systems are still in long positions.
For extra safety, you could set a partial take-profit just under the second-to-last PSAR dot.
Always take profits and manage risk.
Interaction is welcome.

TradeCityPro | Bitcoin Daily Analysis #124👋 Welcome to TradeCity Pro!
Let’s dive into the analysis of Bitcoin and key crypto indicators. As usual, I’ll review the futures triggers for the New York session.
⏳ 1-Hour Timeframe
On the 1-hour timeframe, as you can see, Bitcoin made a bullish move yesterday after stabilizing above the 109391 level and managed to register a new ATH around the 112000 level.
⭐ The resistance at 111747 has effectively held back further price increases, and the price has reacted to it and entered a corrective phase.
✔️ I believe the correction could continue down to 110256. The next lower support levels are 109391 and 107853.
📈 If you already have a long position open, I recommend holding it. If the 111747 resistance breaks, a strong bullish trend could begin, and having an open position from earlier could have a big positive impact on your account.
🔼 If 111747 is broken, we can consider opening new long positions. If this level breaks, I’ll post a higher timeframe analysis to identify the next major resistance levels.
💥 RSI entering the Overbuy zone and rising volume would provide strong confirmation for this position.
👑 BTC.D Analysis
Bitcoin Dominance is still dropping. Yesterday, after breaking 64.81, it continued its downward move and is now approaching the 64.49 level.
🔍 If this level breaks, the drop could continue further, but in my opinion, after the recent drop, it's time for BTC.D to enter a correction phase.
📅 Total2 Analysis
Total2 has also had a bullish move, breaking through the 1.18 and 1.2 levels, and continues to rise.
🎲 The next resistance is at 1.24, which the price may target. However, I think there’s a high chance of a correction or consolidation phase starting soon.
📅 USDT.D Analysis
Looking at Tether Dominance, after the recent drop and the break of 4.72, it reached the 4.63 level and has formed a base there.
✨ If 4.63 breaks, USDT.D could head toward 4.56. In case of a pullback, the first level to watch is 4.72.
❌ Disclaimer ❌
Trading futures is highly risky and dangerous. If you're not an expert, these triggers may not be suitable for you. You should first learn risk and capital management. You can also use the educational content from this channel.
Finally, these triggers reflect my personal opinions on price action, and the market may move completely against this analysis. So, do your own research before opening any position.

SUI Next Upside Target🚀 After holding above the April low and completing a 3-wave pullback in wave (2), CRYPTO:SUIUSD is now advancing in a potential wave (3).
Momentum is building, and the next upside target lies in the equal legs zone at $4.80 – $5.40, which could eventually lead to a new all-time high.

TradeCityPro | ADA Eyes Breakout from Bearish Channel Top👋 Welcome to TradeCity Pro!
In this analysis, I want to review the ADA coin for you. The Cardano project is one of the oldest and most popular projects in crypto.
🔍 The coin of this project has a market cap of 22.21 billion dollars and is ranked 10 on CoinMarketCap.
📅 Daily Timeframe
On the daily timeframe, ADA is moving downward within a descending channel and is currently trying to break out of the channel from the top after reaching a support zone.
⭐ One positive sign for buyers is that they didn’t let the price reach the bottom of the channel. Instead, they used the overlap between the midline of the channel and the key 0.5579 zone (marked as a support area) to stop the price from falling.
✨ However, as long as the coin is fluctuating inside this channel, the trend remains bearish. Holding the midline is not a sign of trend reversal yet, but it does indicate weakening of the current trend and may act as one of the bases for a future reversal.
✅ Looking at the RSI oscillator, we can see that each time the price tried to break the channel’s top, RSI reached the 70 area and got rejected, causing the price to drop.
⚡️ Currently, the price is very close to the top of the channel, but RSI has just broken above the 50 line and is moving upward. This is a bullish sign for buyers, as it shows there is still room for upward momentum, which increases the chance of a breakout.
🎲 The nearest trigger for confirming the breakout from the channel is the 0.7212 zone, which is a bit far, and the price will likely form a higher low and high before reaching it, confirming the breakout earlier.
💥 But based on the current data, the breakout trigger remains at 0.7212, and for spot buying, this is the first valid entry level.
👀 Personally, I’m not adding any altcoins to my portfolio right now, as Bitcoin Dominance is still in an uptrend. As long as this trend continues, large capital flows into altcoins are unlikely.
🛒 More reasonable triggers for spot entries would be a breakout above the 0.8414 supply zone. If I were to buy, I’d enter at this level. The final trigger is 1.1325, which is quite far from the current price, and if BTC Dominance continues upward, it could take several months to reach this zone.
🔽 If you already hold this coin in spot, your stop-loss can be set at a break below the 0.5579 level. A breakdown here would also provide a good short setup in futures, as the price could move toward the bottom of the box or the static level at 0.4322.
📝 Final Thoughts
This analysis reflects our opinions and is not financial advice.
Share your thoughts in the comments, and don’t forget to share this analysis with your friends! ❤️

DOGEUSDT - near support? Holds or not??#DOGEUSDT... market just reached near his supporting area even ultimate area. That is around 0.10 and current market price is around 0.15
If market holds current supporting area then we can expect a bounce from here.
Below 0.10 we will never see again bounce ... Note that.
Good luck
Trade wisely

TRBUSDT - at CUT n REVERSE Area? What's next??#TRBUSDT - market just reached at his ultimate supporting region and below that we can expect a further straight drop.
So we will cut n reverse below our mentioned region that is around 35 (region neck line)
Good luck
trade wisely

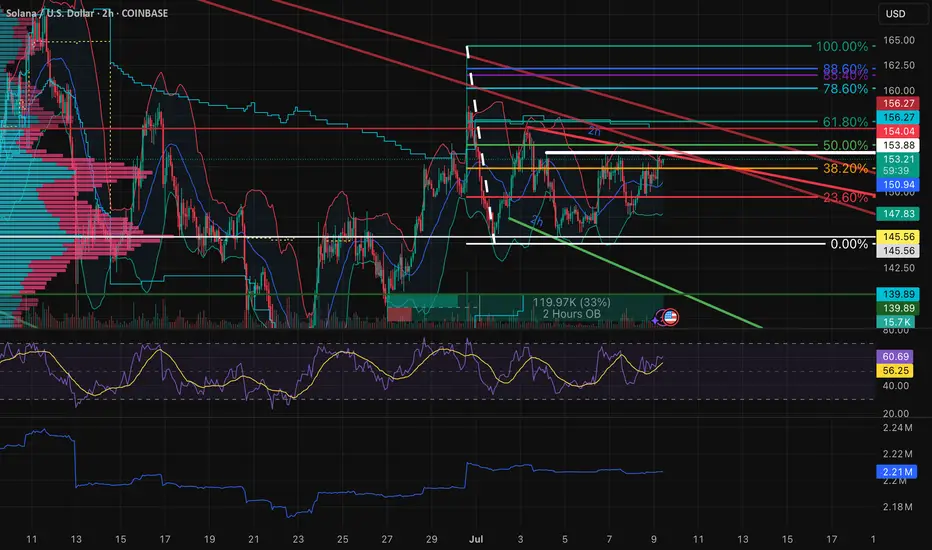
$SOL | Triple Top or Launchpad?Macro to Micro Context:
SOL is now testing a third rejection in the upper 153s, forming a textbook triple top just under a multi-month descending trendline and major Fib resistance. This ceiling has held firm since late June, despite higher lows grinding up from below. Price is now squeezed tightly between compressing demand and stacked supply, with volatility contraction apparent across the board.
The structure is coiling hard but momentum and volume must confirm resolution before positioning aggressively.
Structural & Momentum Breakdown:
Resistance Layering (Reinforced):
Triple Top: Price has repeatedly failed to break above the upper 153s.
Fib Overlap: 50%–61.8% retracement range aligns with both trendline resistance and OB stack.
Order Block Stack: Resistance from mid-153s to low-154s is now reinforced across timeframes (30M → Daily).
Momentum Shifts:
RSI Divergence: Lower highs on RSI across 2H/1H, despite flat or slightly higher price.
PVT Flattening: No fresh accumulation during recent tests.
Volume Decline: Progressive volume deterioration on each retest distributional tone building.
Demand Shelf:
Key demand and support range from low-150s to mid-151s has held through three separate dips.
This is the immediate pivot zone — lose it and vacuum effect likely down into the upper 140s.
Updated Trade Plan:
Rejection Short Setup:
Entry: Breakdown through mid-151s with confirming sell volume.
Stop: Above low-154s to account for potential deviation wicks.
TP1: Upper 148s (first OB cluster).
TP2: Mid-146s (Fib + minor support).
TP3: Low 140s (macro demand + wedge base).
Bear Confirmation: RSI breakdown + volume expansion + OB flips into resistance.
Breakout Setup (Only on Clear Validation):
Entry: Strong candle close above low-154s with breakout volume.
Stop: Below low-151s — invalidation of reclaim.
TP1: Upper 157s (Fib zone).
TP2: Low 160s (swing high area).
TP3: Upper 160s (macro breakout expansion).
Bull Confirmation: RSI > 62 on 2H, strong PVT rise, and flip of local OB into demand.
Risk Warning:
Triple tops near macro resistance are high-risk unless clearly broken. This zone is overloaded with historical rejection. Don't front-run the breakout — volume will show you who's in control.
Closing Thoughts:
With a confirmed triple top now visible, SOL is facing its most important rejection zone in weeks. Bulls must reclaim with strength or this becomes a clean setup for rotation into the mid to low 140s. Patience and confirmation are key here. Keep risk asymmetric.
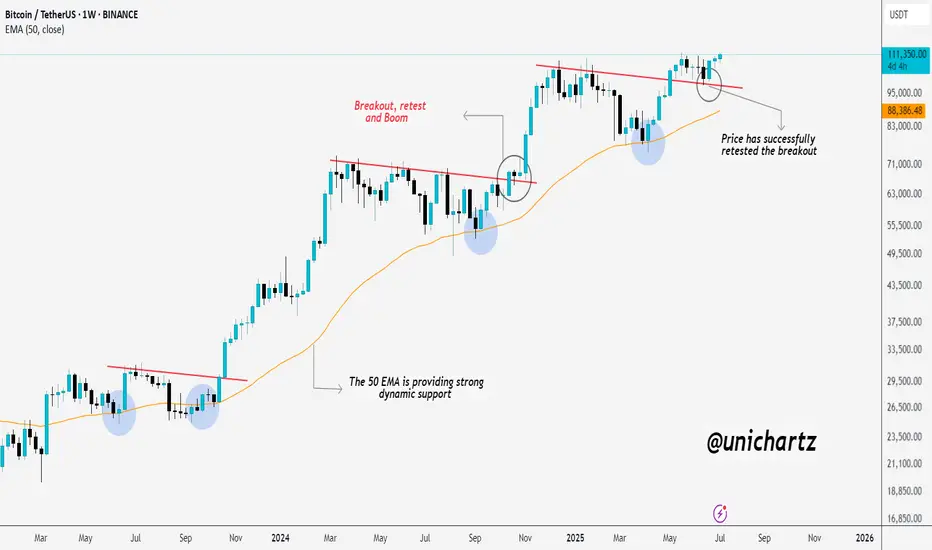
50 EMA Magic: Bitcoin Explodes After Perfect Retest!CRYPTOCAP:BTC just made a new All-Time High (ATH) — exactly as mentioned!
It broke out, retested perfectly, and blasted off.
The 50 EMA is acting like a rocket launchpad, giving price solid support every time.
Bullish Sign FIL / USDTBreak and retest high and make a new higher low also there is a fake breakout on Weekly
Target : 3
Stop : 2.36

$XRP - Falling Wedge Breakout is CookingRipple is forming a simple yet perfect setup
There is a strong horizontal support level of $2.11 that was established back in December of 2024 and has held the price perfectly (with only one breakdown) since then. Moreover, at that time a massive Falling Wedge started forming and is still doing it up to this day.
Talking about resistances, there is a $2.45 one. Not very strong, but solid enough to form a decent horizontal channel within which the price moves.
So, as the result we have the following structure: CRYPTOCAP:XRP has been consolidating above strong support for 6 months already and formed a pattern that suggest upcoming upward movement. The perfect entry spot in LONG will be at the breakout&retest of the both $2.45 resistance and Falling Wedge resistance (they perfectly correlate) .
Target zone of $3.5 - $4 can be reached within the next 3 - 5 months.

$BTC Daily Outlook BYBIT:BTCUSDT.P
Macro Picture
Weekly Chart
Both Bias & Momentum aligned bullish
Moving towards 111968.0 vLevel (HH) - ATH
Be careful with Weekly FA from that Level
More upside room from here
vLevels Range between 111968.0 - 77083.5
Daily Chart
Both Bias & Momentum aligned Bullish
Failed Auction at 102000.0
Validated from Volume Footprint Charts - Selling Delta trapped on this Failed Auction - POC & Value Area at Wick Lows
vLevels Range between 111968.0 - 102000.0
More Upside room from here, but overall consolidation for now as we are inside a High Volume Node
A pullback would be ideal to look for entries
10-Hour Chart
Price is currently inside an Inside Bar Range between 109740.9 - 107134.7
Overall momentum from the Intraweek Chart (10-Hour) is bearish due to a Failed Auction around 109740.9
Need to wait for confirmation for New Failed Auction Today.
vLevels zone around 105335.0 - 104567.0
Would be nice to have a pullback towards this zone, in which we can start looking for rejections for Intra-Week Longs
Nice zone to look for longs is also IB Range Low 107134.7
Intraday Picture
1-Hour Chart
No outlook for now, waiting for Intra-Week Chart Confirmation
No shorts from here, as HTF bias & momentum remain bullish
Patience - Overall range, don't want to get chopped here.
10-Minute Chart
No Outlook for now, waiting for MTFs and HTFs confirmation
Bitcoin Outlook — Narrative Recap
On the higher time-frames the picture is straightforward: both weekly and daily bias and momentum are in sync to the upside. Price is grinding toward the prior all-time high vLevel at 111 968 USD. Treat that level with respect, if a weekly failed auction (FA) forms there, it could mark the next inflection, but for now there is still air between price and that resistance. The broader weekly value range spans from 111 968 USD down to 77 083 USD.
The daily chart reinforces the bullish thesis. A failed auction printed at 102 000 USD, and volume-footprint data show sell-side delta trapped at those wick lows; the point of control and value area also sit there. 102 k is now strong support. Price is chopping inside a high-volume node, so a healthy pullback toward 102 k (or at least into value) would be the ideal place to reload longs before the next push higher.
Drop to the 10-hour “intra-week” view and momentum tilts short-term bearish. Price is boxed inside an inside-bar range between 109 741 USD and 107 135 USD after a failed auction at the range high. The preferred play is patience: let price drift into either the IB low at 107 135 USD or, even better, the deeper vLevel cluster at 105 335 USD – 104 567 USD. There we’ll watch for a fresh failed auction or obvious seller exhaustion to trigger new longs targeting the ATH zone.
On the 1-hour and 10-minute intraday charts there is no edge yet, conditions are choppy and hostage to the intra-week setup to align with the Higher Timeframes. With higher-time-frame bias still firmly bullish, fading strength makes little sense; stand aside until the 10-hour chart confirms a pullback and reversal.
Bottom line: stay bullish, stalk a pullback, and look to join strength from 107 k or 105–104 k. A decisive daily close back below 102 k would force a rethink; until then, patience is the edge.

ZBCN/USDT | Breakout from Downtrend Channel | 360%+ Potential !!ZBCN has broken out of a clean falling channel on the 4H timeframe. This setup resembles the earlier rally in May that delivered over 350% upside. We may be setting up for another explosive move, contingent on a successful retest.
Trade Setup:
Entry (on retest): 0.002901 – 0.003021
Stop Loss: 0.00243 (below channel low)
Targets:
0.00375
0.00510
0.00685
Long-term target: 0.01137
Total potential upside: ~360%
Structure Analysis:
Price is now out of the descending channel
Previous move from similar breakout yielded ~357%
RSI climbing with volume surge — momentum shift evident
Watching BTC for macro support
This could be a game-changing entry for medium to long-term holders if the retest holds.
DYOR | Not financial advice

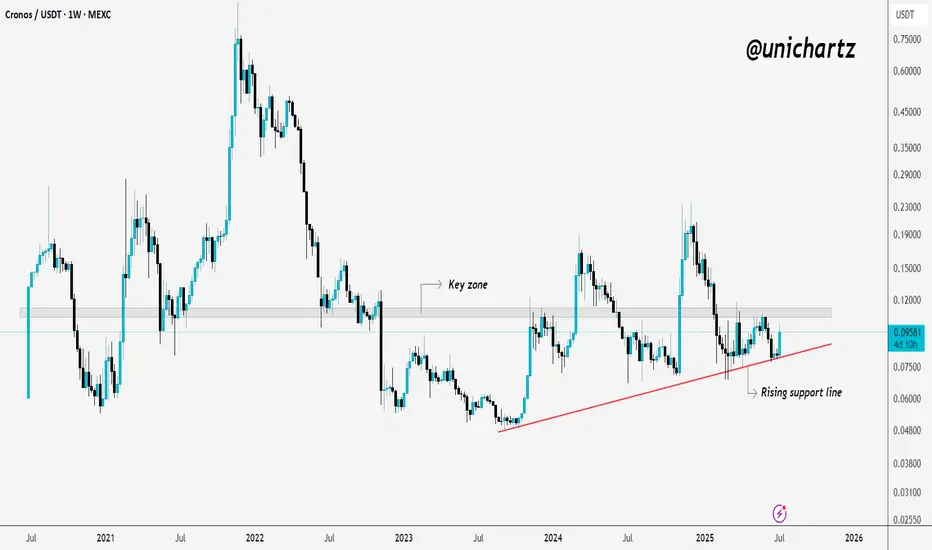
Cronos Holds Key Trendline – Will Resistance Crack Next?CRO is bouncing off its rising support line again.
The price has respected this trendline multiple times, showing steady accumulation. It’s also sitting just below a key resistance zone, if it breaks above that, we could see momentum kick in.
For now, the structure looks healthy as long as the support holds.
DYOR, NFA
Dogecoin Will Shock Investors With Its Next Move!Today I’m doing an in-depth analysis of Dogecoin and its market cycle in comparison to the early Bitcoin cycles. As you can see, the same human psychology and emotions are playing out in the Dogecoin market that we previously saw with Bitcoin. With mass adoption coming to the cryptocurrency markets, it’s very possible we’ll see a parabolic run on Dogecoin similar to what we saw with Bitcoin in 2016 and 2017. This could lead us to a new all-time high.
Because markets are fractal in nature, we see similar patterns appearing over and over again. If you can learn to understand and identify these cycles and patterns, you can position yourself for maximum profit. I see Dogecoin running very bullish through the rest of 2025, and it could also continue into 2026 as mass adoption drives increasing demand for cryptocurrencies. In fact, we could see the entire crypto market run all the way into 2029, as the stock market is also primed for a large parabolic move in its own cycle.
Stocks and crypto are heavily correlated since both are tied to the global economy. Contrary to popular belief, the world economy may actually be set up for a massive run in value—almost like a “Roaring 20s 2.0.” This means buying Dogecoin today could be like buying Bitcoin in early 2016—the opportunity for profit is enormous.
As always, stay profitable.
- Dalin Anderson

TradeCityPro | Bitcoin Daily Analysis #123👋 Welcome to TradeCity Pro!
Let’s dive into the analysis of Bitcoin and key crypto indices. As usual, in this analysis I’ll go over the trigger levels for the New York futures session.
⏳ 1-Hour Timeframe
On the 1-hour chart, as you can see, Bitcoin is currently below a resistance zone at 109135 and is approaching this level with strong bullish momentum.
⭐ If the price breaks and stabilizes above this level, we can open a long position. Both the volume and market momentum are confirming this setup well, but the main long trigger remains the breakout of 109135.
📈 If this bullish move turns out to be fake and the price starts heading downward, the first trigger we have for a short position is the 107853 level. A break below this level would give us an entry for a short.
👀 Overall, I think the market has been pretty straightforward lately, and we don’t need complex tools to analyze it. Just these support and resistance levels and simple triggers are sufficient.
👑 BTC.D Analysis
Moving on to Bitcoin Dominance, the 65.04 floor has finally broken, and dominance is now trending downward.
💫 The next support ahead is at 64.81, which the price is approaching. We’ll have to see how the market reacts to this level. For now, the trend of dominance in the 1-hour timeframe appears bearish.
📅 Total2 Analysis
Let’s look at Total2. With Bitcoin Dominance dropping and Bitcoin itself moving upward, Total2 has started a strong bullish leg and is heading toward the 1.18 level.
🔑 Many of the altcoins I’ve analyzed have triggered their entries, and as long as Total2 remains bullish, these moves can continue.
📅 USDT.D Analysis
Now to Tether Dominance. After breaking below the 4.76 level, it has now reached the 4.72 floor.
💥 A break below this floor could confirm continuation of the downtrend, but in my opinion, the price may pause here for some correction and consolidation.
❌ Disclaimer ❌
Trading futures is highly risky and dangerous. If you're not an expert, these triggers may not be suitable for you. You should first learn risk and capital management. You can also use the educational content from this channel.
Finally, these triggers reflect my personal opinions on price action, and the market may move completely against this analysis. So, do your own research before opening any position.

TradeCityPro | NEAR Faces Resistance in Lower Range Zone👋 Welcome to TradeCity Pro!
In this analysis, I’m going to review NEAR, one of the AI and Layer1 crypto projects, currently ranked 35 on CoinMarketCap with a market cap of 2.77 billion dollars.
📅 Daily Timeframe
On the daily chart, NEAR has formed a large ranging box between the 1.884 and 3.548 levels and is currently positioned in the lower half of that range.
✔️ After hitting the lower boundary, the price has formed a trigger around the 2.279 level and is now fluctuating below it.
✨ A breakout above this level could give us a long entry. However, the downside is that volume is decreasing and diverging from price. If this volume drop continues, the likelihood of the range breaking to the downside increases.
📊 If volume starts to rise, considering that the RSI is stabilizing above the 50 zone, the probability of a bullish scenario becomes much stronger.
💥 The main resistance above the current price is at 3.548, which I’ve marked as a zone. In my opinion, breaking this level would be the main trigger for a spot buy, and I personally plan to wait for this level to break before buying spot.
🔔 If the price gets rejected from the 2.279 level and bearish momentum enters the market, a break below 1.884 would be a strong short trigger and could signal the start of a new bearish leg and continuation of the previous downtrend.
📝 Final Thoughts
This analysis reflects our opinions and is not financial advice.
Share your thoughts in the comments, and don’t forget to share this analysis with your friends! ❤️

Bullish momentum to extend?Ethereum (ETH/USD) is reacting off the pivot which is a pullback support and could rise to the 78.6% Fibonacci resistance.
Pivot: 2,595.10
1st Support: 2,525.42
1st Resistance: 2,735.62
Risk Warning:
Trading Forex and CFDs carries a high level of risk to your capital and you should only trade with money you can afford to lose. Trading Forex and CFDs may not be suitable for all investors, so please ensure that you fully understand the risks involved and seek independent advice if necessary.
Disclaimer:
The above opinions given constitute general market commentary, and do not constitute the opinion or advice of IC Markets or any form of personal or investment advice.
Any opinions, news, research, analyses, prices, other information, or links to third-party sites contained on this website are provided on an "as-is" basis, are intended only to be informative, is not an advice nor a recommendation, nor research, or a record of our trading prices, or an offer of, or solicitation for a transaction in any financial instrument and thus should not be treated as such. The information provided does not involve any specific investment objectives, financial situation and needs of any specific person who may receive it. Please be aware, that past performance is not a reliable indicator of future performance and/or results. Past Performance or Forward-looking scenarios based upon the reasonable beliefs of the third-party provider are not a guarantee of future performance. Actual results may differ materially from those anticipated in forward-looking or past performance statements. IC Markets makes no representation or warranty and assumes no liability as to the accuracy or completeness of the information provided, nor any loss arising from any investment based on a recommendation, forecast or any information supplied by any third-party.

Is The Bottom In For XLM?Stellar Lumens (XLM) is exhibiting strong bullish momentum supported by favorable technical indicators, resilient support zones, and growing investor sentiment around utility-driven altcoins. The recent rebound off the $0.24 support level marks a significant higher low on the daily chart, reinforcing the continuation of the medium-term uptrend that began in Q2 2025. This rebound occurred with increasing trading volume, signaling renewed accumulation and a potential shift in market structure from consolidation to expansion.
I firmly believe the bottom is in, and the next leg up is upon us.
