ETH Price Weakens: Watching This Strong Demand Zone Closely$ETH/USDT Analysis (12H)
Ethereum has broken below a key support zone, confirming short-term weakness in price structure.
At the same time, the RSI is showing bearish divergence, signaling slowing momentum while the price was making higher highs — a classic early warning of a potential drop.
Now all eyes are on the strong demand zone below. If ETH finds support there, we could see a solid bounce or even a full trend reversal. But if this zone fails, deeper correction may follow.
DYOR, NFA
Thanks for the reading
Cryptomarket

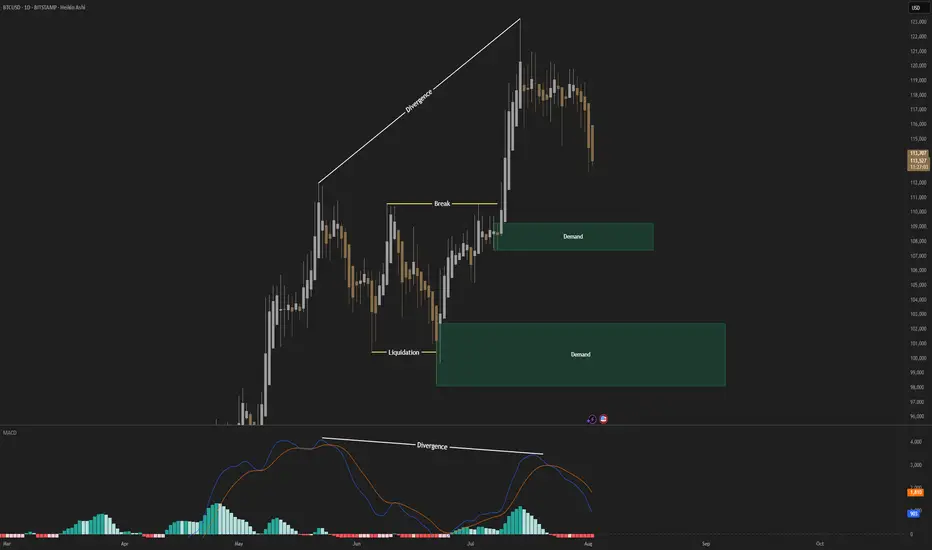
From Euphoria to Exhaustion – BTC's Next Move?BTC Idea – Bearish Divergence + Key Level Watch ⚠️
Summary / Bias:
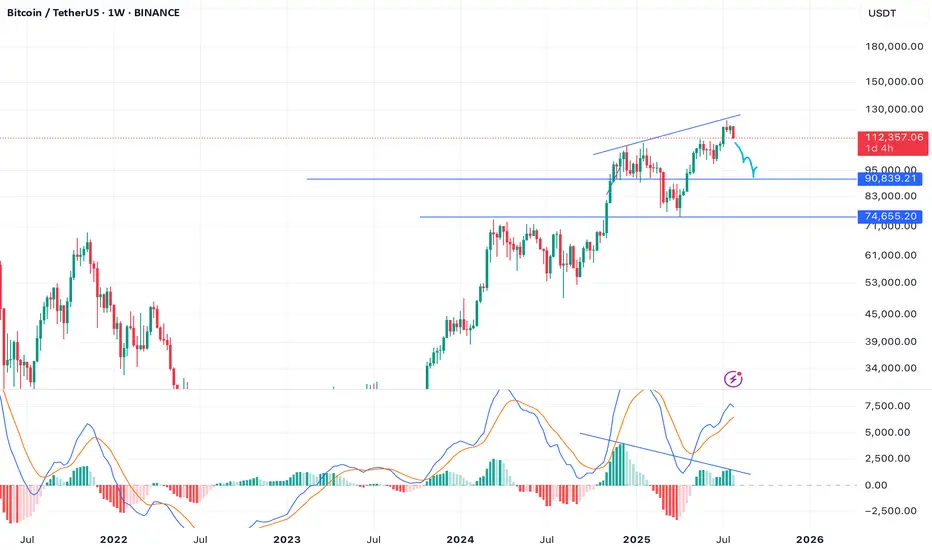
BTC has tapped 120K and is now showing early signs of weakness. A bearish divergence on the MACD Histogram (weekly) is flashing caution, while price has retraced back to the critical 112K zone. I'm leaning bearish short-term, expecting a move towards 100K, and possibly as low as 93K, if key confirmations unfold.
Technical Context:
Weekly MACD Histogram shows a clear bearish divergence, signaling potential exhaustion.
BTC rejected from 120K and has pulled back to 112K.
Price crossed below the Yearly Camarilla L#, but we need a weekly close below to confirm further downside.
112K remains the key pivot – failure to bounce strongly here could open the door for deeper retracement.
Scenarios to Watch:
🟥 Bearish Continuation (Primary Bias)
Breakdown and close below 112K
Downside targets:
TP1: 100K
TP2: 93K
🟨 Neutralizing Risk
Hold above 112K with strong bounce = neutral bias, reassess
Close back above 115K+ with strength = invalidate bearish lean
Caution & Patience:
Now is not the time for aggressive longs. Signs of exhaustion + major level retest call for defensive positioning and high-quality setups only. Let confirmation guide entries.
NFA. Risk management always.
Will update if structure shifts.
BITCOIN Bullish setupBTCUSD bullish setup
Entry - 113090
Stop Loss - 112717
Target - 114260
Risk Reward - 1:3.14

APT - HUGE POTENTIAL (130+% SPOT) You probably forgot about this altcoin but it is justified. Downtrend since 2023 and lower highs, lower lows but....
If we look more close and use tool fixed price volume we can see that price is above VAL (Value area low), we had break through but price returns..Also good reaction of FVG (Fair value gap).
Now, we can try buy this coin and have some stop lose. Price is in range 172 days and all people forget abut this coin. Analysis is right only if we close daily candlestick about 6$.
Stop lose can be below 4.4$ which is 6-7% of losing.
Second entry is monthly level at 3.3 and stop lose should be below the lowest low 3$.
For me is great opportunity because risk reward is excellent.
Ivan

Bullish potential detected for EthereumEntry conditions:
(i) higher share price for COINBASE:ETHUSD along with MACD crossover on the 4 hour chart at the low end of the scale with histogram crossover zero,
(ii) bounce off potential support zones of 15 min / 1 hour and 4 hour intraday timeframes, and
(iii) observation of market reaction at these support zones.
Stop loss for the trade would be below the ultimate support level from the open of 22nd January (i.e.: below $3327.56).

BTC | Bitcoin - Weekly Recap & Gameplan - 03/08/25📈 Market Context:
Traders are currently anticipating a potential 0.25% rate cut at the September FOMC meeting, which continues to support the broader bullish outlook.
While the market pulled back following weaker-than-expected Non-Farm Payroll data, overall sentiment remains optimistic.
Greed has cooled off into a more neutral stance. Historically, August often brings some consolidation or pullbacks — but the structural bias for Bitcoin remains bullish.
🧾 Weekly Recap:
• After printing new all-time highs, BTC began a healthy retracement.
• Price action closely mirrored the Nasdaq's (NQ) pullback during the week.
• We saw a small bounce mid-week, but no strong reversal confirmation yet.
📌 Technical Outlook & Game Plan:
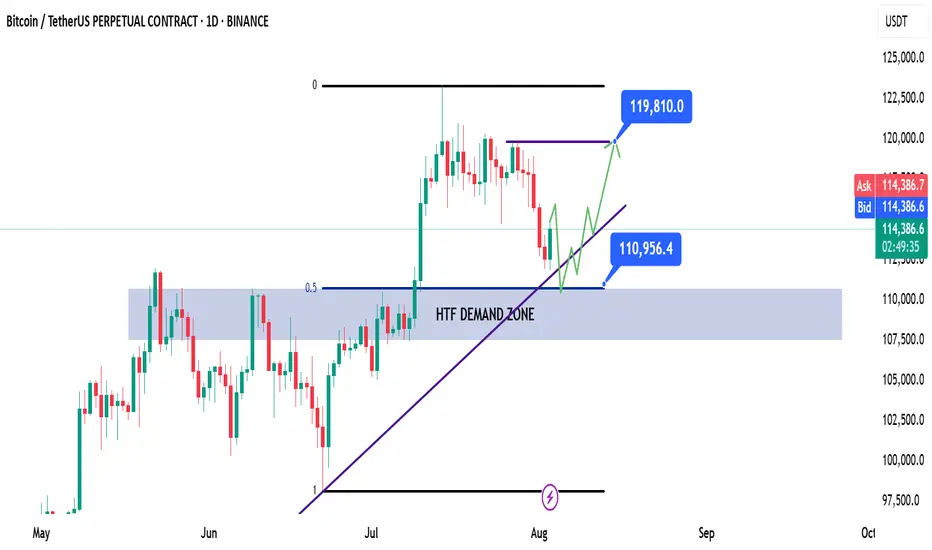
→ I’m watching for price to revisit the long-term bullish trendline.
→ A slight deviation into the HTF demand zone would be ideal for long entries.
→ Bonus confluence: This area also aligns with the 0.5 Fibonacci retracement (Equilibrium level), providing a key discount zone.
🎯 Setup Trigger:
I’ll be watching for a confirmed bullish break of structure (BOS) on the 1H–4H timeframes to signal a reversal.
On confirmation, I’ll look to enter a swing long position.
📋 Trade Management:
• Stoploss: Below the 1H–4H demand swing low
• Take Profit:
→ I’ll trail stops and lock in profits aggressively
→ Main target: $119,820
💬 Like, follow, and comment if this breakdown supports your trading! More setups and market insights coming soon — stay connected!
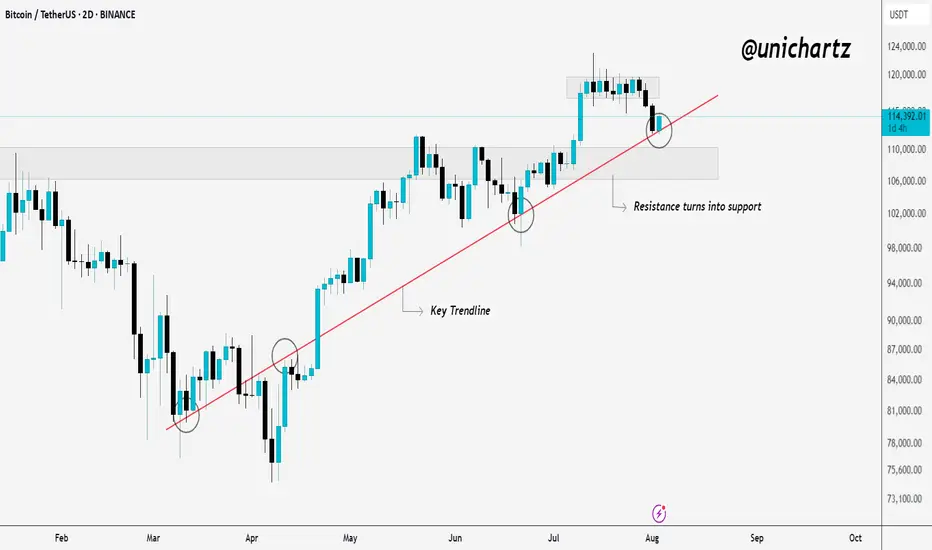
Smart Money Watching This Line — Are You?Bitcoin is holding strong above a key trendline that has acted as dynamic support since March. Every time price touched this line, buyers stepped in, and once again, it’s doing its job.
What was once resistance has now flipped into solid support. The recent pullback seems healthy, and the price is trying to bounce from the trendline area again.
As long as CRYPTOCAP:BTC respects this structure, the bullish momentum remains intact. If it holds, we could see another leg up from here.
DYOR, NFA
Thanks for reading!
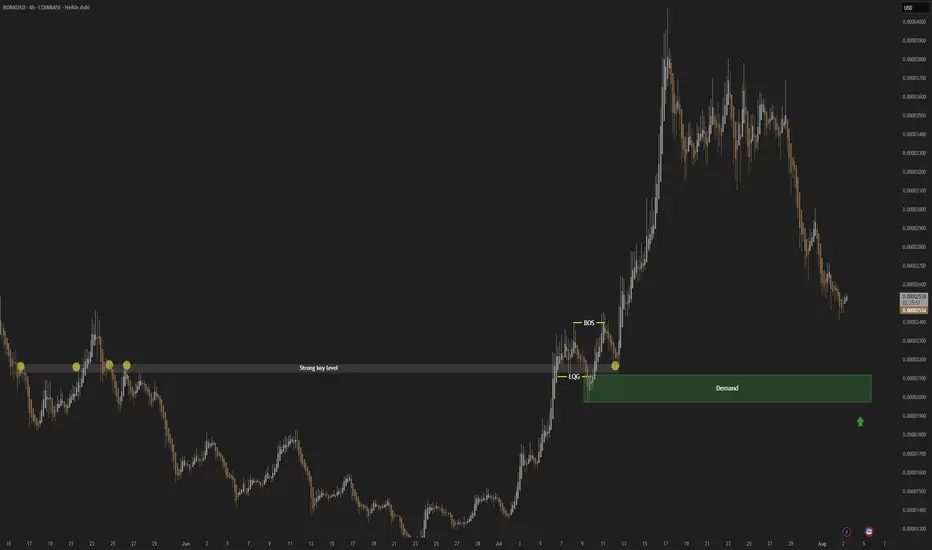
BONK; Heikin Ashi Trade Idea📈 Hey Traders!
Here’s a fresh outlook from my trading desk. If you’ve been following me for a while, you already know my approach:
🧩 I trade Supply & Demand zones using Heikin Ashi chart on the 4H timeframe.
🧠 I keep it mechanical and clean — no messy charts, no guessing games.
❌ No trendlines, no fixed sessions, no patterns, no indicator overload.
❌ No overanalyzing market structure or imbalances.
❌ No scalping, and no need to be glued to the screen.
✅ I trade exclusively with limit orders, so it’s more of a set-and-forget style.
✅ This means more freedom, less screen time, and a focus on quality setups.
✅ Just a simplified, structured plan and a calm mindset.
💬 Let’s Talk:
💡Do you trade supply & demand too ?
💡What’s your go-to timeframe ?
💡Ever tried Heikin Ashi ?
📩 Got questions about my strategy or setup? Drop them below — ask me anything, I’m here to share.
Let’s grow together and keep it simple. 👊
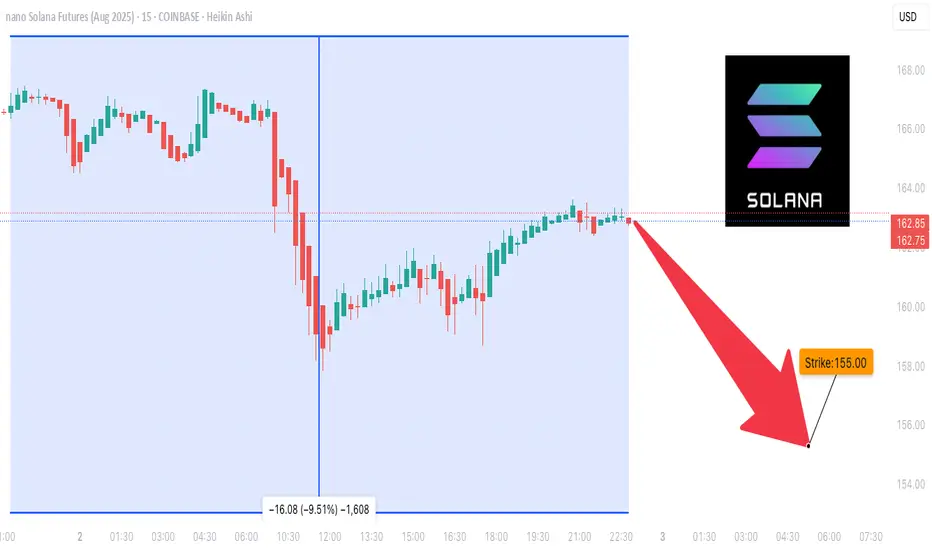
$SOL CRYPTO FUTURES SETUP – BEARISH BIAS (Aug 2, 2025)
🚨 **\ CRYPTOCAP:SOL CRYPTO FUTURES SETUP – BEARISH BIAS** (Aug 2, 2025) 🚨
Multi-Model AI Consensus | 🔻 Short Bias with Defined Risk
---
### 📉 **MARKET CONTEXT**
* **Current Price**: \$158.84
* 🔻 Trading below all key MAs:
* SMA20: \$178.72 (-11.1%)
* SMA50: \$161.29 (-1.5%)
* SMA200: \$162.06 (-2.0%)
* 🔻 Market Structure:
* **Death Cross** confirmed
* **Lower highs/lows** across all timeframes
* **-12.36%** drop over 5 days = capitulation signal
* 🔥 Liquidity Zone: **\$155.29** = key bounce OR breakdown level
* 📉 Volume declining = no buyer conviction
* 💣 Volatility High: BB Width = 26.2% of price (⚠️ Stop risk!)
---
### 🧠 **MULTI-TIMEFRAME MODEL SIGNALS**
**1-Hour**:
🟥 Bearish MACD, RSI \~39 (no reversal yet)
**4-Hour**:
🔻 Still trending down, no structure break
**Daily**:
⚠️ Death Cross active, must hold \$155.29
💡 Reclaim of \$162.06 = **bullish trigger**
---
### 🔬 **TECHNICAL INDICATOR SYNTHESIS**
* **RSI (14)**: 39.84 → nearing oversold
* **MACD**: Strong bearish momentum, no reversal
* **Bollinger Bands**: Price hugging lower band @ \$155.29
* **Volume**: Weak, no accumulation on dips
* **Funding Rate**: Neutral (0.0001%) = no squeeze setup
---
### 🔎 **TRADE SETUP (OA MODEL)**
🛑 **Direction**: SHORT
🎯 **Entry**: \$158.84
📉 **Target**: \$155.29
🛡️ **Stop**: \$161.29
💪 **Confidence**: 80%
🕰️ **Timing**: Market Open
🧠 Model Notes: Favoring momentum short w/ tight stop & fast exit
---
### ❌ **DS MODEL (No Trade)**
🟡 Recommends standing aside due to:
* Missing OI data
* Elevated volatility
* Lack of reversal OR divergence
---
### 🤖 **FINAL CONSENSUS**
🧠 **Models Agreed**: 2
📊 **Average Confidence**: 68%
📉 **Bias**: SHORT
📛 **Risk Level**: MODERATE
🚨 **Key Breakdown**: < \$155.29 = opens door to \$145
---
### ⚠️ **WATCH LEVELS**
* 📈 **Bull Trigger**: Close above \$162.06 (SMA200) + MACD cross
* 📉 **Bear Continuation**: Break < \$155.29 = fast drop to \$145
* 📌 **Optimal Long Setup**: RSI divergence + volume spike @ support
---
🧨 **RISK WARNING**: High volatility zone – futures carry liquidation risk >100%. Always use proper sizing and stops.
---
📢 #CryptoFutures #SOLUSDT #TradingView #AITradeSignal #BearishSetup #SolanaAnalysis #MultiModelConsensus
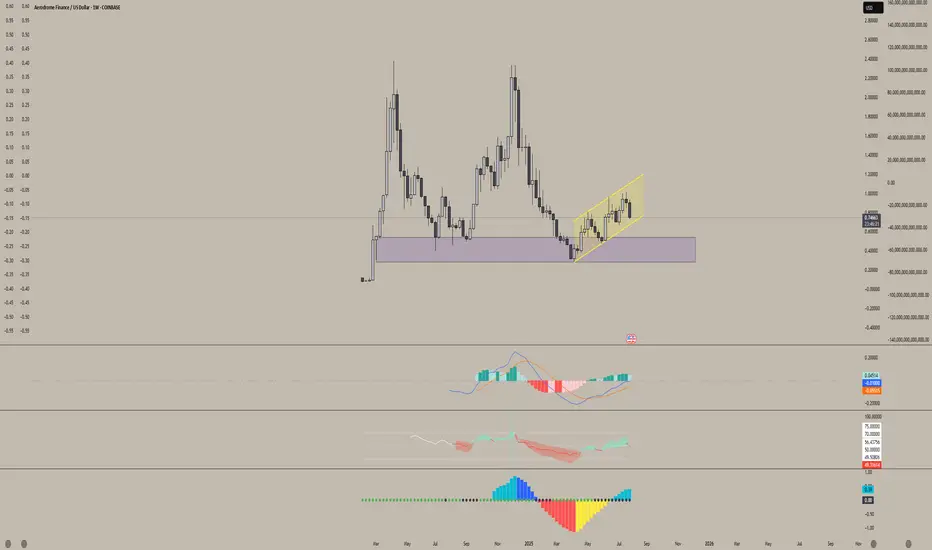
Aerodrome Finance (AERO)Aerodrome (AERO) is showing strong signs of accumulation.
We've been trading within this parallel channel for nearly three months, and it's repeatedly respected both the upper and lower bounds. As we approach the bottom of this range again, it looks like an ideal accumulation zone for long-term holders.
I'm very bullish on this project. Aerodrome is the leading DEX on Base — Coinbase’s Layer 2 network — and with no native Base token currently, AERO is in a prime position to claim that top spot. There's a vacant throne on Base, and AERO is well-positioned to sit on it.
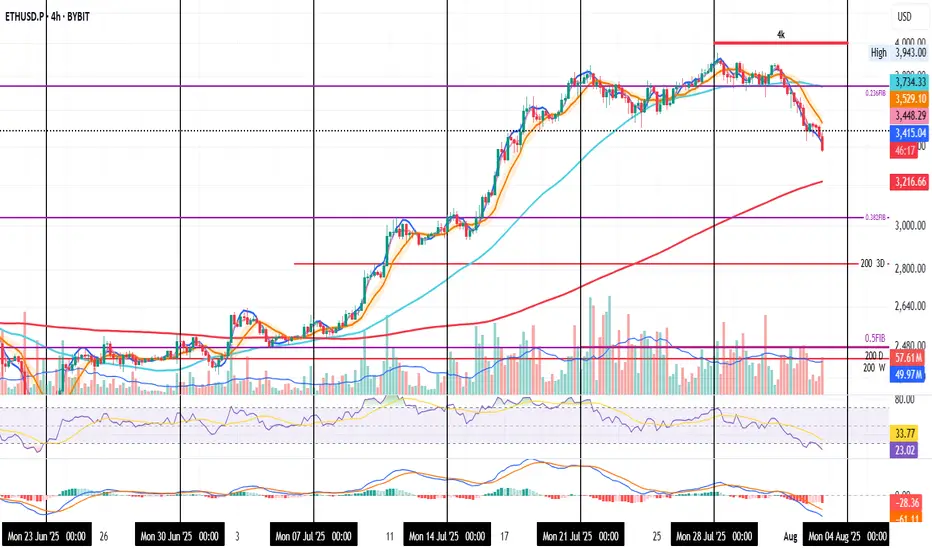
ETH 4H | Eyes on Support |ETH on the 4H
Bears are having their moment — and that’s fine.
Price is heading lower, with the 200MA around $3200 as the next support. If that breaks, the 0.382 Fib near $3000 is the last line before things get ugly.
My plan? Watch RSI for signs of bullish divergence.
Until then, hold tight.
Always take profits and manage risk.
Interaction is welcome.
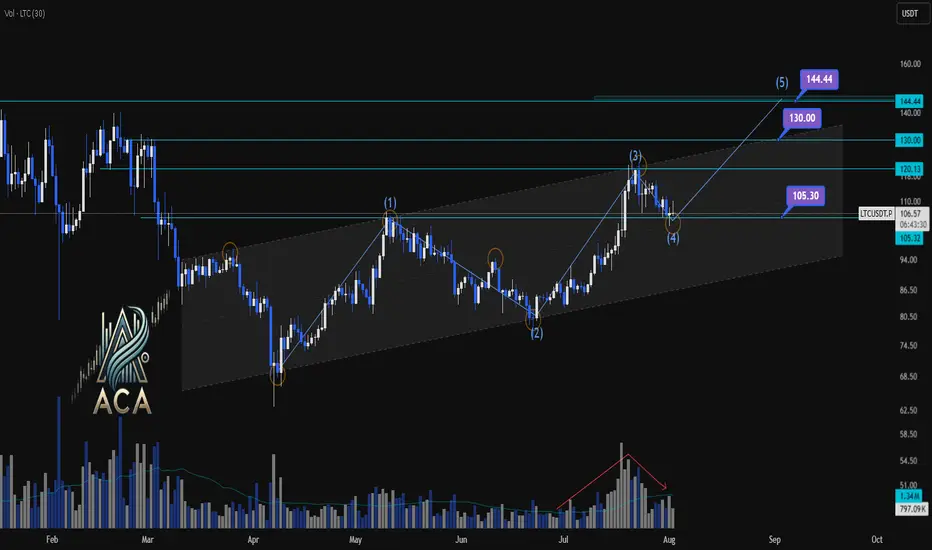
LTCUSDT | Daily Chart Analysis | Bullish Structure UnfoldingLTCUSDT | Daily Chart Analysis | Bullish Structure Unfolding
🔍 Let’s break down LTC/USDT’s technical setup, focusing on volume, Elliot Wave structure, and key target levels for this bullish scenario. If you're following this channel, be sure to react and let us know your thoughts on the roadmap!
⏳ Daily Overview
LTCUSDT is moving within a defined ascending channel, supported by increasing bullish momentum and clear Elliot Wave progression. The recent wave count points to a textbook impulse, setting up the next key move.
🔺 Long Setup:
The market has completed Waves (1) through (4), and we’re now looking at the development of Wave (5) to the upside.
- Wave (5) Target Zones:
- $130.00
- $144.44
These are the next resistance levels based on previous highs and channel dynamics.
- Key support to watch:
- $105.30 — this zone may act as a springboard for the next rally if tested.
📊 Key Highlights:
- Volume has shown a clear bullish divergence as price advances, signaling growing interest and strength heading into Wave (5).
- The bullish channel remains intact, and each dip has been met with higher lows, confirming the ongoing uptrend.
- Elliot Wave structure suggests further upside, with the $130.00 and $144.44 levels as potential targets.
🚨 Conclusion:
LTC bulls should keep an eye on price action as it approaches support at $105.30 — a bounce here could ignite the next leg higher toward our target zones. Reaction from the channel community will be crucial as Wave (5) unfolds. Show your support with a reaction below if you’re riding this wave!
BTC; Heikin Ashi Trade IdeaAfter a correction, price may have a good reaction from first demand area I have marked.
Lower demand zone is even more valid, since we see manipulation and then impulsive move to the oposite side.
Aimonica / UsdtGATEIO:AIMONICAUSDT
### **Aimonica Brands / TetherUS (1h) - Gate.io**
- **Price**: 0.001769 (+0.17%, +0.000003)
- **High/Low**: 0.001781 / 0.001752
- **Buy/Sell**: 0.001769 (BUY/SELL at same price)
- **Key Levels**:
- **Resistance**: 0.001972, 0.002000
- **Support**: 0.001700 (D), 0.001608
- **Market Sentiment**: Neutral/minor bullish (no strong momentum).
**Summary**: Slight uptick, low volatility. Watch for breakout above 0.001972 or dip below 0.001700.
---
### **⚠️ Disclaimer**
This analysis is for informational purposes only and does not constitute financial advice. Cryptocurrency trading involves high risk, and past performance is not indicative of future results. Always conduct your own research (DYOR) and consult a financial advisor before making investment decisions.

Sui chance for +60% on this zoneSui continue to grap liquidation but on the monthly and weekly timeframe we are still bullish.
I just saw good zone for trade. At 3.15 we have daily EMA + fibonacci 0.64 + Daily FVG.
I will suggest to add some leverage because invalidation is close to 2.9.
In this mid term bull market of altcoins we can see that SUI has good performance.
Ivan

ETHUSD Break- Test- GO!!! Nothing Changed! 3rd EditionI have been warning about this for some time. Please visit my previous two posts for more info and updates.
Magic!
Click boost, follow, and subscribe for more. Let's get to 5,000 followers ))

BNB/USDT 4H Chart: Rising Channel with Fractal Vibes!Hey traders! Binance Coin is showing some promising action that’s got me on the edge of my seat!
We’ve got a clear rising channel in play, with BNBUSDT moving beautifully in sync with a fractal line pattern shown above the chart — mirroring past price behavior like a roadmap! BNBUSDT is currently trading at $650 , I think price will continue bouncing between the channel’s support at $620-$600 and move upwards to the key resistance target at $700-$720 . A breakout above this resistance could send BNB soaring to new highs, potentially targeting $800 or beyond!
However, if BNB fails to break through, we might see a pullback to the channel support at $620-$600 .
Key Levels to Watch:
Resistance: $700-$720
Support: $620-$600
Breakout Target: $800+
Breakdown Risk: $600
Is BNB about to blast through $720, or will it retreat below support? Let’s hear your thoughts below!

We might be changing the trend in the coming months!I found this indicator extremely accurate for the past tops. We are focusing on the histogram today and looking once that green candles starts growing momentum taking BTC down the hill. If this idea proves right we might be bottoming around 400 days perhaps August 2026 ~45k

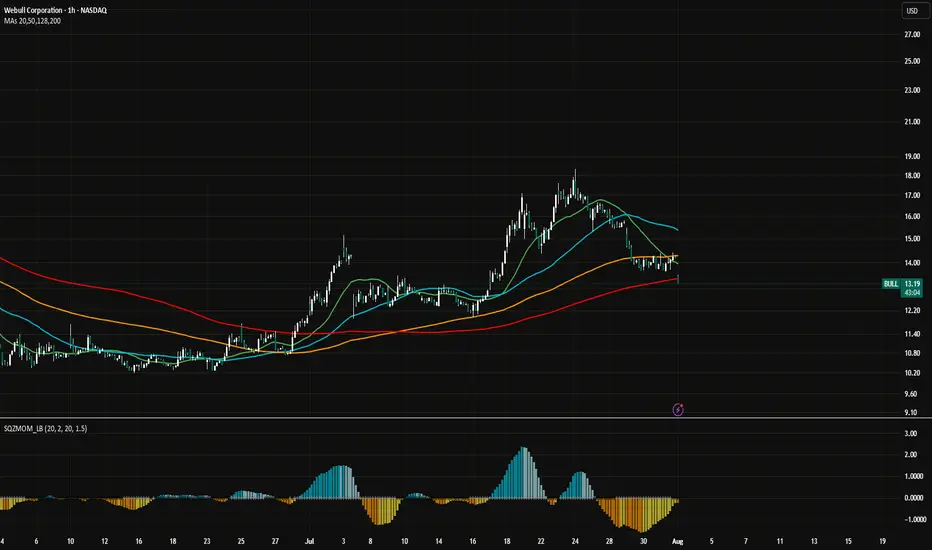
WeBull Look Ahead $BULLRecently took a look at WeBull and I believe there is a huge arbitrage opportunity from NASDAQ:HOOD to $Bull.
Although RobinHood is building something much much bigger than anticipated, including banking, I think WeBull can take some of $HOODS market share depending on their direction.
-Webull's total revenues grew 32% year-over-year to $117 million in the first quarter of 2025, according to SEC filings
-Customer assets increased 45% year-over-year, reaching $12.6 billion at the end of Q1 2025, according to Webull
-The number of registered users grew by 17% year-over-year, according to Webull
-Partnership with prediction market Kalshi will grow profits for WeBull exponentially.
www.nasdaq.com
This Might be the best price to get in today depending on WeBull's Success.
TradeCityPro | Bitcoin Daily Analysis #141👋 Welcome to TradeCity Pro!
Let’s dive into Bitcoin analysis. Yesterday, the exact bearish scenario I told you about happened. Let’s see what opportunities the market is offering us today.
⏳ 4-Hour Timeframe
Yesterday, I mentioned that the price had tested the 116829 zone too many times and that this area had become very weak. I also said that if the price made a lower high than 120041, deeper corrections would be likely.
✔️ Another perspective I have on the market is that sometimes certain support and resistance levels simply aren’t strong enough to continue the trend.
🔑 For example, in this case — despite Bitcoin being in an uptrend across all cycles — the 116829 support couldn’t hold, and the price broke it to reach a stronger support zone, one that might be capable of continuing the trend.
📊 Right now, this is what might be happening again. Support levels like 0.5, 0.618, and 0.786 Fibonacci retracement zones could be where the next bullish leg begins.
✅ At the moment, price has reached the 0.5 Fibonacci level, and the previous strong bearish momentum has slightly weakened. If you look at the volume, momentum is still in favor of sellers, but based on the long lower wicks on the candles, we can say the bearish trend is showing signs of weakness.
💥 On the other hand, RSI is approaching 30, and in an uptrend, when RSI nears the Oversold zone, it can often be a good entry point for a long. However, we’re not acting on this yet — we’ll wait for more confirmations before opening any positions.
⭐ For now, there’s no trigger for a long position on this timeframe. A break below 115000 could act as a short trigger, but given the trend Bitcoin is in, I’m not opening any short positions at the moment.
⏳ 1-Hour Timeframe
The price has dropped down to 114560, and I believe today we might enter a corrective phase. However, if the price stabilizes below 114560, the correction could continue. The next targets would be the Fibonacci levels from the 4-hour timeframe.
🔽 I won’t open a short position with the break of 114560, and I suggest you don’t take that short either.
📈 If this move turns out to be a fakeout, the first trigger we have now is at 118736, which is quite far from the current price. For this trigger to activate, we’d need to see a V-pattern form.
🔍 There are no other triggers right now. But if more range structure forms, we might consider opening a risky long on the breakout of the range top.
❌ Disclaimer ❌
Trading futures is highly risky and dangerous. If you're not an expert, these triggers may not be suitable for you. You should first learn risk and capital management. You can also use the educational content from this channel.
Finally, these triggers reflect my personal opinions on price action, and the market may move completely against this analysis. So, do your own research before opening any position.

BTC is likely to resist falling below $112000BTC is likely to resist falling below $112000
If the confluence between the yellow trendline and the top green horizontal support level dont hold strong, we are likely to see BTC retrace to $100K
Please trade with care.
My thoughts are shown on the chart technically
I hope to connect with you.
Please like, share, comment and follow me.

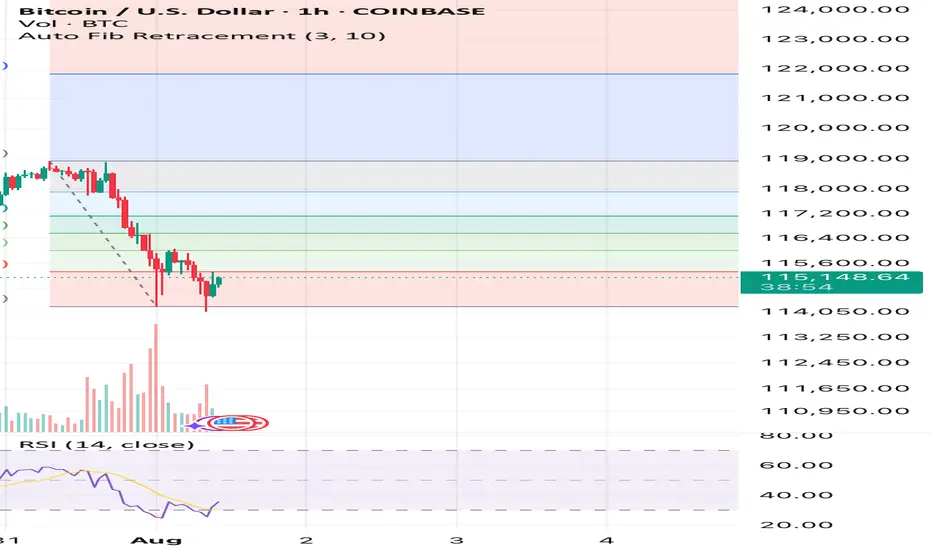
Bitcoin willIt hold if we stay above $115k ?? Fixing up last post I’ve deleted now as image was not good. Anyway simple RSI and Auto Fib Retrace with only general CRYPTOCAP:BTC market understanding backing this. This isn’t finacial advice at all. It’s pure speculation this post and anything related to it. I’m
Not a finacial advisor and I will not be held accountable for anyone’s actions that I didn’t do.

Bitcoin has an upside to it if we hold above $14,900See what you think it’s simple Auto Fib Retracement and RSI. That’s all I’m using here and also past times and other data outside of this image but inside the CRYPTOCAP:BTC market.
What you think? Up to $118k again before down or sideways? Or will this be the end of the large bull flag formation? We’ll soon find out!