BITCOIN - SHORT OPPORTUNITY AND LACK OF MOMENTUMBINANCE:BTCUSDT has been lacking momentum in the last few days. It looks to me that "Good News" is almost "No News" in regards to the Iran war or any crypto legislation. Summer is looking a lot like sideways movement, and due to the previous explosion in momentum and volume, I think the lack of it will bring the price down in the following days or weeks.
Cryptomarket

BTC.D ANALYSIS BTC.D – Daily Chart Analysis 🧠
Bitcoin dominance is forming a rising wedge pattern – a typically bearish structure.
We’re now at the upper resistance; a rejection here could trigger a strong move down, opening the path toward 56–57% levels.
If confirmed, altcoins might get temporary relief.
Watch for a break of the lower trendline for confirmation.
Not financial advice – DYOR

BTC 120K READY ???BTC 4H Chart Update 📉📈
Bitcoin is still trading inside a descending channel, but bulls are now testing the upper trendline for a potential breakout.
Price is consolidating just below $107K, showing strength after the recent bounce from the bottom of the channel.
🔹 Structure: Descending Channel
🔹 Current Resistance: $107K–$110K zone
🔹 Break & close above = bullish breakout confirmation
🔹 If breakout and close above 110k than this target possible
🔹 Target after breakout: $112K-120K+
⚠️ Rejection = pullback likely toward $103K–$104K support
📊 Breakout or breakdown — decision time is near!
#BTC #Bitcoin #Crypto #TechnicalAnalysis #BreakoutSetup

ETH 4H – Testing the 200W MA
ETH is trying to reclaim the 200-week MA on the 4H chart.
The last 4H candle closed right on top of it.
The first 4H bar from June 26 closed above the 0.5 Fib, but that level was eventually lost.
If the 200W MA holds as support, price may attempt to flip the 0.5 Fib into support again.
Always take profits and manage risk.
Interaction is welcome.

Bitcoin Drive up to 115k So currently BTC on the weekly and monthly is showing us a drive up to 115,700 then possibly seeing a correction major or minor then a drive up to 122k is what I am currently seeing at the moment
Kris Mindbloome Exchange
Trade Smarter Live Better

Solana Heading to 112 or 330+Hey fam
So for Solana if we hold under 148 then a drive down to 112 makes sense. However if we drive above 148 then we can possibly hit weekly targets of 330
Make sure you adjust accordingly in a smaller time frame to ensure your in the right move
Happy tradings folks
Kris Mindbloome Exchange
Trade Smarter Live Better
Under 148 we go to 112 if we break 148 we can see a drive up to 338

Bearish reversal?The Bitcoin (BTC/USD) is reacting off the pivot and could drop to the 1st support.
Pivot: 108,836.36
1st Support: 103,622.00
1st Resistance: 112,088.89
Risk Warning:
Trading Forex and CFDs carries a high level of risk to your capital and you should only trade with money you can afford to lose. Trading Forex and CFDs may not be suitable for all investors, so please ensure that you fully understand the risks involved and seek independent advice if necessary.
Disclaimer:
The above opinions given constitute general market commentary, and do not constitute the opinion or advice of IC Markets or any form of personal or investment advice.
Any opinions, news, research, analyses, prices, other information, or links to third-party sites contained on this website are provided on an "as-is" basis, are intended only to be informative, is not an advice nor a recommendation, nor research, or a record of our trading prices, or an offer of, or solicitation for a transaction in any financial instrument and thus should not be treated as such. The information provided does not involve any specific investment objectives, financial situation and needs of any specific person who may receive it. Please be aware, that past performance is not a reliable indicator of future performance and/or results. Past Performance or Forward-looking scenarios based upon the reasonable beliefs of the third-party provider are not a guarantee of future performance. Actual results may differ materially from those anticipated in forward-looking or past performance statements. IC Markets makes no representation or warranty and assumes no liability as to the accuracy or completeness of the information provided, nor any loss arising from any investment based on a recommendation, forecast or any information supplied by any third-party.

What's Next For Bitcoin?Bitcoin Eyes A New ATH In the Upcoming Days...
But Do Not Be Surprised If BTC Drops Back To 90K.
Studying Previous Cycles, Showed Massive Drop Before the Bull Run.
#bitcoin #crypto #btc #trading #trader #portfolio #technicalanalysis

KAS IS TESTING RED RESISTANCE ZONE🚨 KAS Testing Red Resistance – Waiting for Breakout 📈
KAS is currently testing the red resistance zone.
If breakout is confirmed, the first target could be the green line level! 📊

BNBUSDTPersonally, I see BNB struggling to break above that key resistance zone near 648–649. The rejection from that level, especially with decreasing momentum, makes me lean bearish in the short term. We’ve seen this zone hold back price before, and unless there's a strong breakout with volume, I think there's a higher chance we see a pullback toward the 616–618 area. I’m just watching price action closely and waiting for a clean confirmation—no need to rush a position when the structure’s already signaling hesitation.

SatochiTrader Expecting a huge BTC CRASH AFTER This..BTC Market Update by SatochiTrader
EVERY CRASH DID START WITH A FALSE INCREASE TREND.
Depending on the market sentiment and price action, BTC is currently showing strength with a positive trend. However, based on deeper data and insights held by myself and a small group of early-cycle followers, this current movement may be a deceptive signal — potentially foreshadowing a major crash.
This is not trading advice. Those who are confident in the long position should continue, and those on the other side should stay prepared as well.
We have previously explained that the current cycle appears to have ended. Since 2013, BTC has consistently respected its macro cycle targets. The end of such a cycle typically leads to significant corrections.
A cycle ending implies not just a retracement, but the potential for a major crash. Hedge funds and real BTC whales understand the underlying indicators and risks at play. Our expectation remains clear: BTC may soon fall below the 100K level, with $85K identified as a critical support and target zone.
Stay sharp. Stay informed. The market may look bullish — until it isn't.
The best way to follow BTC is not the news.. but the cycle overview.
This update is an education update, which means the high expectations of the upcoming correction for BTC.
Compared to last quarter, miners are now less severely underpaid, though profitability remains low

ADA Long Swing Setup –Support Holding, Watching for Retest EntryADA has held the $0.50 support level over the past few weeks. If price retraces into the $0.53–$0.55 zone, we’ll be looking to enter a long spot trade from support for potential upside continuation.
📌 Trade Setup:
• Entry Zone: $0.53 – $0.55
• Take Profit Targets:
o 🥇 $0.64 – $0.66
o 🥈 $0.71 – $0.75
o 🥉 $0.80 – $0.84
• Stop Loss: Daily close below $0.51

INJ Long Swing Setup – Breakout Retest Opportunity at Key LevelIf the crypto market pushes higher and INJ flips current resistance into support, we’ll be looking to enter on a retest of the $11.60 zone. This level could act as a launchpad for the next leg up.
📌 Trade Setup:
• Entry Zone: $11.60 – $11.60 (Breakout Retest)
• Take Profit Targets:
o 🥇 $14.20 – $16.25
o 🥈 $19.80 – $23.00
• Stop Loss: Daily close below $10.70

Shentu Back To Baseline, 200% Minimum, Fast!We have a very good chart setup here but I will focus on one target only and the short-term, "back to baseline."
Shentu is about to make a strong jump. One of those that can leave us with our mouths wide open. Similar to 30-April but without the rejection and lower low.
This time, the jump will result in long-term growth. Of course, there can be some daily growth first before this jump. The 200% profits potential target is the minimum, there is huge potential for growth, CTKuSDT, long-term. As well as mid-term. And I am telling you now about the short-term, so everything is pointing up.
The main low happened in April. The recent lower low is a form of consolidation with a bearish bent. This type of consolidation can produce higher lows or lower low but the end result doesn't change, which is a strong rise with a higher high compared to the last high.
This is one is good and already on the move. Four days green, but this is only the start.
Thank you for reading and good profits. It will be great.
Namaste.

MOVE/USDT – Long-Term Breakout WatchTimeframe: 4H (Long-Term Setup)
MOVE is testing a long-term descending trendline. After months of consistently lower highs, we may be on the verge of a bullish breakout.
The previous breakout attempt in April was a fakeout, but the current consolidation near resistance looks healthier and more sustainable this time.
Key Levels to Watch:
Resistance Levels (Upside Targets):
$0.1446 (Current Zone / Breakout Level)
$0.2265 – Mid-term target
$0.3397 – Key structural resistance
$0.5449 – Long-term target if trend reverses fully
Support Levels:
$0.1312 – Immediate support
$0.1173 – Major long-term base support (strongest defense)
Suggested Stop-Loss:
Below $0.117 (invalidates breakout structure)
Outlook:
If MOVE breaks and holds above the descending trendline, a major trend reversal could follow.
The setup suggests accumulation at the bottom, and volume confirmation will be key.
Patience is crucial — this is a long-term opportunity, not a quick trade. Small caps often move explosively once supply zones are cleared.
DYOR | Not Financial Advice

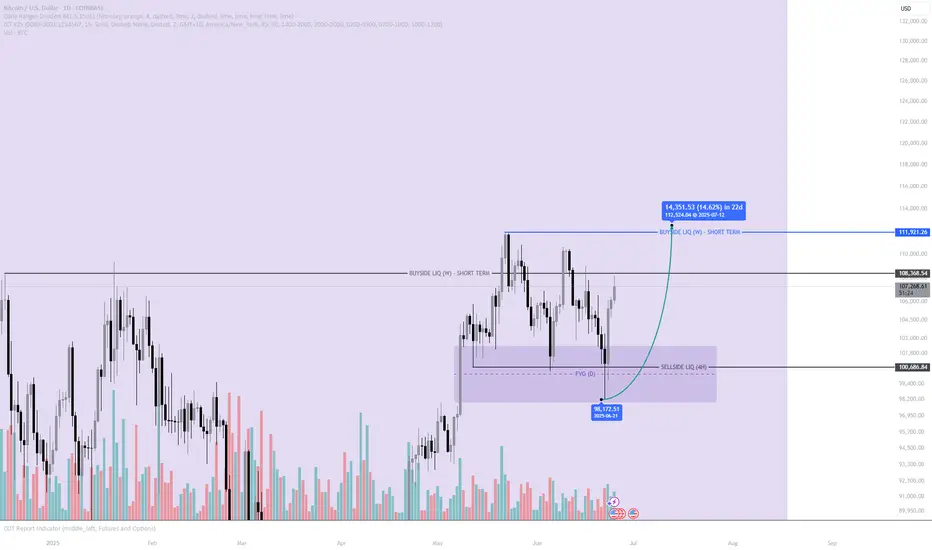
Bitcoin Respecting FVG Again – Is This the Launchpad to 112K+ ?Bitcoin has once again shown strong respect for a key Fair Value Gap (FVG) on the daily timeframe, tapping into a previously identified imbalance around the $98,000 region. This area had earlier acted as a base for bullish structure, and price's return to it suggests re-accumulation by smart money rather than a breakdown. The reaction was swift, rejecting off the FVG and forming a strong bullish daily candle, implying intent for higher prices.
This move into the FVG also swept sell-side liquidity resting below a clear 4-hour equal low. This kind of liquidity grab is a textbook ICT-style move, used to trap retail shorts before a reversal. With that liquidity cleared and institutional interest likely engaged, the structure has shifted bullishly, creating a higher low and showing momentum building to the upside.
The next major upside objective lies at $111,921, which marks short-term weekly buyside liquidity. This area represents a key magnet for price — where many stop-losses and buy-side orders are likely stacked — making it a logical destination for a move upward. The projected move offers a potential 14.6% upside over the next few weeks.
If price can hold above the $106K-$108K zone, the probability increases that we’re witnessing the beginning of a broader impulsive leg toward the $112K region. However, failure to maintain bullish structure here could mean deeper accumulation is still unfolding. As always, this setup should be approached with discipline, and further confirmation should be sought using your own risk model and strategy.
Very quick and simple BITCOIN DAILY UPDATEPA is approaching TOP OF RANGE again
It it get rejected, it is another LOWER HIGH that may lead to another LOWER LOW
If we break through, we may watch a higher high but we need to see if we get a Higher Low afterwards to confirm change of Trend
The Falling channel has a number of boundaries.
PA has the ability to move higher.
This appears to be a Bullish move for now.
So we need to wait till month end.
Again, I am hoping for a small RED candle for the month
A small Green candle could lead to many options that would be Fragile and unfounded

SOL/USDT – Bearish Harmonic Completion Near 144–145The 2H chart shows an extended X‑A‑B‑C‑D harmonic structure (an extended Bat/ABCD). Leg XA was the initial down-leg (from the recent swing high down to A), AB was a corrective pullback, and BC retraces sharply into the 88.6–100% zone of XA (around $144–$145). In a classic Bat/ABCD, the CD leg often completes near an 88.6% retracement of XA, so this C zone is a potential reversal point (PRZ). Importantly, C also sits on the chart’s long-term red descending trendline – a confluence of fib and trendline. A break below this level would “validate the bearish harmonic pattern,” with the downtrend line amplifying selling pressure. The projected D-point is ~$122.63 (late June/early July), which coincides with the lower green channel support on the chart.
Harmonic pattern (2H SOL/USDT): XA and AB moves set up a deep BC up into the 88.6–100% fib zone (around $144–145) at C. This confluence of fib levels and the macro descending trendline makes C a strong Potential Reversal Zone (PRZ). The CD leg targets ~122.63, aligning with lower channel support (green). Across timeframes the momentum is waning into point C. RSI is rolling over – price made a lower high while RSI failed to confirm (a classic bearish divergence). Meanwhile, the PVT (Price Volume Trend) line has flattened even as price crept higher, indicating the rally is not supported by volume.
Volume patterns also signal distribution: rallies into C have occurred on declining volume, a textbook sign that buying interest is drying up. Wyckoff distribution theory notes that as a top forms, “rallies during this stage often show lower volume” and ensuing drops on higher volume. In short, weakening RSI, a flat PVT, and thinning volume all confirm the selling pressure around $144–$145, consistent with a bearish reversal at C. Momentum and volume (15m SOL/USDT): RSI has peaked lower while price nears $145, and PVT has flattened (highlighted). Rallies into C come on lower volume, matching Wyckoff distribution cues. These divergences suggest the upward move into C is exhausted.
Trade Plan & Risk Management
Entry: Short initiated at $145.00 (near the PRZ around C).
Stop Loss: $146.20 (just above the red trendline and invalidation of point C).
Take Profit Targets:
TP1 : $129.00 (minor fib support, ~61.8% retrace of the last swing).
TP2: $122.63 (harmonic D projection and channel support).
TP3: $120.00 (extension to lower channel boundary).
Confirmation: Watch for a break of the short-term support at ~$139.50 for added conviction before letting profits run.
Note: A short position was opened at $145. This outline is for informational purposes – it is not financial advice. Trade with proper risk management.
Each target corresponds to technical levels (fib retracements and channel support). The first target aligns with a ~61.8% retracement (common fib TP level), and the final targets sit on the longer-term channel floor. If price breaks under $139.50, it would further confirm the bearish thesis.

New buying opportunity may emerge for BTCBTC tends to fluctuate in the short term, but as BTC builds a double bottom structure to support the rebound pattern, it is currently inclined to fluctuate upward. Although the upward momentum has weakened after reaching around 106,000, as long as it stays above the 105,300-104,800 area, BTC is still expected to continue to rise and may challenge the 108,000-109,000 area again.
And with the collapse of the gold and oil markets, funds in the two markets may flow into BTC, which is more attractive and the mainstream market of cryptocurrencies. So as BTC retreats in the short term, BTC may have new short-term buying opportunities. Then if BTC retreats to the 105,500-104,500 area and does not fall below this area, we can consider going long on BTC at the right time.

SYRUP Bounces from Confluence Zone – Bullish Continuation?SYRUP bounced cleanly from the confluence zone — where trendline and support aligned. Bulls stepped in fast.
As long as it holds above trendline, upside continuation is likely.
Wait for retest or structure before chasing.
DYOR, NFA

UNEXPECTED RISK CRASH FREE FALL AFTER TREND DATA FOR TH NEXT 48HDepending on our study, BTC has a high chance of a new crash below 100K.
The next 48 hours are important for the trend change of BTC, which can allow the trend to free-fall below 100K
BTC is at a top, and it did recovery always recovered on the M volume top., We are now again on the same trend.
BTC can return below 100K as this update shows, with the possibility of targeting the main target 85K - This is the trend zone for new interest.
The reason for this crash is that BTC has not confirmed the cycle, which means the end of the cycle. There is always possibility that the market can act green, but we expect it can show an unexpected breakdown.

BTC Consolidates Above Pivot – Bullish Momentum Toward 113,770?BITCOIN OVERVIEW
Crypto Breakout or Crash? Powell's July Message Becomes the Deciding Factor
Federal Reserve Chair Jerome Powell’s testimony on Capitol Hill has intensified the uncertainty surrounding risk assets.
He emphasized that while inflation has eased significantly since mid-2022, it remains “somewhat elevated”, and the Fed is in no rush to shift its policy stance.
This leaves markets with a binary outcome: crypto breakout or macro-driven pullback—and July may be the turning point.
TECHNICAL OUTLOOK – BTC/USD
Bitcoin remains in bullish momentum, having stabilized above the pivot level at 107,750.
The price is currently pushing toward the key resistance zone between 108,950 and 110,360.
A breakout above this zone would likely lead to continuation toward the next ATH target at 113,770.
However, consolidation is expected between 108,950 and 106,320 until a breakout occurs.
Key Levels
Pivot Line: 107,750
Resistance: 108,950 → 110,360 → 113,770
Support: 106,320 → 104,150

Coinbase Breaking Higher, Bitcoin To Follow Soon? Coinbase has been trading very nicely to the upside over the last two weeks, and it's now even breaking the previous highs from December in pre-market. This suggests we’re in a fifth wave, but even this leg should be structured by five waves, so there’s room for more upside—even above the 400 level. If we respect the past cycles and compare it with Bitcoin, then clearly Bitcoin is lagging here. Still, while Coinbase is in this bull run, sooner or later, Bitcoin should also join the strength.
