Bitcoin Bounce Alert: Holding the $100K Fortress! 📉 Market Context & Technical Levels
Key support at ~$100K: As the chart shows and multiple analysts confirm, this level continues to act as a strong defence zone. Cointelegraph noted bulls have been “defending the $100K key support level strongly,” triggering bounces during dips
Descending channel overhead: Bitcoin has retraced into a downward channel. A clean breakout above ~107K–109K (past recent peaks) is needed to signal a bullish shift .
Liquidity target at ~106K: Plenty of orders await in that region—flipping it to support may pave the way for another push higher .
📊 Indicators & Momentum
RSI dip near 25 during the latest drop indicates oversold conditions—often a precursor to rebounds
.
Volume surge on rebounds suggests absorbing sell pressure and strong accumulation interest at lower levels.
🚩 Key Price Zones to Watch
Level Significance
$100K Crucial support; losing it risks a slide toward $95K–97K or even $92K
.
$105K–106K Liquidity zone; flipping here as support could confirm upward momentum .
$107K–109K Resistance from channel tops and prior highs; a successful break is key to next leg up .
$112K–$112K+ If breakout occurs, upside targets extend toward prior ATH near $112K and beyond .
🎯 Chart Analysis Summary
Your chart shows three distinct bounces from the $100K–100.7K supply zone (highlighted in blue) and the latest one includes a sharp wick and rebound. This aligns with broader market dynamics emphasizing support at $100K and building liquidity at $106K. The arrow projection signals a probable retest of ~106K, with room to challenge ~107–109K after consolidation.
🧭 Trade Outlook
Bullish scenario: Hold above $100K → reclaim $106K → trendline breakout → potential rally to $112K+.
Bearish risk: Fails support at $100K → breakdown toward $95K–92K region.
📌 Bottom Line
Support $100K is alive and well. Bounces have been crisp and volume-backed.
Next test lies at $105–106K. That’s the battleground—flip it, and we may see bitcoin reclaim recent highs.
Watch the channel overhead (~107K–109K). A breakout could open the door to fresh records.
✅ Conclusion: BTC is defending its psychological base firmly. If this zone holds once more, the path to $106K and beyond is in focus. Breaking above demands conviction, but it’s the pivot to watch.
Cryptomarket

ETH BUY BIASEthereum (ETH/USD) – Weekly Chart Summary
• Current Price: ~$2,250
• Trend: Bearish structure with lower highs and lower lows
• Key Zones:
• Support (Demand): $1,800–$2,000 and $1,400–$1,700
• Resistance: $2,800–$3,600 (liquidity zone)
• 200-Week MA: Acting as dynamic support near current levels
• Outlook: Potential drop into demand zones, followed by a strong bullish reversal targeting the $3,200–$3,600 region
• Risk: Failure to hold $1,800 could trigger deeper losses
📈 Bias: Wait for price to reach key demand zones before entering long positions.

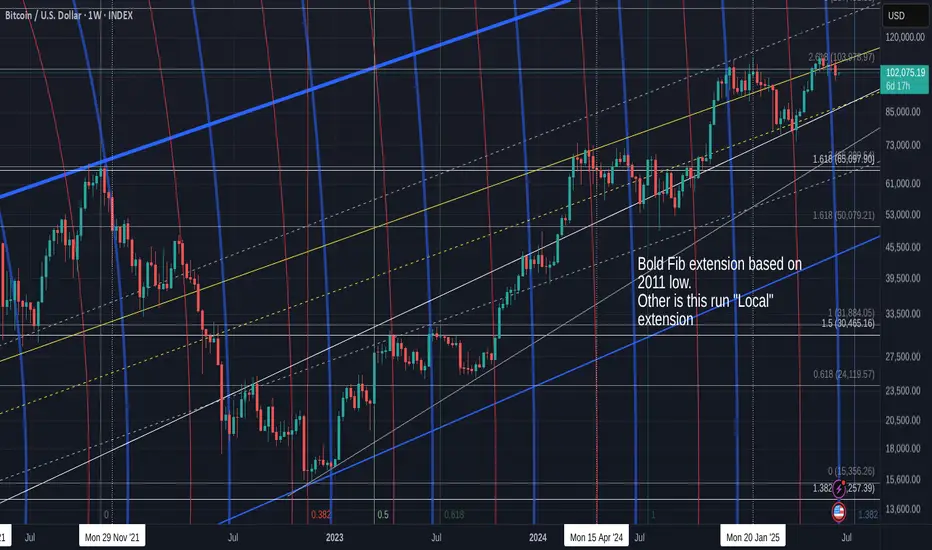
Bitcoin Closed week RED and opens Green but is back in channel
As the title says, BTC PA has fallen back in channel that offers a potential low in the High 80K should confidence fail.
PA also lost support on the Local 2.618 Fib extension.
This is a shame and poses potential problems reclaiming that.
I will say, that I do not consider this a long term Bearish beginning but it could certainly add to the "Calm" Summer I have talked about.
I say "Calm", that does depend on the world not entering a level of Madness.
The Zoomed chart below shows more detail
Here we can see clearly how PA got rejected off that upper trend line, fell through the 2.618 and is currently being rejected by it.
The potential for a further drop does exist and if we repeat the "Pattern" we have since the beginning of 2024, of bounce off Lower trend line, get rejected from Upper zone, re test lower as support and bounce again, we can expect to revisit 89K
This idea is supported from this LINEAR Daily chart
The dashed Trend line that is arrowed has origin in Sep 2024 and was also used again in April 2025.
That intersection the arrow points to is the intersection with the current supporting Fib circle at around 88500 USD
None of this is certain but these levels exist as support.
PA also has the ability to move higher
The Weekly MACD below shows us how MACD is turning down towards its signal line ( red)
We did this before in Jan 2024 ( Arrow) and The MACD bounced.
We talked about this possibility a few weeks ago But on a Daily MACD, things do look a little different.
The FEB 2024 looked like this, Bullish, rising and above Neutral
Currently, the Daily MACD looks like this
We just fell below Neutral and the Signal line just hit it
We may seea bounce but we need to have the idea that this may continue to drop a little further.
But the White bar on the Histogram shows us some recovery is currently in progress
We will have to watch the rest of this month closely. This time next week is last day of month.
I have mentioned a number of times that a small RED Month candle would be potentialy good.
We are currently Only just GREEN, so a further Drop in price is actually almost expected this week.
Interesting days ahead
BTC is expected to continue its decline to 100,000BTC has encountered resistance and fallen back several times near 110,000, forming an absolute suppression in the short term. It is difficult for BTC to overcome this resistance area in the short term. As BTC has been unable to break through for a long time, some profit-taking and panic selling will cause BTC to gradually collapse. At present, BTC has fallen back to around 104,000. During the retracement, it has built a short-term resistance area of 105,500-106,000, which limits the rebound space in the short term and will further strengthen the bearish sentiment in the market. BTC will completely open up the downward space.
At present, the 103,000-102,500 area still has a certain support effect on BTC. As BTC shows a volatile downward trend, this support area will be broken again and continue to fall to the area near 100,000. Therefore, in short-term trading, we can consider shorting BTC in the 105,000-105,500 area.
BINANCE:BTCUSDT BITSTAMP:BTCUSD BINANCE:BTCUSDT COINBASE:BTCUSD

Bullish bounce off 50% Fibonacci support?The Ethereum (ETH/USD) is reacting off the pivot which has been identified as an overlap support and could bounce to the 1st resistance.
Pivot: 2,089.45
1st Support: 1,669.20
1st Resistance: 2,687.43
Risk Warning:
Trading Forex and CFDs carries a high level of risk to your capital and you should only trade with money you can afford to lose. Trading Forex and CFDs may not be suitable for all investors, so please ensure that you fully understand the risks involved and seek independent advice if necessary.
Disclaimer:
The above opinions given constitute general market commentary, and do not constitute the opinion or advice of IC Markets or any form of personal or investment advice.
Any opinions, news, research, analyses, prices, other information, or links to third-party sites contained on this website are provided on an "as-is" basis, are intended only to be informative, is not an advice nor a recommendation, nor research, or a record of our trading prices, or an offer of, or solicitation for a transaction in any financial instrument and thus should not be treated as such. The information provided does not involve any specific investment objectives, financial situation and needs of any specific person who may receive it. Please be aware, that past performance is not a reliable indicator of future performance and/or results. Past Performance or Forward-looking scenarios based upon the reasonable beliefs of the third-party provider are not a guarantee of future performance. Actual results may differ materially from those anticipated in forward-looking or past performance statements. IC Markets makes no representation or warranty and assumes no liability as to the accuracy or completeness of the information provided, nor any loss arising from any investment based on a recommendation, forecast or any information supplied by any third-party.

MOODENG 100% GAIN ????MOODENG ready to go 0.3000 ??? yes if moodeng hold the bullish ob than possible we will go o.3000 or more moodeng already pump hard now at ob so expecting good gain from here if ob not break here a trade plan mange your risk accourding your captial
entry plan
0.1200_1300
targets
0.2500
0.3000
0.5000
sl
0.1100_0.10000
its NFA DYOR

ZECUSDT BEARISH SETUPIdentified a trend breakout under the daily timeframe which has a potential for a retest back on the key zone highlighted. Expecting a continuation in the bearish trend to follow up price target close to $40.

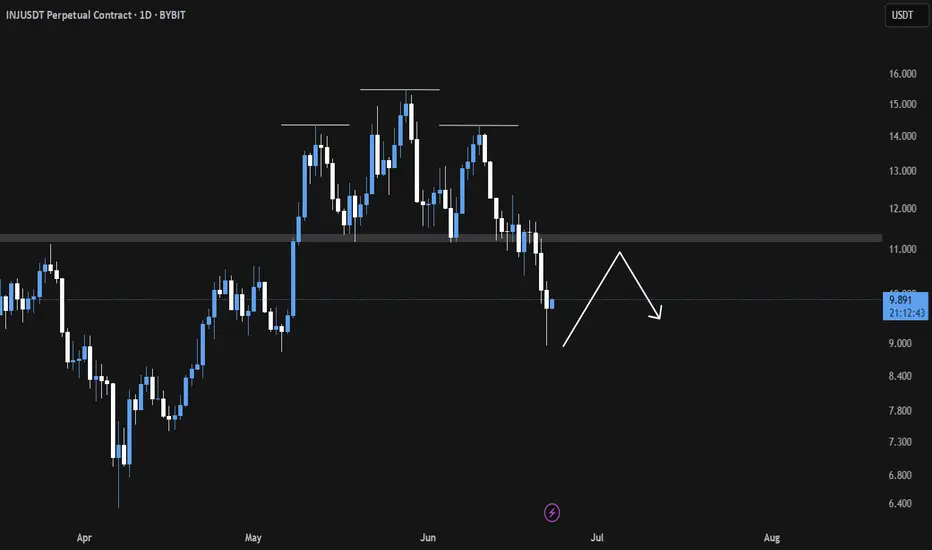
INJ Breakdown in Play Eyeing the Neckline for Precision ShortsINJ/USDT Analysis
〽️ The Head and Shoulders pattern has broken down successfully, confirming a bearish structure.
💠We anticipate a potential relief bounce towards the $11 region which aligns closely with the neckline retest zone. This area is likely to act as a liquidity trap, where institutional sellers may re-enter aggressively 👀.
🎯 Key downside targets remain at
1. $8.98
2. $8.03
3. $6.92
Strategic Plan 🎖️
Look to initiate short positions around the neckline retest near $11, as the risk-reward becomes increasingly favorable from that level.
Trade with discipline. Let the structure lead the execution. 🫡🧠
Fun Token: March 2026 New All-Time High? It Will Be FunA very strong bullish signal is present on this chart and we have some interesting price dynamics as well and a time-fractal to consider.
Good evening my fellow Cryptocurrency trader, how are you feeling today?
There was a very strong market flush recently with FUNUSDT (Fun Token), removing all LONGs and all SHORTs between December 2024 and April 2025.
After December, there was a crash producing a major low. The lowest prices in 5 years, since March 2020. Then immediately there was a strong rise producing the highest prices since December 2023. Then a retrace and the action goes back to baseline.
The multiple years long low removes all LONGs. The more than a year strong high removes all SHORTs. A full market flush.
The very strong bullish signal is related to the low point from June 2023. As the present retrace ends, the action is back above this level and this is super-bullish.
From March 2020 through late March 2021 we have 55 candles and 385 days. The same would give us a date of 30 March 2026 for the new ATH. That is if FUNUSDT grows in exactly the same way. This is just an entertaining exercise. This bull market can last 221 days, 180 days, 360 days... Anything goes. It can last 465 days for all I know, but, if the same pattern repeats, we have an entire year to see the market grow.
The exact date? The exact high? Anything goes.
What cannot be doubted is the fact that the Cryptocurrency market is set to produce the strongest growth period since 2021. It will be FUN.
Namaste.

Gains Network Consolidation At Market Bottom, 1,176% Profits PotGains Network hit bottom in early February. Consolidation at the lows has been ongoing now for 133 days. This phase is reaching its end.
This is truly a wonderful chart, a great trade-setup. Many altcoins hit bottom in April, some even earlier and did so in March. The earlier the bottom, the stronger the pair. This one hit bottom in February which means that buyers were always present in the ensuing months. As the overall market continued to hit new lows, Gains Network was growing from its base and this is bullish.
This week we have a full green candle after five weeks of bearish-neutral action. The first three weeks were bearish and the last two neutral, a perfect transition. From bearish to neutral, from neutral to bullish. We will now experience very strong wave of growth.
We can expect first an easy target of 339% to hit within 1-2 months. Then we have more and 719% potential profits come into focus, 2-4 months. Last, and it can go higher, a new all-time high at $16 produces 1,176%. It will be fun to watch. We are ready and waiting... Thank you for joining me. Feel free to follow.
Namaste.

BTCUSD CRACKing Everywhere!As I have been warning for a while now. See previous post.
I first warned to wait for the CRACK!
Then we got the 2nd CRACK!, very normal.
Then a nice M pattern with a lower high.
Then another CRACK!
And now a right Shoulder.
MAGIC!
Now we wait for the H&S to break down.
Click boost, follow, and subscribe for more. Let's get to 5,000 followers. ))

ETH Weekly – Eyes on $1900When panic creeps in, zoom out.
ETH on the weekly has lost both the 200MA and the 0.5 Fib.
In my opinion, if the BB center doesn’t hold here, price could retest the 0.618 Fib level a zone it tends to flirt with often.
The $1900 area might become a solid buy zone.
Always take profits and manage risk.
Interaction is welcome.

ETH / USDC Pool StakeSharp sell-off following the U.S. strike on Iran—ETH whale has entered. Set your liquidity pool range wide to capture a potential rebound. If the price continues to drop, no problem—full ETH position is anchored at the bottom of the range. Avoid swapping ETH to realize losses. Hold your original ETH and continue adjusting the range downward if needed. Your only real costs are minting and gas fees, so operate on a low-cost network like Arbitrum or Base to keep expenses minimal.

DOGUSDT Bearish signalDOGUSDT is creating lower lows and lower highs and the 0.003565 level is serving as resistance. A bearish continuation has the most probability in this setup...
TARGET 0.00269
SL 0.003740

The falling wedge of Pi Coin?Falling wedge Pi network pattern?The Pi Network (PI) token is currently showing signs of forming a falling wedge pattern, which is often interpreted as a bullish reversal signal in technical analysis. This pattern is characterized by two downward-sloping trendlines that converge, indicating a slowdown in bearish momentum.
One week to go.. just wait what will happen next.

Solana Bearish Divergence, 20% Drop Incoming?Hey Realistic Traders!
Bearish Signal Flashing on BINANCE:SOLUSDT , What Signals Are Showing?
Let’s Break It Down..
On the daily timeframe, Solana has formed a double top pattern, followed by a neckline breakout, which is a classic sign of a potential shift from a bullish to a bearish trend.
This breakout was confirmed by a break of the bullish trendline, accompanied by rising selling volume, which reinforces the bearish momentum. Adding to this, a bearish divergence has appeared on the stochastic oscillator. Bearish divergence occurs when price makes higher highs while the oscillator forms lower highs, signaling weakening buying pressure and increasing the likelihood of a reversal.
Given these technical signals, the price is likely to continue moving lower toward the first target at 134.13, with a possible extension to the second target at 114.96.
This bearish outlook remains valid as long as the price stays below the key stop-loss level at 180.26.
Support the channel by engaging with the content, using the rocket button, and sharing your opinions in the comments below.
Disclaimer: "Please note that this analysis is solely for educational purposes and should not be considered a recommendation to take a long or short position on Solana.

BTCUSDT - major support, Cut n Reverse Area??#BTCUSDT... market just r ached at his one of the most expensive area of the week and month
Keep close 101200
That is our ultimate supporting area.
Note: below 101200 we will cut n reverse on confirmation.
Good luck
Trade wisely

Trump:New update(don't miss it)hello friends👋
This time we came with the analysis of Trump's famous coin meme, which you requested a lot.
Well, as you can see, by making a double floor, the price has broken its downward channel and has grown well.
After the price growth, we saw the price suffering and then the price correction, which caused the formation of an upward pattern.
Now, according to the successful formation of this ascending pattern, it should be seen whether the buyers support the price in the specified support areas or not...
Pay attention that our trend is upward and the pattern made also shows an upward trend, that's why we have identified the support areas for you to enter the transaction step by step with risk and capital management.
🔥Follow us for more signals🔥
*Trade safely with us*

ETH 4H – Testing Support, Rejected by Weekly 200MAOn the 4H, ETH is closing below the weekly 200MA but is trying to hold the last daily close as support—similar to what it did on June 5 at 20:00.
The difference: back then, the 4H 200MA acted as support; now it’s been clearly rejected and price sits well below it.
With the weekly close approaching, if ETH stays under the weekly 200MA, there's a strong chance it revisits the range low support.
However, if it manages to reclaim the 200MA before the close, a move toward the last two weekly closes may still be on the table.
Always take profits and manage risk.
Interaction is welcome.

AERO: Clears the Runway! Can it gain altitude!?AERO gave a valid long setup
We were eye a possible retrace of an impulsive move and it displayed enough to trigger a rules-based entry.
Technical Breakdown
Key structural elements supported the setup:
Initial leg up showed impulse-like behavior
Pullback found support at a clearly defined AOI
Multiple MLT levels aligned with a common zigzag framework
Swift bounce off the Golden Corner Pocket (GCP)
Break and close above 0.54 completed the impulse structure
Prior resistance flipped into support
Volume confirmed the move, and price reached the first algo target, producing a reactive wick and confirming potential of algo activity.
This created a textbook TDU-style GCP/Algo/C-3 setup with measured entry and exit.
Risk Management
Partial profit was taken at the first MLT zone
Stop loss was moved into profit post-structure break
Scenario planning:
If move continues: positioned
If move stalls as a larger zigzag: no loss
Outlook
Attention now shifts to the next actionable level, possible second entry long
0.62 is the AOI for re-entry atm
Ideal scenario = Continuation in a wave 3, obvi
Alt scenario = Clean corrective to AOI + long
Bear scenario = Zig Zag complete
Conclusion
The trade played by the book!
Confluence across AOI, GCP, MLT, and volume created a qualified entry — not a guess.
This remains a great example of structure over sentiment and waiting for the market to meet criteria before engaging.

ETH READY TO GO 3000$ ???🔍 ETH/USDT Analysis – Daily Timeframe
ETH is currently trading at $2,427, holding above the key support zone around $2,370 - $2,390, which is aligned with the 100 EMA. This zone has acted as a strong accumulation area.
📈 Market Structure:
Price is consolidating inside a horizontal range. A confirmed breakout above the resistance zone ($2,650 - $2,700) could lead to a bullish continuation towards the major resistance at $2,861.
📊 Technical Outlook:
Trend: Sideways range (accumulation phase)
100 EMA: Acting as dynamic support
Breakout Potential: Bullish continuation expected on breakout and retest
📌 Trade Plan (Not Financial Advice):
Entry Idea: Break and close above $2,700 zone
Target: $2,861 and higher
Invalidation: Daily candle close below $2,370
ETH is building strength above its 100 EMA. A breakout from this range can trigger a fresh bullish leg.
🔁 Like & share your opinion! Always DYOR before trading.

BTCUSD – At a Make-or-Break LevelBTCUSD – At a Make-or-Break Level: Will Bitcoin Rebound or Slide Further?
Bitcoin continues to hover near a critical support level after last week's sharp drop. With rising macro uncertainty, shifting institutional flows, and growing interest in crypto regulation, BTCUSD is showing signs of a potential reversal — but traders should proceed with caution.
🌐 Macro Outlook – Debt Pressure, ETFs & Election Talk Fuel Uncertainty
US fiscal stress is building: Analysts warn that the United States could see interest payments exceed $1 trillion in 2025 — more than its defense or healthcare budget. This puts pressure on the Federal Reserve to consider fiscal tightening instead of rate cuts.
Spot Bitcoin ETF inflows are slowing: After a strong start in early 2024, institutional flows into spot BTC ETFs have cooled down recently. Hedge funds and asset managers are waiting for more clarity on economic policy.
Pro-crypto narratives gaining traction in US politics: With elections approaching, political figures are floating proposals to use Bitcoin as a strategic reserve asset and encourage crypto-based financial infrastructure.
Meanwhile, the US Dollar Index (DXY) remains volatile. A weaker dollar could support crypto, but stronger-than-expected inflation data may fuel further caution.
📉 Technical Analysis (BTCUSD – H1 to H4)
BTC is currently trading within a medium-term descending channel, and has recently tested the key support zone near 103,108.
A potential V-recovery pattern is forming. If buyers can hold this zone and break above 104,184, the price may target 106,047 and eventually 107,586.
However, EMA clusters (50–100–200) on the H1 chart are still pressing downward. A confirmed bullish reversal would require a breakout above 105,200 with strong volume.
✅ Suggested Trade Plan
🟢 BUY ZONE: 103,100 – 103,300
Entry: On price reaction with confirmation candlestick
SL: 102,600
TP: 104,184 → 106,047 → 107,586
🔴 SELL ZONE: 107,500 – 107,800
Entry: Only if price rejects resistance at upper channel
SL: 108,200
TP: 106,000 → 104,500
⚠️ Avoid aggressive shorting in the current range to reduce false breakout risk.
💬 Final Thoughts for Indian Traders
The current market is caught between macroeconomic caution and long-term crypto optimism. Bitcoin is holding near its lower range — a zone that historically triggers upward momentum.
For Indian traders, the key is to wait for clear structural confirmation and respect technical levels. Let price and macro alignment guide your decisions, not emotion or hype.
Plan the trade. Trade the plan. Protect your capital.

Stablecoin Market: A Clear Path to Bitcoin Over $700k?I've been following the strong correlation between stablecoin liquidity ( CRYPTOCAP:USDT , CRYPTOCAP:USDC , etc, here represented by CRYPTOCAP:STABLE.C ), and the Bitcoin price, and there's a very clear correlation between both.
Why is there a correlation between the stablecoin market and BITSTAMP:BTCUSD ?
An increase in stablecoin market cap means that more money is available to be invested in crypto and Bitcoin.
The more stablecoin liquidity exists, the easier it is for investors to invest in crypto. That's why we see a very strong correlation between the stablecoin liquidity and Bitcoin: the long-term correlation is 86%.
So now we know that BTC price follows the stablecoin liquidity.
The GENIUS Act and the stablecoin market
Treasury Secretary Scott Bessent recently posted that the stablecoin market could grow from the current $263 billion to $3.7 trillion. the data comes from a BIS report.
Why does this matter?
If the stablecoin market grows to $3.7 trillion and we continue to observe the high correlation with Bitcoin, the Bitcoin price would land between $700k and $1 million by 2030.
Let me know your thoughts!
