ETH 3D – Between Panic and Balance
When panic hits, zoom out and try to find balance.
ETHUSDT on the 3D timeframe just had its strongest rejection from the 200MA in this rejection series that started on May 13—exactly one month ago.
Price is now once again retesting the 0.5 Fib, continuing the same retesting pattern that began on May 13.
Touching the 200MA often triggers profit-taking from traders.
On the macro side, recent events are causing panic and prompting sell-offs.
Now let’s see if hitting the 0.5 Fib will bring buyers back in.
Looking at the volume bars from the past month, buying volume is increasing while selling volume is declining . This could suggest that in this choppy range, sellers are stepping back while buyers are starting to build strength.
MLR = SMA = BB center, confirming the current sideways environment.
The 50MA hasn’t even started to flatten—it’s still pointing down.
Always take profits and manage risk.
Interaction is welcome.
Cryptomarket

BTC/USDT 4H Chart Update –BTC/USDT 4H Chart Update –
After a strong rejection from the $110K+ zone, Bitcoin is now retesting a critical trendline support on the 4-hour chart.
Key Highlights:
Price dropped sharply to $103K, almost tagging the key ascending support zone.
The previous breakout from the descending trendline is now being retested, which is a classic bullish retest pattern.
If bulls defend this region successfully, expect a potential bounce towards $108K–$ 114 K.
However, a clean breakdown below $102K would shift short-term momentum bearish.
Eyes on this zone. High-probability decision area.
Watch for reaction candles and volume spikes to confirm the next move.
Thanks for your support!
DYOR. NFA

Aave Has Room To Go Lower, I Will Spot The ReversalAave outperformed many pairs. Total growth reached 185%. It even produced one final advance and peaked only two days ago, 11-June. But now the bears are in and taking control of the chart. A strong rise is balanced out by a strong drop.
I think this is a nice project, a great project a nice pair. The strategy here is all the same. Advanced traders go SHORT. The rest, wait for support to be established before going LONG. Wait for the drop to end before buying again.
Remember, there will be plenty of time and plenty of signals showing the low is in. I will be here posting charts everyday.
I will catch the perfect bottom on this retrace, the same we did 7-April. It will be easy.
In fact, we will spot the reversal even before it takes place.
Thanks for the follow and for your continued support.
Namaste.

Pepe, Finding The Next Support ZoneThe same analysis that I made for Dogecoin is true here on PEPEUSDT.
We have two support zones. We have lower highs long-term, starting December 2024 (six months is already long-term), and short-term, June vs May.
What we are seeing is a repeat of the December correction but a miniature version. The bullish wave that follows will be a repeat of the April-May advance but with total growth highly magnified.
So the correction will end up being much smaller while the bullish wave that follows much stronger. Alternation.
If you want more information on price action, what is happening, read all the recent charts I just published. The situation across several projects is quite similar, at least the ones I've been seeing.
The duration of the correction will vary between a few days to a few weeks. Some pairs are already at bottom and will recover soon while others still have a long way to go. Those that grew nicely recently will remain lower, those that didn't grow will move up strong first.
Each chart needs to be considered individually but that's the general picture. You can find which ones will move first on the next wave based on recent past action.
Thank you for reading.
Namaste.

Dogecoin, How Far Down Can It Go? Support Confirmed!The retrace is on and Dogecoin is moving lower with a full red candle. The trading day just started and this is truly concerning. As soon as I saw what was happening, bearish momentum growing, I wondered, will the last low (7-April) break or hold?
That's the question I will try to answer.
Since we already looked at the candles and chart structure (lower highs), I looked at the RSI to try and find some clues. Sure, the RSI is already bearish and became really weak 5-June. This is a positive signal because we are looking for signs of a reversal.
Once the RSI becomes weak it immediately starts to turn and the change happens first on the RSI and later the price. This is how you end up with a bullish or bearish divergence on the chart.
For the 7-April low to break, the RSI would have to go into extreme levels, ultra-weak/oversold, but this isn't likely, which means that there is a good chance that the 7-April low will hold.
A support zone is already being tested now which is the 0.618-0.786 Fib. retracement in relation to the April-May wave. While this is a weak support because it is based on the short-term, it is still a support zone and lots of bearish ammunition will be consumed here.
The 7-April low was a peak in September 2024 and also a bigger range from July 2024 (resistance turned support). In October 2024 this level was broken and tested one last time as support before the last bullish wave Dogecoin produced leading to a multi-year high.
In November 2024 again this level was tested on a wick and held nicely.
All in all, this means that we are likely to end with a higher low because this is a very strong support zone. I made it red on the chart.
If the action does move lower, it should only do so briefly on a candle wick. If you are lucky enough to be around when this takes place, you can go all-in at this point and you will be sitting on a great position for the next bullish wave.
Namaste.

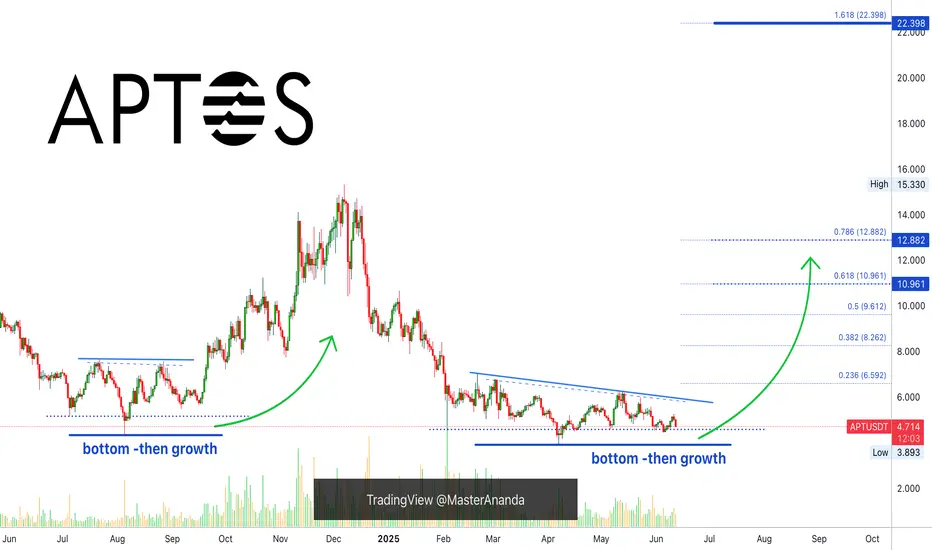
Aptos, Good & Bad (Leveraged Trading vs Spot)This is both good and bad at the same time.
The bad part, or rather sad part, is the fact that there hasn't been any decent bullish action recently. This pair did not grow by any significant amount after its 7-April low.
Ok, what about the good part?
The good part is that prices are low. This pair is "yet to move."
Low prices means a great buy opportunity for what we know comes next.
I know, I know... You might not believe me or your morale might be done but we already had a preview with many pairs growing between 100 and 300%. In less than two months. That's the preview. But the market is big and not the entire market can advance in a single wave. That's why I keep on harping "choose wisely," because sometimes we can end up with the pairs that are not moving in the current wave. They will move, trust, but some will move now and others later down the road.
Ok, good and bad.
The bad part is not that bad but it can be said that it is bad that prices are low. But this is actually good. If prices were high, there would be no buying opportunity, we would have to ignore, dismiss this pair. Since prices are trading low-near support, we can accumulate; buy and hold focused on the long-term.
I mentioned tons of times leveraged trading but all these chart setup can be traded spot. In fact, any setup that is good for leverage is even better for spot because the risk is none.
With spot trading we simply hold. What's the problem? You expected 1,000% growth in 2 months? If that's the case, it simply takes longer and we wait. See? No loss, the worst case scenario is a long-term wait. That's spot trading, buy and hold and you will win in the end.
Leveraged trading is more complex but you know, risk vs reward. You put on lots of risk, huge risk but wow, the rewards potential is awesome. We only approach this tool when we learn the market, when we know what we are doing and we have no need for money; only when money is already plentiful and available.
If you have a need to earn now, "make money fast," and so on; avoid leveraged trading at all costs because it is very likely that you will lose everything rather than achieve success. But, on the other hand, if you are living the good life, you communicate with your wife and you have heart, you are grateful for the food you eat, for the simple stuff, for your house, your friends, your bed; then you can use leveraged trading. Because you will be able to know when to close a position and say "thank you!" rather than double-down on a losing trade.
In short, we need a stable life and mind to use this tool with any success. If our lives and minds are not stable, it is better to start slow. If you cannot make money slow, you will not be able to make money fast. If you cannot appreciate $100, you won't be able to accept $1,000 for a single trade.
So, thanks a lot for your continued support.
I hope you are enjoying the content. It is always my pleasure to write for you, day after day after day.
Remember, it is not about getting it right or getting it wrong, it is all about a mental, emotional and spiritual connection. I am sharing what I learn just so that you can avoid the pain of a major loss, something that I know just too well because I've been there before. I've lost everything countless times and yet, I continue to fight, prosper and grow.
Namaste.
Bullish bounce?Ethereum (ETH/USD) is falling toward the pivot and could bounce to the 1st resistance which has been identified as a pullback resistance.
Pivot: 2,589.94
1st Support: 2,547.44
1st Resistance: 2,712.37
Risk Warning:
Trading Forex and CFDs carries a high level of risk to your capital and you should only trade with money you can afford to lose. Trading Forex and CFDs may not be suitable for all investors, so please ensure that you fully understand the risks involved and seek independent advice if necessary.
Disclaimer:
The above opinions given constitute general market commentary, and do not constitute the opinion or advice of IC Markets or any form of personal or investment advice.
Any opinions, news, research, analyses, prices, other information, or links to third-party sites contained on this website are provided on an "as-is" basis, are intended only to be informative, is not an advice nor a recommendation, nor research, or a record of our trading prices, or an offer of, or solicitation for a transaction in any financial instrument and thus should not be treated as such. The information provided does not involve any specific investment objectives, financial situation and needs of any specific person who may receive it. Please be aware, that past performance is not a reliable indicator of future performance and/or results. Past Performance or Forward-looking scenarios based upon the reasonable beliefs of the third-party provider are not a guarantee of future performance. Actual results may differ materially from those anticipated in forward-looking or past performance statements. IC Markets makes no representation or warranty and assumes no liability as to the accuracy or completeness of the information provided, nor any loss arising from any investment based on a recommendation, forecast or any information supplied by any third-party.

Potential bearish drop?The Bitcoin (BTC/USD) is rising towards the pivot and could drop to the 61.8% Fibonacci support.
Pivot: 107,000.93
1st Support: 104,300.41
1st Resistance: 108,341.47
Risk Warning:
Trading Forex and CFDs carries a high level of risk to your capital and you should only trade with money you can afford to lose. Trading Forex and CFDs may not be suitable for all investors, so please ensure that you fully understand the risks involved and seek independent advice if necessary.
Disclaimer:
The above opinions given constitute general market commentary, and do not constitute the opinion or advice of IC Markets or any form of personal or investment advice.
Any opinions, news, research, analyses, prices, other information, or links to third-party sites contained on this website are provided on an "as-is" basis, are intended only to be informative, is not an advice nor a recommendation, nor research, or a record of our trading prices, or an offer of, or solicitation for a transaction in any financial instrument and thus should not be treated as such. The information provided does not involve any specific investment objectives, financial situation and needs of any specific person who may receive it. Please be aware, that past performance is not a reliable indicator of future performance and/or results. Past Performance or Forward-looking scenarios based upon the reasonable beliefs of the third-party provider are not a guarantee of future performance. Actual results may differ materially from those anticipated in forward-looking or past performance statements. IC Markets makes no representation or warranty and assumes no liability as to the accuracy or completeness of the information provided, nor any loss arising from any investment based on a recommendation, forecast or any information supplied by any third-party.

Bitcoin's Correction Confirmed, 93-97K Next TargetBitcoin's bearish continuation is now confirmed with three consecutive days of bearish action, today being a full red candle.
Good afternoon my fellow trader, how are you feeling today?
Opportunities are endless in this market, and if you trade, you can profit from the bullish as well as the bearish waves. Good entry timing is all that is needed for a successful trade, the right map and mindset.
So the lower high is confirmed and today's action confirms an incoming lower low. The 100K support is very likely to break but this is not written in stone. This is a high probability scenario. We are aiming for a price range of $97,000 - $93,000. But this isn't necessarily the end. Depending on how this level is handled, we will be able to know if prices will go lower or what.
$88,000 is a good level in the case there is strong bearish volume when the above price range is challenged as support. Now it is all a wait and see. Patience is key.
Once the a new support zone settles, we adapt to the market and focus on green. The next step is red. Down we go.
Thank you for reading.
Namaste.

TradeCityPro | Bitcoin Daily Analysis #115👋 Welcome to TradeCity Pro!
Let’s dive into the analysis of Bitcoin and the key crypto indices. As usual, I’ll be reviewing the futures triggers for the New York session.
⏳ 1-Hour Timeframe
On the 1-hour chart, as you can see, yesterday the price was rejected from the 110256 level I previously mentioned. Following that, with the activation of the 108617 trigger, Bitcoin experienced a downward leg.
📊 Personally, I didn’t open a short position after the break of that level, but if you did, I suggest taking profits now as the price has reached the marked support zone.
🔍 As for me, I’ll wait to see how the price reacts to this support. If it breaks down, we can open a short position.
📈 However, if the price finds support here, we can once again look for a long position. The trigger for this will be found in the lower timeframes.
👑 BTC.D Analysis
Let’s move to Bitcoin dominance. Yesterday, BTC.D made a pullback to the 64.18 zone and now seems ready for another drop.
✔️ If 63.96 breaks, BTC.D could enter another bearish leg. If instead, the 64.18 ceiling breaks, it could push up toward 64.49 or even 64.67.
📅 Total2 Analysis
Looking at the Total2 index, after reaching 1.24 yesterday, it started to correct and dropped down to 1.18, touching the support with a shadow.
✨ If the 1.2 level breaks to the upside, the price could move back toward 1.24. If 1.18 breaks down, the correction may continue further.
📅 USDT.D Analysis
Now onto USDT.D. After a brief correction up to the 4.68 level, it has resumed its downward movement. If 4.64 breaks, the decline could extend toward 4.56.
💥 If instead, the 4.68 top breaks, it might bounce back up toward 4.72.
❌ Disclaimer ❌
Trading futures is highly risky and dangerous. If you're not an expert, these triggers may not be suitable for you. You should first learn risk and capital management. You can also use the educational content from this channel.
Finally, these triggers reflect my personal opinions on price action, and the market may move completely against this analysis. So, do your own research before opening any position.

MANTA Holding Rising Support — Eyes on BreakoutMANTA is once again respecting the rising support line and showing early signs of holding the structure.
Price action remains constructive — despite recent volatility, buyers are still defending the trendline well. As long as this rising support continues to hold, the setup remains bullish.
The next key area to watch is the resistance zone above. A breakout through that level could open the door for a much larger move, as visualised in the projected path.
For now, MANTA is in a healthy consolidation phase along the trendline. If momentum builds from here, it could trigger the next leg higher.

Phemex Analysis #89: Toncoin (TON) - Breakout or Breakdown?!Toncoin ( PHEMEX:TONUSDT.P ) has seen its price pull back to $3.22, marking a 60% decline from its all‑time high near $8.28 in June 2024. While this might raise concerns, the project’s fundamentals have been strengthening dramatically, validating long‑term optimism. Over the past month, TON has remained in a tight consolidation between roughly $3.50 and $2.88, often seen as the “calm before the storm.” This brings us to the key question: Is TON preparing for a breakout—or a breakdown?
Possible Scenarios
1. Breakout Rise
If TON rises convincingly above $3.50 with increasing volume, it could signal the end of consolidation and the start of a bullish rally. A breakout here could propel TON towards $4.21, unlocking a potential 40% upside.
Pro Tips:
Enter on a strong breakout above $3.50, ideally with volume exceeding recent averages.
For short term profit, aim for $4.21, $5.36 or $6.0.
2. Bearish Drop
If TON breaks below the $2.88 support level with increased volume, this could trigger a bearish reversal. A further breakdown toward $2.36 or lower price is possible as traders exit positions
Pro Tips:
Consider short positions if the drop occurs with significant volume.
For believers in TON’s long-term roadmap, $2.40 support zone could present a favorable accumulation zone.
3. Retest $2.35 Support
A third scenario involves TON dipping to $2.35–$2.40—where stronger foundation lies—before resuming upward momentum. A shallow retracement with declining volume would indicate a soft landing that sets the stage for another rally.
Pro Tips:
Observe volume closely; a low-volume drop often signals a drop with no follow-through.
Consider accumulating gradually at or just above this support range.
Conclusion
Toncoin is forming a classic “calm before the storm” pattern—tight consolidation backed by bullish fundamentals. Whether it breaks upward toward $4.50, dips toward $2.40, or holds within range changes how traders can approach risk and opportunity.
Prepare by:
Watching volume-driven breakouts above $3.50,
Planning entries or accumulations around $2.40,
And managing risk with tight stop-losses just beyond the consolidation boundaries.
With strategic planning, informed risk control, and attention to market cues, traders can position themselves to benefit from TON’s next major move.
🔥 Tips:
Armed Your Trading Arsenal with advanced tools like multiple watchlists, basket orders, and real-time strategy adjustments at Phemex. Our USDT-based scaled orders give you precise control over your risk, while iceberg orders provide stealthy execution.
Disclaimer: This is NOT financial or investment advice. Please conduct your own research (DYOR). Phemex is not responsible, directly or indirectly, for any damage or loss incurred or claimed to be caused by or in association with the use of or reliance on any content, goods, or services mentioned in this article.

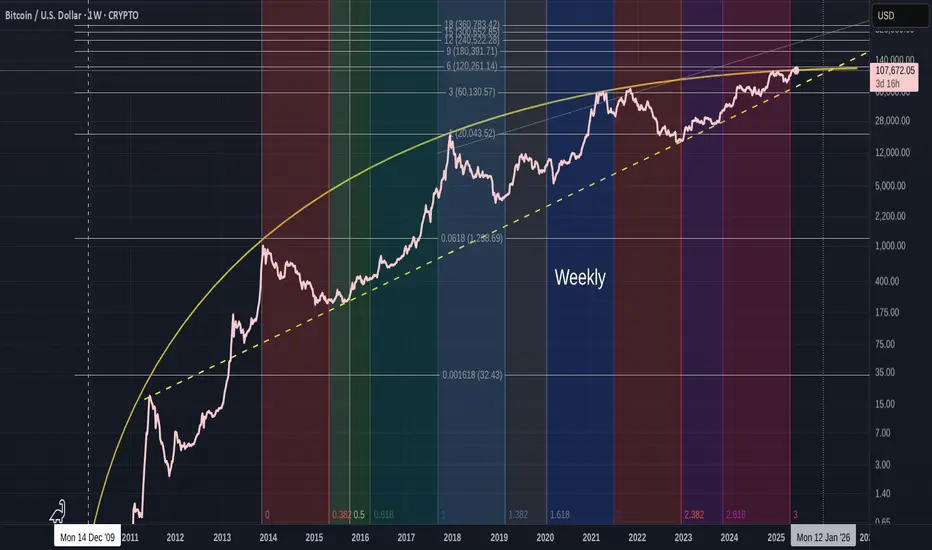
Bitcoin life cycle-stage One ending-Next cycle has to start NOW
There are 3 things to see in this chart
1) The Orange Arc of resistance. I have talked about this previously but to recap a little, it has its origins in Oct 2009 and has rejected EVERY ATH since then, as you can see on the chart. The Arc itself is part of a Fibonacci Spiral.
This Arc has begun to Squeeze PA against the lower trend line, that was formed in 2011.
And we are now in a position where PA MUST react or get pushed below the Long Term line of support.
This could be called Make or Break time for Bitcoin.
The Apex of this pennant is around Jan 2026
PA always reacts before the Apex.....99% of the time.
2) The Vertical Coloured bars are Trend Based Fibonacci Time, It begins on the 1st ATH in the channel that Bitcoin created. This channel is shown in the chart below
See how the Runs to the 2017 & 2021 ATH were all in a Bullish Green zone and how PA never retouched the lower trend line of support in this time
Since Mid 2021, we entered a Bearish Zone.
On the main chart, you will notice how this Fib Time has just ended.
3) The Trend based Fibonacci Extensions. Every single ATH rejected off a Fib extension.
The Root is at the 2009 Low and 1 is at the First ATH in the Bullish Fib time Zone.
The numbers here are all based off the 3,6,9 number sequence.
Lets look a little closer at the weekly chart
As we can see, PA got repeatably rejected off this orange Arc of Resistance and Current PA has been up there, trying to break through since 2024.
Many people have also commented on how PA has been so subdued this cycle and could this be reflected in the Fib Time showing us that we are in a Red Bearish Zone.
See how, from Mid 2021, when we entered a Strong Red zone, PA took a Deep dive off the Nov 2021 ATH.
Also note how this zone ended in late 2022 and in Jan 2023, PA began its current cycle Run. See the change in Colour ?
And Currently, while Bitcoin tries to break out of this squeeze, we were in a Red zone again....that just ended.
AND we can also see that we have not yet reached the 6 Fib Extension at 120,251 usd
The situation we face here is that if PA gets rejected off that Fib line, having just broken through the Arc, we could get pushed right back down under the Arc again. It is VERY STRONG RESISTANCE
This next move from Bitcoin HAS to be strong enough to take us up to the 9 fib line at 180,391 usd at a minimum. This way we can use the 6 Fib extension as support when PA cools off from a big push and so remain above the Arc and begin the Next long term cycle.
The Daily chart below shows us where we are right now
You can see how PA has repeatably tried to break above the Arc and been rejected Firmly Every time...so far, PA has avoided going right back down to the Lower trend line and has remained in near distance to this Arc..But we are running out of Time.
Recent attempts by PA have been Strong and I am sure that we will make it over but the real question is can we also get over that 6 Fib extension and stay above.
The weekly MACD certainly has enough strength to cope
Should we have a subdued Summer trading on Bitcoin, we will see this MACD cool off and be stronger before a sustained push near Autumn maybe.
To conclude, Bitcoin is under pressure to move out of its First Full Cycle.
It is getting Squeezed and now it is time for Bitcoin to prove it can cope with its new found "Adulthood"
The Next Big push, maybe later in the year, could very realistically reach 200K or more and this would place us Above that 9 Fibonacci extension I talked about earlier.
Of course, events could change and we could see PA collapse back below the Arc.
If this happens, all is NOT lost but it would certainly weaken the case for Long Term holders to continue doing so.
This then could create a Snownall effect and prices may tumble....And I will buy MORE....
Either way, we are in a HUGE moment for Bitcoin and I am privileged to be able see this all unfold...
Lets see what happens but, for me, I am Still VERY Bullish though Cautious....
We may have to revisit low 70K in the near future if Pa cannot get over this Arc and the 6 Fib extension
Altcoins (Market Cap) - Excluding Top 10 Coins - Inverted H&SBullish setup on the daily chart. CRYPTOCAP:OTHERS have once again made a inverted head & shoulders pattern which is a bullish reversal pattern. With the yellow chart below showing the Global M2 Liquidity index breaking out aswell. With more money in circulation, the propabilty is that more money will enter the market over time. Although, there can be latency.
For now I will trust the patterns in the chart of Others and follow it to see IF we can confirm the Inverse H&S. We have to break the neckline which should be around 310-325 B for June and July. But still, after that we need a pullback to confirm that neckline and make it support for continueation.
It´s a very interesting world right now. And much can happen. But IF this break out. It would probably be one of the most explosive bull markets to remember for a long time.. I myself are holding quality coins and tokens. Im not in memecoins, whats so ever. With the adoption happening right now in crypto I don´t believe that is the right market to be in right now.
Nothing on this profile should be interpreted as financial advice. Always do your own research and investment decisions. Im only expressing my thoughts and beliefs. Nothing else. Crypto is a risky business but It also has a lot of reward If being right. I can´t find equal yield in any other markets for now. If you know any, plz comment below =)
BINANCE:BTCUSD
CRYPTOCAP:OTHERS
CRYPTOCAP:TOTAL
MARKETSCOM:ETHEREUM
BINANCE:SOLUSD
BINANCE:SUIUSD
ICEUS:DXY

TradeCityPro | TON: Eyes Breakout from Daily Range Top👋 Welcome to TradeCity Pro!
In this analysis, I’m going to review the coin TON for you. The TON project is developed for Telegram and operates on a Layer One blockchain, enjoying significant popularity within the Telegram community.
✔️ The coin currently has a market cap of 7.95 billion dollars and ranks 18th on CoinMarketCap.
📅 Daily Timeframe
On the daily chart, as you can see, there’s a range box formed between the levels of 2.851 and 3.513, and price is oscillating between these two zones.
⚡️ I’ve marked the top of the box as a zone as well. This is a major supply zone, and a breakout above it could trigger a bullish trend.
🧩 Personally, I’m watching this coin closely. If buying volume enters and the trigger is activated, I’ll either enter a long position or buy it in spot.
📈 For a long position, the breakout of the 3.513 zone that I marked seems appropriate. If this zone breaks, we can open a long position.
🔍 The target for this position can be set around 4.123. This level is also a good spot trigger. If we enter a long at 3.513 and price moves up to 4.123, we can use the profit from the futures trade to buy this coin in spot.
✨ This way, we’ll have purchased a reasonable amount of the coin using profits, without needing any unusual risk or capital management because the capital was already managed beforehand.
📊 There’s also an ascending trendline visible on the chart that the price has responded to well. If the price gets rejected from the 3.513 zone and breaks this trendline, we can open a short position once the trendline trigger is activated, targeting the 3.024 and 2.851 levels.
📝 Final Thoughts
This analysis reflects our opinions and is not financial advice.
Share your thoughts in the comments, and don’t forget to share this analysis with your friends! ❤️

Last week Bitcoin created massive liquidity at a key resistance!🚨 Bitcoin Update – A Bullish Storm Is Brewing? 💥
Last week, Bitcoin created massive liquidity at a key resistance zone, and guess what? That liquidity is still untouched. The market hasn’t fully tapped into it yet — and that’s a big deal.
Recently, BTC smashed through resistance and even left behind a Bullish Fair Value Gap (FVG), signaling strength. But hold on—after this breakout, the market is showing signs of a minor pullback, likely to retest its marked IRL (Important Reaction Level).
📉 It’s cooling off temporarily... but don’t blink. This zone could act as a springboard for the next big leg up.
💡 Here’s the kicker: there’s still a ton of liquidity waiting above. If the market wants it—and it usually does—there’s a high probability (80%+) of another bullish push.
👀 Watch this area closely. It’s a make-or-break zone.
📊 Do Your Own Research (DYOR) – this is not financial advice, just a friendly nudge from the charts.

Dogecoin Bearish But...Yes, Dogecoin is bearish now but this is only a short-term situation, it is the end of a long-term correction. Notice the chart, Dogecoin has been producing lower highs long-term, since December 2024.
Recently, there was a major low in April and then a recovery and after this recovery we have local lower highs. The current drop is the continuation of the retrace that started 11-May. This retrace should end soon, within weeks or just a few days.
As soon as the low settles, we can enter the market bullish again. If you trade spot, simply wait. Day traders can easily SHORT but the range is short, after a small drop cover and switch back to LONG. Experts only.
That's the scenario. We are very likely to get a higher low compared to 7-April. If too many leveraged positions are open though and the market wants to remove those, there can be a long wick that pierces support for the action to recover the next day.
So, the drop can be fast, can be small, can be hard, can be easy or it can be short, it doesn't matter, once it is over, Dogecoin will continue to grow.
Patience is key.
Thanks a lot for your continued support.
Namaste.

Bitcoin's Support in Focus: Stay Alert for Candle Closes
BTC on the 12H looks ready to close below the recently claimed W + 5D support.
It’s a signal to stay sharp and stick to a solid plan: but not a call to action just yet.
Let’s see how the next 3 to 5 candle closes unfold.
Always take profits and manage risk.
Interaction is welcome.

Bitcoins Path?The is how I'm looking to play CRYPTOCAP:BTC over the coming years.
It is my belief that we completed Wave 1 of the SuperCycle and Wave 2 has just begun

₿ Bitcoin: Further Upside ExpectedBitcoin (BTC) pulled back slightly in yesterday’s session but remains on track to continue its corrective rally within green wave B. In line with our primary scenario, this advance is expected to reach the blue Target Zone between $117,553 and $130,891. Afterward, we anticipate the onset of wave C, which should initiate a substantial decline—driving the price down into the lower blue zone between $62,395 and $51,323. This is also where we expect orange wave a to conclude. From there, wave b should provide a temporary rebound before wave c resumes the broader downtrend, ultimately completing blue wave (ii). That said, there’s still a 30% probability that blue wave alt.(i) has not yet topped. In this alternative scenario, BTC would extend higher, potentially breaking above resistance at $130,891 before the corrective phase resumes. The daily chart illustrates the entire five-wave blue sequence and shows our expected low for wave (ii) within the blue zone between $37,623 and $26,082.
📈 Over 190 precise analyses, clear entry points, and defined Target Zones - that's what we do.

RENDER Bounces from Strong Confluence Zone$RENDER/USDT Update
RENDER is holding well above the key support zone after a clean retest of the area of confluence.
What’s interesting here is that the old resistance has now flipped into support, this is often a strong bullish signal on higher timeframes.
Price bounced exactly where you’d expect, at the intersection of horizontal support and the rising trendline.
As long as RENDER continues to respect this zone, the structure remains bullish.
DYOR, NFA
Thanks for following along — stay tuned for more updates!

Altcoin MarketCap - Consolidating Before the Ride!On the chart you can see a Pure Capitazation of Altcoins - Crypto Market Cap Excluding Bitcoin, Ethereum and ALL Stablecoins.
There was formed a very clear model that has all chances of repeating once again:
First goes a strong ascending movement from 0 to a bit higher than 0.618 Fibo lvls.
Then there is a correction inside the descending channel/bull flag down to ~0.382 with one long shadow below that sets a 0 point for a new cycle.
Breakout of a bull flag follows after.
Final stage before the growth is consolidation in the range of 0.382 and 0.5 levels by Fibo.
Pump.
We are currently at the 4th stage , as you might have guessed. The consolidation can still take some time, up to a couple of months, since there are no specific time restrictions that invalidate the model.
However, this doesn't cancel the fact that the target is 1 by Fibo, namely $1.7T MarketCap of Altcoins, which is x2 from current points . I tend to believe holders deserve such a run.
