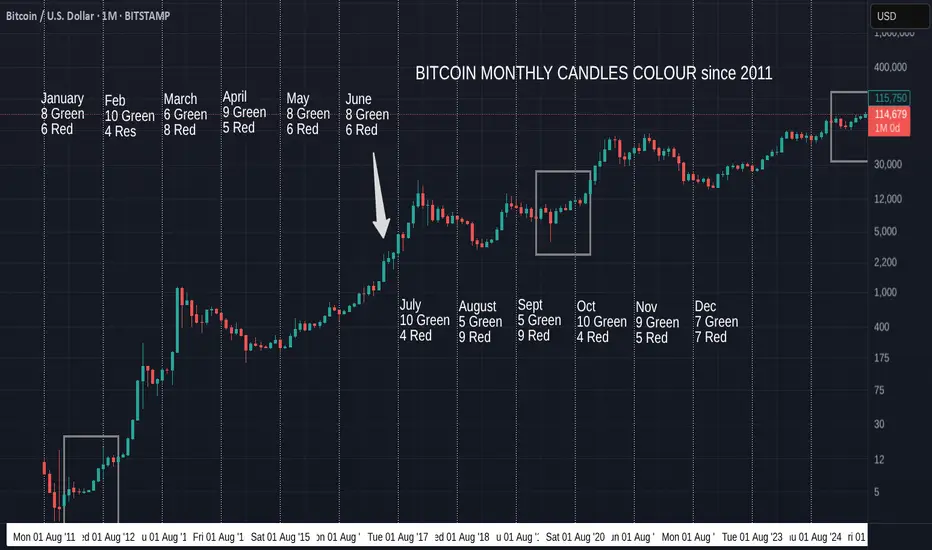
Bitcoin Monthly Candle Colour patterns and Colours since 2011
We got the expected GREEN July and so, amazingly, we continue to repeat the pattern from January to July 2012. ( Left Box )
It is almost the same pattern as 2020, apart from the Red May candle in that Year. (Right box)
The Large Arrow points towards another occasion where we had a series of consecutive Green candles from March to July, though these candles sizes are nothing like the ones we are currently experiencing.
The Boxes show us The only 2 occasions where we have had a Green December, Red January, Red February, Green March, Green April.
Then we had a Green May 2012 and a Red May 2020
Then both repeated a Green June, Green July.
The thing to note here is how all these are en-route to Cycle Highs.
So, August count currently is 5 Green to 9 Red, so the Odds are, while looking at BTC History, that we will get a RED August
HOWEVER, if we continue this run of following previous patterns, we will see a GREEN August.
In fact, 3 of those 5 Green August closes were in these 3 patterns mentioned.
Every single one of the 5 Green previous August followed a Green July, the last time was in 2021.
As mentioned in last months report, the size of the candles currently in this pattern are more like those in 2020 than the other 2 patterns talked about here.
With this in mind, we may expect a smaller Green candle close for August , Followed by a small Red candle in September. This did also happen in 2017 ( Arrow).
This August has opened Red but so far this year, many month opens were red and then changed.
So, My expectation id for a small Green August as markets cool off over the holidays and we wait for the start of Q4 in October.
We will have to wait and see as ever
Stay safe
Cryptomarket
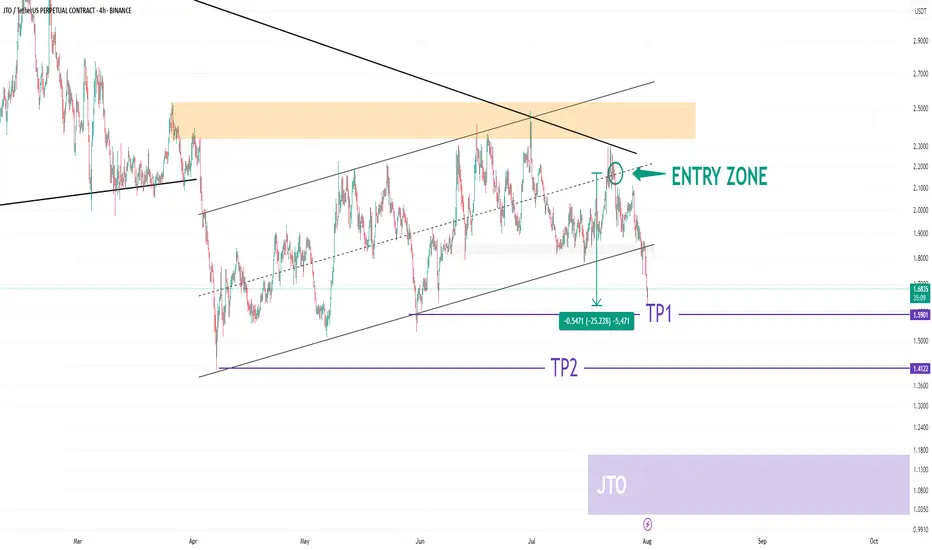
JTO USDT UpdateHELLO 😍
JTO Update
💁♂️ -25% 🔥
I shared this analysis when it was in the entry section. It would be nice to have an update of this analysis.
The JTO cryptocurrency has corrected 25% since the entry zone.
We saw a very good analysis together. What do you think? 😊💖
You can save some profit from the position in this area. 🐱
Please don't forget to like, share, and boost so that I can analyze it for you with more enthusiasm. Thank you. 💖😍
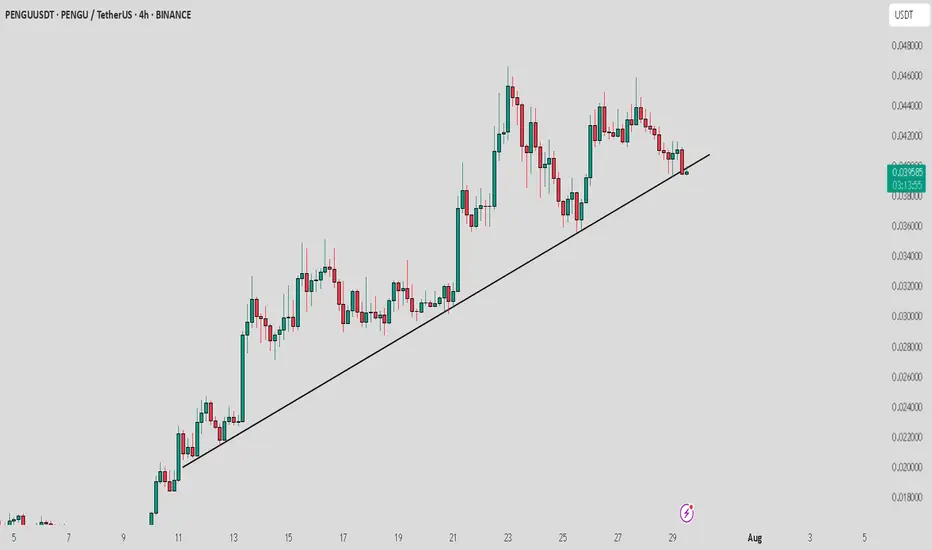
PENGU / USDT : Breaking down from Trendline supportPENGU/USDT is breaking down from the trend line support, but the retest is still in progress. Watch for rejection at key levels.
Pro Tip: Wait for confirmation of rejection before entering the trade and always apply proper risk management to safeguard your position.
Litecoin H4 | Bullish bounce off 50% Fibonacci supportLTC/USD is falling towards the overlap support and could bounce to the take profit
Buy entry is at 101.85, which is an overlap support that lines up with the 50% Fibonacci retracement.
Stop loss is at 97.43, which is a pullback support that aligns with hte 61.8% Fibonacci retracement.
Take profit is at 110.38, an overlap resistance.
High Risk Investment Warning
Trading Forex/CFDs on margin carries a high level of risk and may not be suitable for all investors. Leverage can work against you.
Stratos Markets Limited (tradu.com ):
CFDs are complex instruments and come with a high risk of losing money rapidly due to leverage. 65% of retail investor accounts lose money when trading CFDs with this provider. You should consider whether you understand how CFDs work and whether you can afford to take the high risk of losing your money.
Stratos Europe Ltd (tradu.com ):
CFDs are complex instruments and come with a high risk of losing money rapidly due to leverage. 66% of retail investor accounts lose money when trading CFDs with this provider. You should consider whether you understand how CFDs work and whether you can afford to take the high risk of losing your money.
Stratos Global LLC (tradu.com ):
Losses can exceed deposits.
Please be advised that the information presented on TradingView is provided to Tradu (‘Company’, ‘we’) by a third-party provider (‘TFA Global Pte Ltd’). Please be reminded that you are solely responsible for the trading decisions on your account. There is a very high degree of risk involved in trading. Any information and/or content is intended entirely for research, educational and informational purposes only and does not constitute investment or consultation advice or investment strategy. The information is not tailored to the investment needs of any specific person and therefore does not involve a consideration of any of the investment objectives, financial situation or needs of any viewer that may receive it. Kindly also note that past performance is not a reliable indicator of future results. Actual results may differ materially from those anticipated in forward-looking or past performance statements. We assume no liability as to the accuracy or completeness of any of the information and/or content provided herein and the Company cannot be held responsible for any omission, mistake nor for any loss or damage including without limitation to any loss of profit which may arise from reliance on any information supplied by TFA Global Pte Ltd.
The speaker(s) is neither an employee, agent nor representative of Tradu and is therefore acting independently. The opinions given are their own, constitute general market commentary, and do not constitute the opinion or advice of Tradu or any form of personal or investment advice. Tradu neither endorses nor guarantees offerings of third-party speakers, nor is Tradu responsible for the content, veracity or opinions of third-party speakers, presenters or participants.

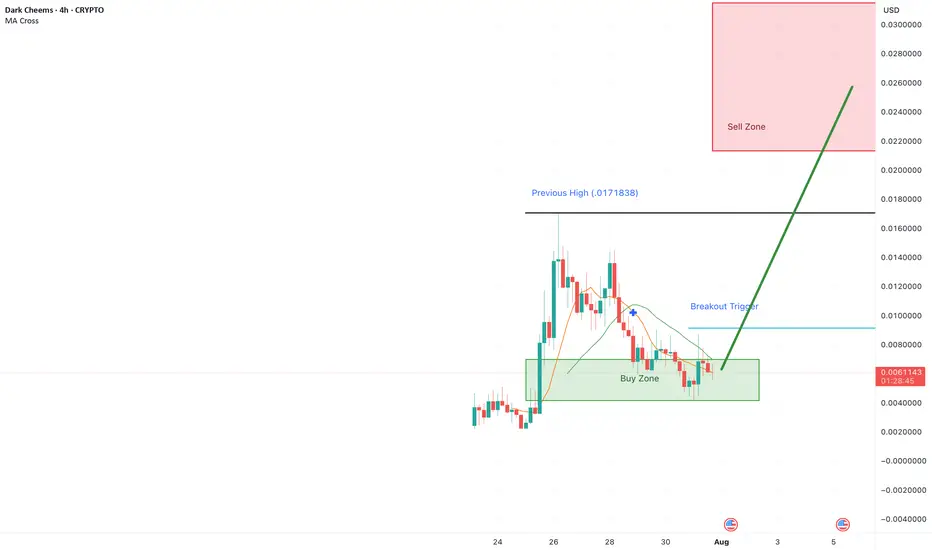
$TOTAKEKE – Dark Cheems Building Momentum? Meme Bull Run SetupOverview
Totakeke (aka Dark Cheems) is positioning itself as the “brother coin” to the well-known meme Cheems on BSC. It’s been quietly gaining attention. It has been tweeted by PancakeSwap, Trust Wallet, Four Meme, and even interactions from CZ on X! HOLY SHIII! With meme coins leading this market cycle, Totakeke’s early-stage market cap of $6.2M puts it in prime territory for explosive moves if narrative momentum holds.
Initial discovery pump around July 25–26 → price surged to 0.025 before sharp retrace.
Current -75% pullback into accumulation zone (0.0058–0.007) matches classic meme cycle setups (PEPE, BONK patterns).
Liquidity at $408K = thin books; big buys/sells swing price 20%+ easily.
Key Levels
Accumulation Zone: 0.0058–0.007
Breakout Trigger: 0.009–0.01 (close above signals next wave)
Previous ATH: 0.025 (first upside target)
Meme Extension Target: 0.04–0.05 (6–8x potential if bull run continues)
Narrative Catalyst
Strong ties to BSC meme culture (Cheems brother narrative).
Engagement by top ecosystem accounts (PancakeSwap, Trust Wallet, CZ).
Community buzz forming → potential for “viral rotation” if meme bull run expands.
Play Idea (Meme Bull Logic)
Accumulate quietly in base range; position size small due to volatility.
No tight stop-loss: meme coins wick hard; manage risk via exposure, not micro stops. aka nut up or shut up
Upside targets: 0.01 / 0.025 / 0.04 (scale out as narrative develops).
Lose 0.0058? Next support ~0.0045 (still viable base in meme context).
Totakeke fits the early-stage meme cycle template.. strong narrative tie-ins, early ecosystem attention, and chart structure that mirrors successful meme plays pre-run. If meme momentum continues across BSC, this could be one to watch for multi-x potential.
Not financial advice. Meme coins are extremely volatile... play size and timing matter more than tight TA.
ADA Setup – Eyeing Entry After 70%+ RallyCardano (ADA) has surged over 70% in recent weeks. A healthy pullback is underway, and we’re watching the key support zone for a potential long entry targeting the next leg higher.
📌 Trade Setup:
• Entry Zone: $0.65 – $0.67
• Take Profit Targets:
o 🥇 $0.98 – $1.15
o 🥈 $1.50 – $1.60
• Stop Loss: Just below $0.62

BTC : The future of Bitcoin...Hello friends🙌
👀According to the price history, the price has always been bullish and is in a long-term bullish channel.
📈Now that the price is struggling in the middle of the channel and is gathering strength for a big move, which is expected to break the middle of the channel in the form of a resistance or middle channel, the price will move to the ceiling of the channel.
⚠Don't forget risk and capital management.
🔥Follow us for more signals🔥
*Trade safely with us*

MEW : A meme coin that hasn't grown yetHello friends🙌
Given the decline we had, you can see that buyers entered the specified support area and entered the price into the ascending channel. That is why we can buy with risk and capital management and stay with it until the specified targets.
🔥Follow us for more signals🔥
*Trade safely with us*

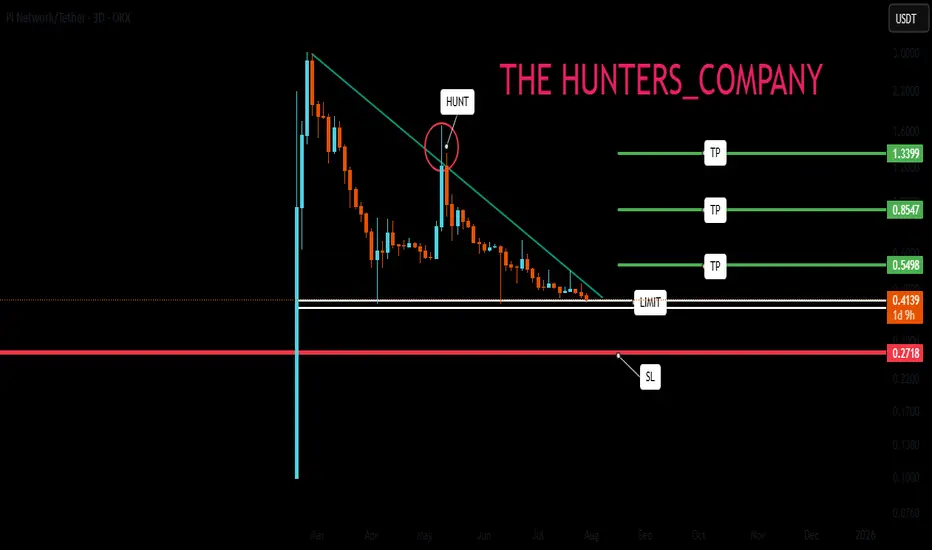
PI NETWORK : Will it finally be pumped?Hello friends🙌
👀According to the decline we had, you can see that the price has reached an important area and has formed a floor in this area. Considering the classic ego that is forming on support, you can enter the trade by breaking the resistance, of course, by managing risk and capital and moving with it to the specified goals.
🔥Follow us for more signals🔥
*Trade safely with us*
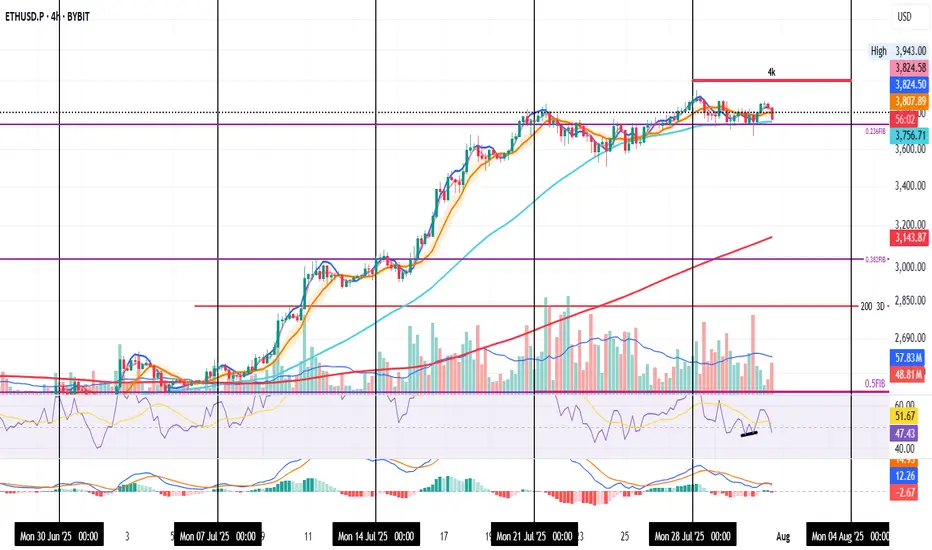
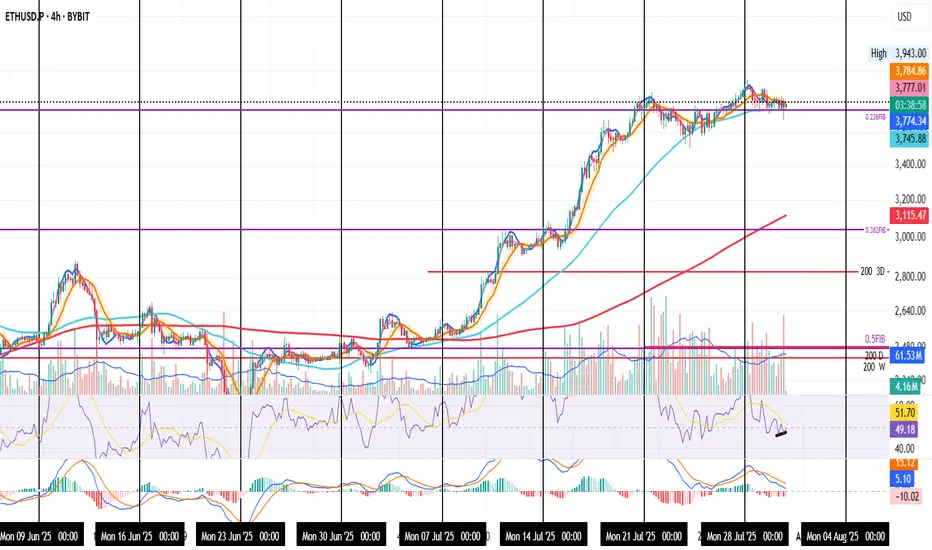
ETH Holding Steady in the Noise
ETH on the 4H
Price is pulling back again — mostly due to sticky inflation.
Even though YoY CPI came in at 2.8% (vs 2.7% expected), MoM data was on target, so the market may just be pricing in “higher for longer.”
Back to the chart — not much has changed.
ETH is still holding above both the 0.236 Fib and the 50MA.
The next real resistance is around $4,000.
Personally, I’d rather see price consolidate and gear up for a clean breakout than rush into it and get rejected.
Right now, it feels like ETH is waiting for direction.
It had a reason to drop — and didn’t.
It had a reason to fly — and paused.
Could be prepping for a boring chop before a sudden move.
I'm still bullish overall. Holding a long.
If it moves against me, I’ll scale out.
If it breaks higher, I’ll scale in.
Always take profits and manage risk.
Interaction is welcome.
TradeCityPro | Bitcoin Daily Analysis #140👋 Welcome to TradeCity Pro!
Let’s dive into the Bitcoin analysis. Yesterday, the interest rate decision by the US Federal Reserve was announced, and once again, just like the past few months, it remained unchanged. Let’s see what impact it had on Bitcoin.
⏳ 4-Hour Timeframe
In the 4-hour timeframe, after the announcement of the unchanged interest rate and Powell’s speech, Bitcoin printed a red candle on the support zone and even wicked lower, but then recovered and the price returned back into the box.
✔️ Basically, we can say that this month’s rate decision had no real impact on the market, and Bitcoin is still moving inside its range box. The fact that the support zone wasn’t lost is a positive sign for the continuation of the trend.
⭐ But the important point is this: if the uptrend is going to continue, the price must print a higher high or at least a level equal to 120041, and in my opinion, if for any reason a lower high gets printed, the chances of breaking below 116829 significantly increase.
📊 I currently have no new position on Bitcoin, and all my entries are below 110000. But if 120041 breaks, I’ll open a long position for the next bullish wave that Bitcoin might start.
💥 A major trigger for starting a new leg is the 61.67 level on the RSI. As long as RSI remains below this level, there’s no bullish momentum in the market — and considering that the number of touches to 116829 has increased, the probability of a correction is also rising.
❌ Disclaimer ❌
Trading futures is highly risky and dangerous. If you're not an expert, these triggers may not be suitable for you. You should first learn risk and capital management. You can also use the educational content from this channel.
Finally, these triggers reflect my personal opinions on price action, and the market may move completely against this analysis. So, do your own research before opening any position.

PUMPUSDT: Bullish Breakout and Retest - A Potential 34% Upside?Hello, traders!
Today we're looking at the PUMP/USDT pair on the 4-hour timeframe, and a very clean technical setup is unfolding that points towards potential bullish continuation. Let's break down the key elements of this analysis.
The Analysis
The chart presents a classic breakout and retest scenario, which is often a strong indicator of a trend reversal or continuation.
Descending Trendline Breakout: The most significant feature is the decisive breakout from a major descending trendline that had been capping the price for a considerable period. Breaking this trendline is a primary signal that the previous bearish momentum is weakening and buyers are starting to take control.
Break of Horizontal Resistance (S/R Flip): Following the trendline break, the price also successfully pushed through a key horizontal resistance zone, identified on the chart between approximately $0.002966 and $0.003044. This level has now, as expected, turned into a new support base.
The Retest: We are currently witnessing a pullback to this newly established support zone. This "retest" is a critical phase. A strong bounce from this level would confirm the breakout's validity and suggest that the market has accepted this price floor, paving the way for the next leg up.
Volume Confirmation: Notice the volume bars at the bottom of the chart. There was a visible spike in volume during the initial breakout candles, which adds conviction to the move. It indicates that the breakout was backed by significant buying interest.
The Trade Idea
Based on this structure, a potential long opportunity presents itself.
Entry: A favorable entry point could be found within the current support zone ($0.002966 - $0.003044), especially upon seeing confirmation of a bounce (e.g., a bullish engulfing candle or a hammer on the 4H or 1H chart).
Target: The analysis points to a primary target at the next major resistance level, located around the $0.004000 psychological mark. As measured on the chart, this represents a potential upside of over 34%.
Invalidation: This bullish outlook would be invalidated if the price fails to hold the current support and decisively closes back below the $0.002966 level. Placing a stop-loss below this zone is a prudent risk management strategy.
Conclusion
In summary, PUMPUSDT is displaying a textbook bullish setup. The combination of a trendline breakout, an S/R flip, and a live retest offers a compelling case for potential upside. As always, manage your risk carefully and wait for your preferred confirmation signals before entering a trade.
Disclaimer: This is not financial advice. The analysis provided is for educational and informational purposes only. Trading cryptocurrencies involves a high level of risk. Please conduct your own research and risk assessment before making any investment decisions.

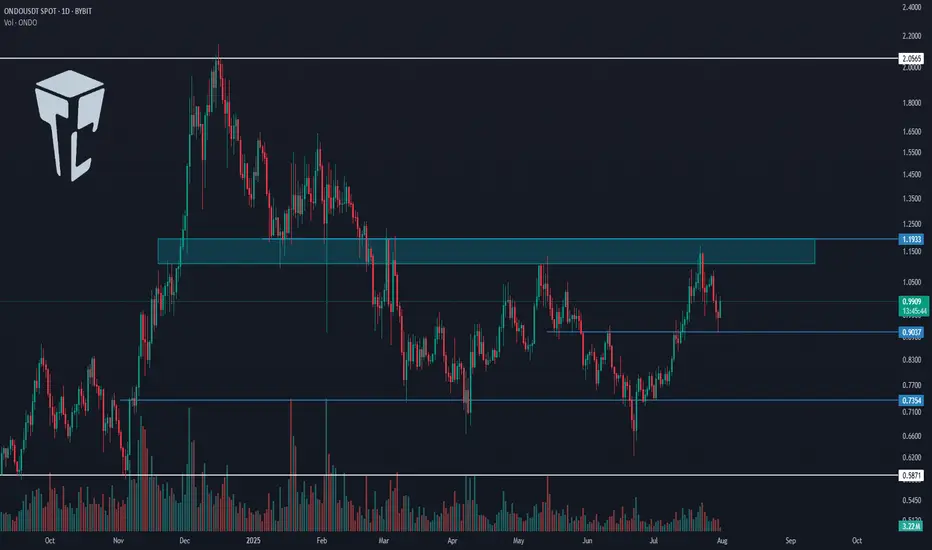
TradeCityPro | ONDO Builds Strength Beneath Key Supply Barrier👋 Welcome to TradeCity Pro!
In this analysis, I want to review the ONDO coin for you — one of the RWA projects, currently ranked 37th on CoinMarketCap with a market cap of $2.93 billion.
📅 Daily Timeframe
In the daily timeframe, as you can see, this coin has formed a range box between the levels of 0.7354 and 1.1933, and the price is currently sitting in the upper half of this box.
✔️ At the moment, the price is hovering around 0.9037, and it’s forming a higher low above 0.7354. If this low gets confirmed, the probability of breaking above 1.1933 increases.
⭐ The 1.1933 zone is a very significant supply level that was previously acting as support in late 2024, and after being broken, has since acted multiple times as resistance.
📊 If this area breaks, we can open a long position, or even buy this coin in spot. Personally, if this trigger is broken, I’ll open a long-term long position.
✨ The target for this position is 2.0565, and once the price reaches this level, we can take profits and consider a spot buy.
📝 Final Thoughts
This analysis reflects our opinions and is not financial advice.
Share your thoughts in the comments, and don’t forget to share this analysis with your friends! ❤️
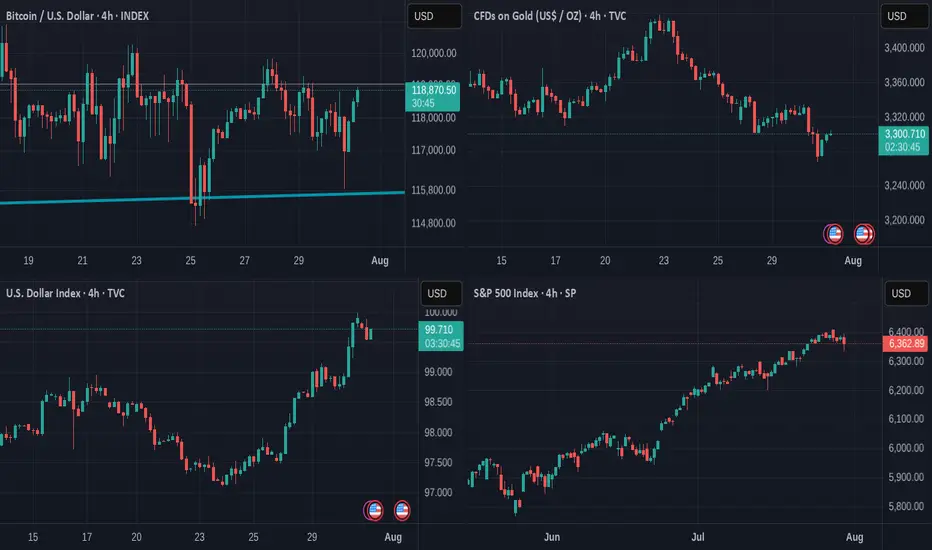
Has Bitcoin become a "SAFE" asset ? These charts show that......
After we heard the US Federal Reserve hold rates yesterday, Markets Fell some.
And Bitcoin joined them for a couple of hours but Look now.
While the $ falls, the S&P Falls, GOLD is the traditional haven of safety and we can see how it Rose in Value over the last 12 hours
The $ has Fallen over the last 8 hours
S&P Stalled for the last 24 hours
And the STRONGEST positive moves over the last 12 hours were from BITCOIN rising, though it is taking a breather for the moment.
SO, has it become a SAFE HAVEN ?
Put it like this. Bitcoin has NOT lost value like it used to when under pressure.
We have yet to see what would happen once it reaches its cycle Top. Will it retreat as it has historicaly...
But for now, it does seem to be a strong store of Value and remains with potential and likelihood of further rises.
The TOTAL CRYPTO MARKET CAP chart below
This shows us that the investor market seems Very confident in the Crypto Market,,Just going from strength to strength.
The TOTAL 2 Market Cap chart shows us something very interesting.
The TOTAL2 chart is the Total Market Cap MINUS BITCOIN
Compare the 2 charts and you will see how the TOTAL chart has risen way over its previous cycle ATH but the TOTAL2 is currently being rejected off its previous ATH line.
This clearly shows us that BITCOIN is the strength in the Crypto Market.
It is the same story on the TOTAL3 chart ( TOTAL minus BTC & ETH )
It is the same on the OTHERS chart ( Top 125 coins minus top 10 by market Cap )
BITCOIN CARRIES THE MARKET
These are early days but the Future of Bitcoin does seem VERY good
So far this cycle, the largest retrace was -31%
This drop was NOT a sharp Drop over a short period of time. It was an expected and controlled drop over 112 days.
But the zoomed out version of that chart tells us something VERY GOOD
PA has risen above and Tested and held that line of resistance that had rejected PA at Cycle Top ATH in 2017 and 2021.
That is a HUGE move and we wait to see if we Hold and move higher away from this line.
SO, Is Bitcoin a Safe Haven ?
It is certainly looking more and more like it.
PA is secure, has held position well and is in Price discovery...slowly and with caution...but always moving forward.
The traditional 4 yeat Cycle would end in late Q4 this year and so we have to wait and see what happens then.
But Bitcoin PA has moved into New ground on so many fronts now.
The traditinal BEAR market may not appear, in which case, YES, Bitcoin could become a New SAFE HAVEN
Buy Bitcoin
Hold Bitcoin
BTC.D FIB Lvl RejectionI'm liking the recent pullback in Bitcoin dominance - we're finally getting a taste of those altcoin gains we last saw around December. Each time dominance hits a key level on the Fibonacci retracement, we tend to see a pullback, and this recent rejection near the 0.786 level is no exception. It's a recurring pattern worth keeping an eye on.
That said, I still believe there’s a chance for one final rally in Bitcoin dominance - a potential shakeout before the real altseason begins. Historically, when Bitcoin breaks out of consolidation and pushes to new all-time highs with strong displacement, dominance tends to dip shortly after. So if BTCUSD continues to range at these current levels, I wouldn’t be surprised to see dominance spike again before we get the real altcoin momentum everyone’s waiting for.
This can also relate to what I've been reviewing in my previous charts published on my page

Dash RocketDash has been in a bearish trend for some time now, but it has stood the test of time being one of the OG coins of the market with this double bottom within this descending channel on the daily and a retest of demand I believe this coin will see $50 soon.
It’s master node runners and minors have kept the chain going, and we should be breaking its bearishness very soon.

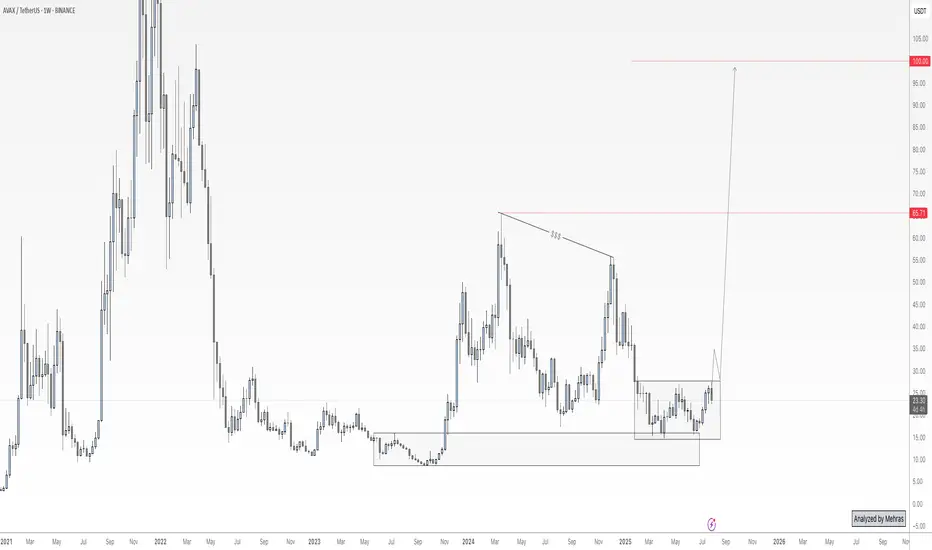
AVAX – Hidden Chance for Latecomers🔥AVAX – High-Potential Setup Amid Market Catch-Up
While many crypto assets have surged in the recent bullish wave, AVAX appears to have been left behind — and that could present a high-reward opportunity ahead.
From both a fundamental and on-chain perspective, this project shows promising signs, especially with notable activity among whale wallets. I believe AVAX has the potential for a strong long-term rally — but there’s one critical condition to watch.
Price has recently reacted to a key custom demand zone. However, for confirmation of buy-side strength, we need to see a clean breakout and daily close above the ~$28 level. If that breakout is confirmed, I’ll be looking to accumulate for a long-term hold, with a target of $65 — and possibly up to $100 if momentum continues.
That said, risk management remains my top priority. I’ll allocate no more than 3–4% of my total portfolio to this position.
Keep an eye on the $28 breakout. If the trade is triggered, I’ll provide updates here.
🔁 This analysis will be updated whenever necessary.
Disclaimer: This is not financial advice. Just my personal opinion.
ETH: Buyers Show Their HandETH on the 4H
The Fed noise is gone, now it’s just pure market intent.
Price wicked below the 0.236 Fib, but buyers stepped in fast, showing strength at that level.
A small bullish divergence is forming on the RSI. If ETH holds above the Fib, that signal could gain momentum.
Always take profits and manage risk.
Interaction is welcome.
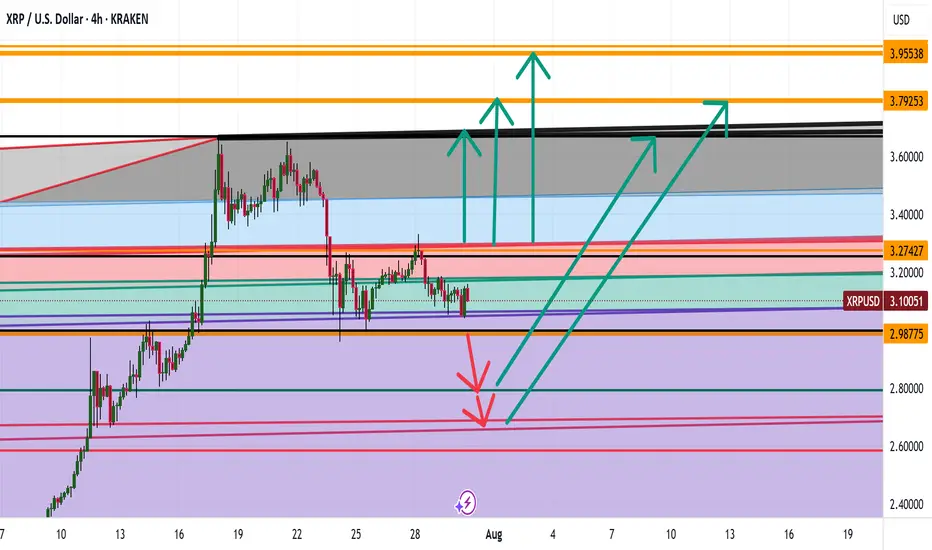
XRP WHERE ARE WE HEADED ? LEVELS TO LOOKOUT FORHey trading fam
So XRP is a fun one but based on BTC correcting and what we are seeing there are a couple thesis's that we currently have for it
Thesis 1: We break south from 2.98 lows: Levels to look out for:
2.80
2.70
2.68
Thesis 2: We break the highs of 3.29: Levels to look out for:
3.65
3.79
3.99
Trade Smarter Live Better
Kris
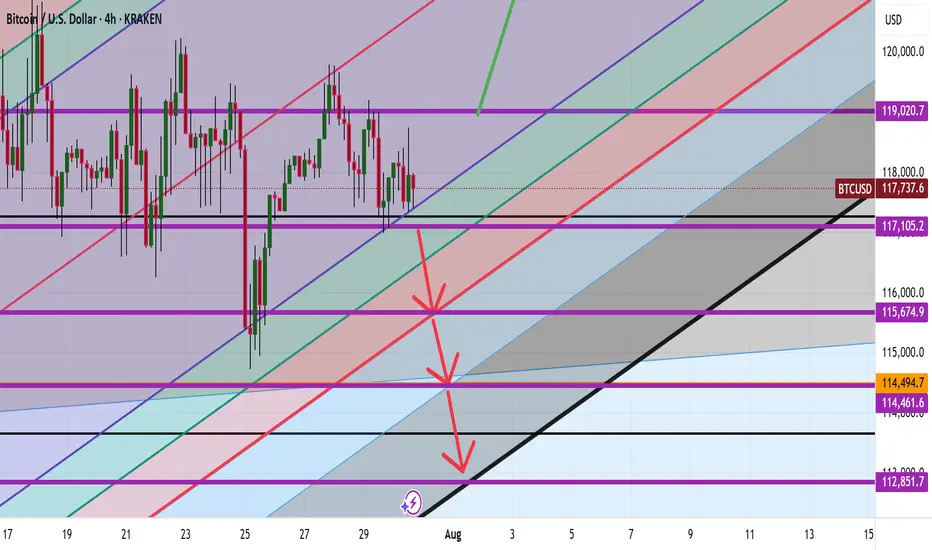
Bitcoin Are We Heading to 140K or 80K ??? Here is the Analysis Based on what is happening here is what we currently see with Bitcoin
Idea 1: If we can break 119K then here are the following levels Bitcoin can go to :
122K
126K
135K
140K
Idea 2: If we continue and break further bearish here are the levels BTC can go to
115,600
114,500
112,800
If we go below this level then a larger correction thesis would point us with a deeper bearish level
Happy Trading
Trade Smarter Live Better
Mindbloome Exchange
Kris
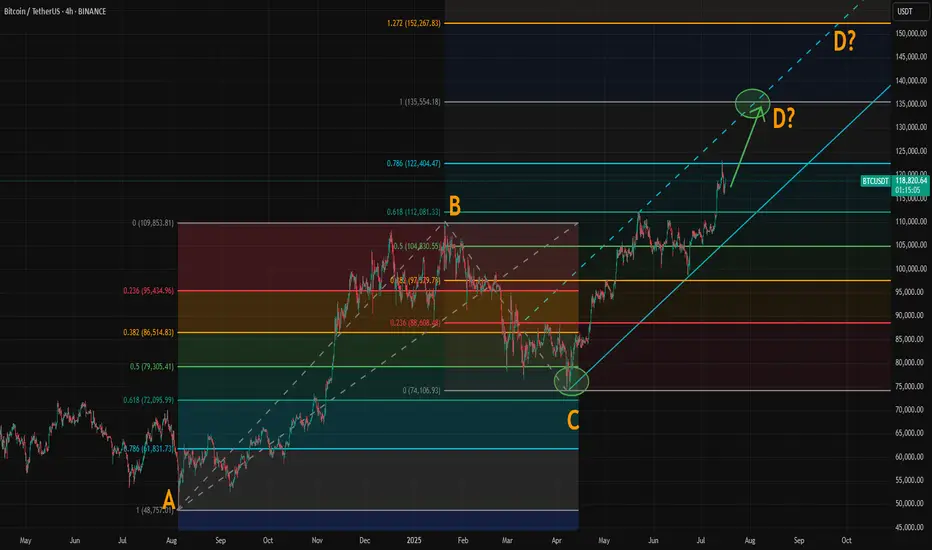
Where Could Bitcoin Make Its Cycle Top? Model and ABCD AlignedWith the breakout above resistance around 110,000, Bitcoin’s rally appears to be back on track. If you've been following our crypto analysis, either here or on our website, you’ll know our target range for this bull cycle is between 135,000 and 150,000, with the top of the range possibly extending further depending on the strength of the final wave.
Now, a possible ABCD pattern is forming, with point D potentially landing at either 135,000 or 150,000. A coincidence? Maybe, maybe not.
How Did We Arrive at the 135K–150K Target?
We based this range on historical halving cycle returns:
Halving Year - Return to Cycle Top
2012 - 9,076%
2016 - 2,122% (↓ 4.27x)
2020 - 541% (↓ 3.92x)
Two things stand out:
Each cycle has shown diminishing returns.
The rate of decline appears roughly consistent, dropping by around 4x each time—but slightly less with each cycle.
So depending on the multiplier used:
If returns fall by 4.27x again → target: 135K
If reduced by 4x → target: 140K
If reduced by 3.92x → target: 142K
If the rate of reduction itself slows (difference of 0.35 between 4.27 and 3.92) → target: 150K
While the sample size is too small, we believe the model holds reasonable logic with fundamental backing from various metrics.
The chart now shows a possible ABCD pattern:
If it becomes a classic AB = CD structure, point D could form near 135K.
If it becomes an extended ABCD (with CD = AB × 1.272), then point D could reach just above 150K.
These technical targets align closely with our halving model projections, increasing our confidence in the 135K–150K range as a likely top zone for this cycle.
Also, please check our earlier post for possible altseason start. A correlation between BTC/ETH and Gold/Silver might give some tips about possible Ether surge.
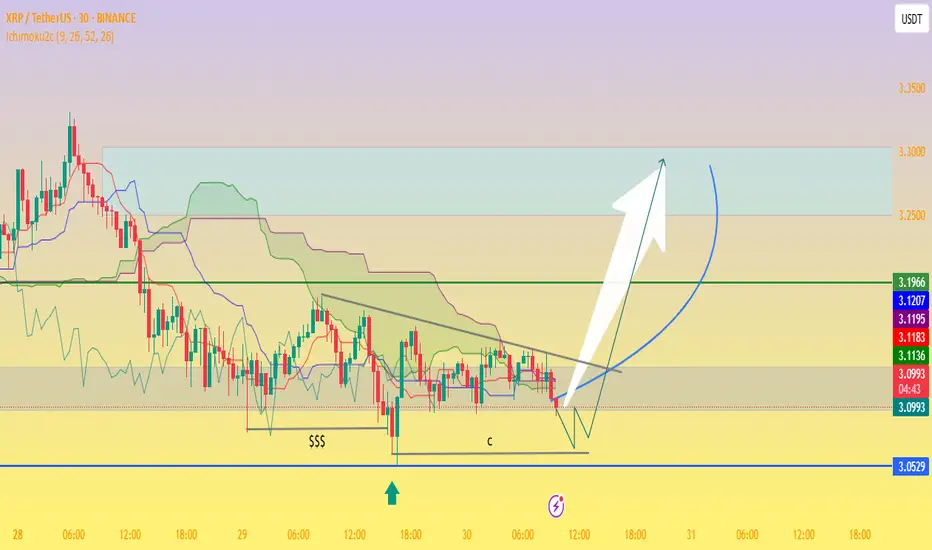
XRP/USDT Potential Reversal Zone — “Bottom Tested,Bullish Flag!📉 Chart Analysis Summary
The divided chart indicates XRP trading between a critical support zone near $3.05–$3.09 and overhead resistance around $3.19–$3.23, forming what could be a bullish pennant or descending wedge setup on the 30-minute timeframe:
Support Zone (~$3.05–$3.09):
Price retested this level multiple times (labeled as “$$$” and “c”), clearly identifying a demand zone.
Ichimoku cloud support lies nearby, adding technical relevance to the floor.
Resistance Trendline & Green Line (~$3.19–$3.23):
A descending trendline is visible, showing lower highs and building compression.
A breakout above this resistance zone is necessary to signal bullish continuation.
Projected Path:
The schematic arrow suggests a bounce off support, followed by consolidation, and then a breakout above resistance, targeting the $3.25–$3.30+ zone and potentially higher.
🔍 Context from Recent Market Commentary
Support Holding Above $3.11–$3.15: Analysts highlight strong support around $3.11–$3.15, where institutional and retail interest appears concentrated
TradingView
+13
TradingView
+13
CoinCentral
+13
.
Resistance & Consolidation at $3.30: While XRP briefly surpassed $3.30, it encountered rejection and remains rangebound. A confirmed break beyond this level could validate the bullish carry-forward
CryptoPotato
CoinDesk
.
Wave-Elliott Bull Case: Various Elliott Wave scenarios forecast targets as high as $5.25, $6.85, or even $10–$15 should Wave 5 materialize, though this depends on market strength and momentum
CoinCentral
.
✅ Trading Outlook
Bullish Scenario:
Bounce off $3.05–$3.15 support.
Break above $3.23–$3.30 resistance.
Potential upside targets:
Near term: $3.30–$3.40.
Medium term: $4.64 or $5–$6, with strong case for $6.85 if momentum and on-chain demand strengthen
CryptoPotato
+15
TECHi
+15
CoinGape
+15
.
Bearish Scenario:
Failure to hold $3.05–$3.11 risk retest toward $2.95 or lower zones ($2.30–$2.70)
TECHi
.
🧭 What to Watch
Key Level Role
$3.05–$3.11 Critical support/demand zone
$3.19–$3.23 Short‑term resistance/framing compression
~$3.30+ Confirm bullish breakout — key trigger for Wave 5 and higher targets
🧠 Overall Take
This chart is painting a classic consolidation near strong support with a visible descending upper boundary. If XRP holds the ~$3.05 zone and breaks above $3.23–$3.30 with conviction, it could initiate a bull move toward $3.40–$4.00, and potentially even $5–$6+ depending on volume and momentum.
However, breaks below $3.11 may open deeper downside risk. For many traders, this is a simple risk-reward setup: entry near the lower channel with a stop under $3.05 and initial profit targets at $3.30–$3.40.
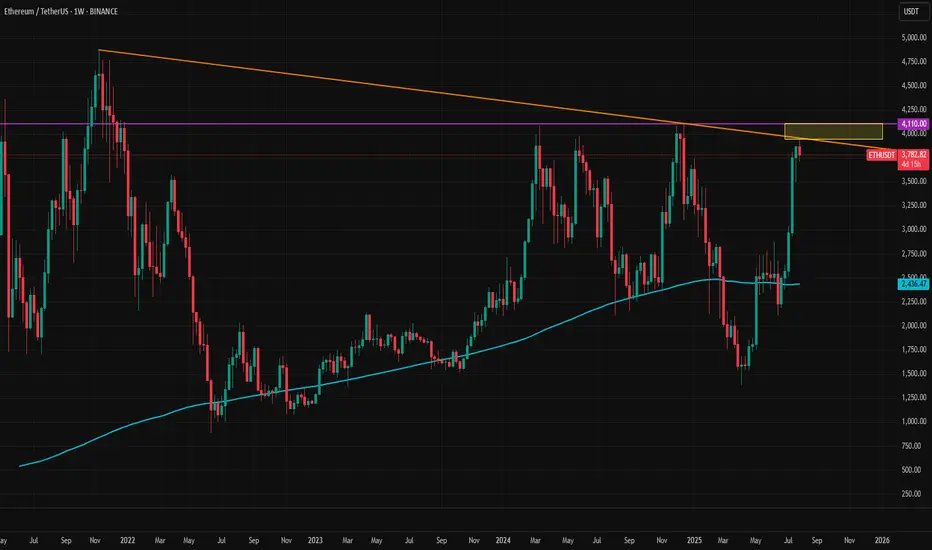
Ethereum Tests Key Long Term ResistanceEthereum continues to push higher, but a key resistance zone is causing a pause in the upward movement. Every day brings new positive developments for the crypto market, from ETF to tokenization news. This pattern reflects the typical progression of a crypto bull cycle. The latest SEC decision regarding a crypto-based ETF adds to the bullish backdrop.
However, a rising dollar index and a slowing momentum of U.S. stock market are having a short-term negative impact. Another reason for the current slowdown is the presence of massive resistance. The long-term trendline from the 2021 top, combined with the horizontal 4100 level, has formed a major resistance zone for Ether.
In the short term, ETHUSD may have formed another flag pattern. If it breaks to the upside, a retest of the 4100 resistance is possible. Today, dovishness level of Powell and the number of dissents in the rate-hold decision could significantly influence the price action.