XRP Bullish, The Retrace is Over! Aim HighWhat we need to consider here is the size and duration of each move.
The rise from 7-April through 12-May amounts to 64%.
The retrace from 12-May to present week amounts to 24%.
» So the retrace is more than a third part the size of the advance.
The rise lasted 6 weeks.
The retrace so far has 3 weeks.
» So the retrace is half the length of the rise.
Both these readings are super standard for a bull market. A retrace can easily end this week or early next week followed by 2-3 months of growth. Within this new wave of growth, there will be other retraces but a correction only comes at the end of the main wave. After the correction comes another advance and then a bear market.
Ok. We have a higher low and the chart is pointing up.
After three weeks of bearish action there is no sellers pressure, trading volume is really low.
The bears have no steam, no force, no momentum; the bears are gone.
Knowing this, we can aim high...
The retrace is over!
Thanks a lot for your continued support.
Namaste.
Cryptomarket

Solana Bullish, Retrace Over! Aim For $620 or $1,020 In this 2025 Cryptocurrency bull market, you should be aiming for $620 or $1,020 for Solana, $420 is the minimum.
How are you feeling today my dear friend?
I hope you are having a wonderful day.
Retraces and corrections, they can only last so long.
Solana dropped from $188 to $141 and I believe this is enough, a 24% drop (-24%).
As the retrace ends, the chart will produce a higher low and, as the higher low becomes confirmed, SOLUSDT starts a new wave of growth.
$420 is the minimum target for this bullish wave and should hit first but, you should aim higher, much higher. Crypto is showing to be many times stronger than what most people think.
Remember, the mistake we always make is not aiming too high but aiming too low. In each bull market, we tend to underestimate the market. Aim high, because we are going up.
Retraces and corrections are an opportunity to buy-in, 2nd entries, rebuy and reload.
Don't try to SHORT within a bull market, it is dangerous and not worth the risk. It is better to wait for support and go LONG. Always trade with the trend, specially if you are using leverage. Crypto is going up. Solana will now turn green.
Thank you for reading.
Namaste.

Bitcoin DAILY & 4 hour charts show possible push in 10 days ?
First of all SORRY for all the lines.
This is a working chart but they are all relevant to this post.
Main chart is DAILY and shows ua the Pennant that we appear to be printing with the descending channel inside. The diagonal line falling is the Fib Circle we recently broke through.
See how, once above the fib circle, we slid down the outside, using it as support, as we often do.
Then we hit another line of support and that created this recent push higher.
Should we continue, we will most likely go to the upper trendline, towards that circle. Circle center is around Sunday 6th.
While we are still on the daily, see that Pennant Apex...that is a Week on Sunday, the 15th.
99% of the time, PA reacts BEFORE the apex.
Should things continue, we can expect to see a rise till end of weekend, Rejection back to lower trend line and then a Rise and maybe a push Out of the pennant to new highs.....OR, and I think this is very probable, we go back to around the ATH line ( blue Dash) and Dip back down again.
It is worth remembering that we have inflation data being released in the USA next week.
People will likely wait to hear ths before making to many big moves.
The Daily MACD offers some guidence on this also
MACD nearly back on Neutral and could bounce. The Dashed line is this sunday.
MACD could continue to drop below neutral, we shall have to watch this closely.
As I mentioned, in the short term, BTC likely to reach for this circle in the 4 hour chart below.
I will admit, I expected PA to reach this point in a differnent way as posted earlier in the week, But, Hey, we still getting there..
Should we get rejected there, as I expect we will, then a revisit to 103K before a push back.
But given the inflation figures, things could get very volatile next week so CAUTION
We can see on the 4 hour MACD how we have already been rejected of Neutral once and we are heading there again
The potential to push through the neutral line exists but.......
I do expect some volatility and so we need to be aware things could change rapidly.
The inflation data is a key. Depending on if it is drooping, rising or flat, this WILL effect the situation with regard to the FED Rate decision later this month.
So, we wait, with caution and expectations
False Breakdown? BTC Eyes Rebound From Demand Zone!Bitcoin has broken below its strong rising trendline, but this move could well turn out to be a classic seller’s trap. Despite the breakdown, BTC is currently holding above the key breakout zone, which has historically triggered strong rebounds.
The price is also sitting right inside a previous "accumulated & explode" demand zone — an area where buyers have consistently stepped in. If BTC manages to hold this zone, a sharp rebound could follow, trapping late sellers and driving price higher.
However, if the support zone fails, we could see deeper downside. For now, this is a critical pivot — watch price action closely to see if bulls defend this level or if sellers gain control.
If you liked it, do comment and follow us for regular market updates.
THANK YOU

Aave Bearish, Be Aware (Do Not Buy Now, Sell or Wait)Aave grew almost 150% in 50 days. Now the market is entering a correction phase. Not a true correction only a retrace but it is almost the same.
The rising wedge is a bearish pattern. It is coupled with very low volume.
The action moved out of the rising wedge; bearish confirmed.
There is a local lower high and this points to lower before the market turns bullish again.
We keep it simple. We either wait or SHORT, but we do not buy here.
» If you are a bull, you can wait for prices to move lower to buy again or you can sell.
» If you are a bear, you can SHORT; this is an easy trade.
The market will confirm my analysis in a matter of days.
This is very easy of course.
Thank you for reading.
Stay (protect your money) safe.
Namaste.

Solana Short-Term, Already Bearish After 97% UpWhat will happen in the long-term? Before we get there, let's focus on the short-term real quick because we want to know what is happening with the market now.
The market offers endless opportunities. We need to take advantage of those, our edge. We have an edge and this edge is being able to read the chart. With this edge, we can time the market and increase our trading success.
Solana grew by 97%. This is good. Of course, some pairs grew way more while others grew less. I did mentioned that when Bitcoin grows 50%, some Altcoins can grow 300%. This is exactly what happened, this is because of the size of the projects.
Some pairs grew more but these were smaller pairs. Some pairs grew less but these were bigger. That's just the nature of things.
This 97% bu-wave can be correlated to a 300-400% bullish-wave on other pairs. This means that after a growth wave comes a correction.
SOLUSDT—two main interesting levels. Won't mention them as they are shown on the chart.
Both are likely to hit but the first high is really high probability.
This is easy. Wait for support before buying again. I say "again" because you are supposed to sell at resistance, we are assuming you sold at resistance and are ready to buy at support.
Good? We are good.
The market will continue to move down and up while long-term it produces sustained growth.
We need to adapt fast and be smart, everything can change in a day.
Keep an eye on the news, we might be in front of some major event.
Political events can change everything and cannot be predicted.
Thank you for reading.
Namaste.

Ethereum Danger Zone —Protection, Correction or Continuation?Ethereum can be seen trading below EMA55 on the 4H timeframe. The biggest volume session happened 9-May and it was red. This tells us that there is correction potential after a very strong 101.1% bullish growth wave.
There are mainly three levels to consider for the correction potential after ~100% growth. 0.382, 0.618 & 0.786 Fib. retracement levels. After the test of these levels, whichever one comes last, we can read the chart again and see if Ethereum will continue lower or produce a bullish wave.
One thing is very certain though, after strong growth, there is always a correction/retrace. This is what you are seeing now in this chart. The start of the drop. Taking action is best.
The market moves in waves and will never stop this pattern, it fluctuates. To trade, one buy lows near support; sells high when resistance hit. 100% growth is very strong for the second biggest Cryptocurrency project, the #1 Altcoin.
After a strong bullish wave there is always a correction. After the correction there can be more correction but at some point the market turns. Each chart/pair needs to be considered individually on multiple timeframes to have a better understanding as to what will happen next.
In a single day, based on the news, market conditions can always change. Stay alert!
Namaste.

Will Solana Go Lower? Yes! Only To Recover HigherI've been asked: Will Solana continue lower?
I think it is a fair question but it is also pretty hard right now to say based on the chart, there are just too many mixed signals.
For example, if we take Solana in relation to Bitcoin, it is trading daily below EMA55 and MA200, while Bitcoin is trading daily above these levels. Bitcoin hit recently a new all-time high while Solana only produced a small recovery in May.
When it comes to the chart signals, SOLUSDT produced a volume breakout on the bearish side and the support zone was completely challenged on a single candle. What's more, Solana will grow really strong later this year, so it would be normal to see as much bearish action as possible now because later we will have sustained long-term growth.
It is a coin flip, but if you ask me, it can go a bit lower before moving up. It can go lower to end up producing a higher low.
I will wait for clear reversal signals before going LONG.
I closed all my LONGs a while back, when it became clear that the market was going into correction. Now we can just wait easily and patiently until the correction unravels, after the correction comes a new wave of growth. Down and up, down and up... The market continues to cycle. Never straight down, never straight up. It moves in waves.
Namaste.

Chainlink Support Remains Intact, Short-Term Noise (10X)Notice here Chainlink on the weekly timeframe. This week wicked below our strong support on the chart marked by a blue dashed line, this level is the 0.618 Fib. retracement ratio. The baseline of the v shaped bottom and also the bottom formation of 2024.
The retrace, bearish action, so far has been going for four straight weeks. The entire rise was five weeks longs. I mentioned this previously. This means you can easily go ALL-IN on this type of chart setup, buy and hold.
The retrace can never be longer than the drop. The fact that support is holding means that Chainlink will continue growing, will resume its bullish wave. A bullish continuation.
This is a friendly reminder. I know it is hard, but this type of setup is where experts open LONG with 10X. I am not saying that you should, I just want to show you how we are attracted to and tempted to buy when the market is red. That's the time to go LONG. We sell (SHORT) when the market is green.
Thank you for reading.
Namaste.

The Trading Rookie, How I Don't Make Money Fast & Waste TimeThe bottom is set and once the bottom is in bullish momentum builds up and grows. Bullish momentum is now present on this chart coupled with really high volume. The high volume is what confirms the current move being real and strong. ICXUSDT daily.
When they are not moving nothing can move them. But when they move they move.
We have the bottom and this is good so we only need a continuation and the continuation will come. Notice that this is the same chart as other altcoins, most altcoins.
This is very simple. I just wait.
If you jump in without a plan and prices retrace tomorrow, you will desperate and fold, sell at a loss. Then just three days later ICXUSDT continues to grow. You see how that works? Three days is not a long time.
It happens that the wait can take weeks but some people are ready to earn today, today alone and today only. Here is how that mentality works.
Let's say the unexperienced trader (me) do manage to buy before prices start to grow. "Awesome, finally I got one." Chasing after the next breakout everyday. The pair goes up 10%, 20%, 30%. Then stops and retraces for a few days. The rookie manages to hold and then boom, a nice 50% jump. Total growth some 70% from entry point considering the small retrace.
At this point, the rookie finds out everything about the pair he holds and prepares to "hold long-term." The pairs keep on growing and profits now reach 100%. Instead of securing a trade, a very nice double-up, 100% profits, the rookie becomes greedy and continues to hold.
The action peaks at 120% profits. From the bottom total growth reached 320% but he didn't get the bottom of course he bought when the action was already underway. Next comes the correction and selling is still not even a possibility because remember, I will hold long-term.
Long story short, when the correction hits bottom, the rookie is ready to give up. He sells everything beat down and depressed. "Crap, I missed another bullish wave." The next day, as soon as he sells the bottom prices start to grow... And the cycle repeats.
This time, instead of buying crazy or being crazy, just trust my call.
Buy those trading at the bottom. Those that everybody ignores. I share these in my profile. Wait patiently and then the market will grow. You cannot earn 500% on a pair if it is already moving, it is impossible. The only way to earn big is by buying when prices are low. Hold strong, hold long and as the bullish cycle develops, your money grows.
Short-term trading is also do-able but requires more experience and planning. When the pair is up 20-30%, you can collect profits. This can also be done at 80-100%, it depends. It depends on your trading style, your capital, your goals... It all depends on you. How are you going to profit from this 2025 bull market bull-run?
Namaste.

TradeCityPro | Bitcoin Daily Analysis #109👋 Welcome to TradeCity Pro!
Let’s dive into the Bitcoin analysis and key crypto indicators. As usual, I’ll walk you through the futures triggers for the New York session.
⏳ 1-Hour Timeframe
In the 1-hour chart, as you can see, yesterday Bitcoin activated the short trigger at 103899 and dropped below the 101750 level. This setup gave an opportunity to open a short position—hopefully you took advantage of it.
✨ After that bearish leg, the downtrend ended and the price began to rise again, now reaching back to the 103899 level.
🔍 If the price gets rejected once from 103899 and then forms a higher low compared to 101750, we can consider a long position on subsequent attempts—if 103899 breaks. If the price breaks this level sharply, the next long triggers will be 105087 and 106586.
📉 For today's short position, we can enter on a pullback to 103899. Personally, I’ll look for a bearish trigger in lower timeframes; if confirmed, I’ll open a short. The main bearish trigger remains the break of 101750.
📊 Currently, volume favors buyers, but we’ve seen divergence during this bullish leg, and volume increased on the last bearish move. So, I still see a higher probability of the market turning bearish rather than bullish.
👑 BTC.D Analysis
Looking at Bitcoin dominance, yesterday it made an upward move to 64.67 after breaking through 64.23. This 64.67 level is a strong resistance, and as shown, the dominance got rejected there.
💫 If this rejection is confirmed, there's a high chance of a retracement back to 64.23. In that case, if the market continues to drop, Bitcoin will likely be a better short than altcoins.
☘️ However, if 64.67 breaks, dominance could initiate another bullish wave.
📅 Total2 Analysis
As for Total2, after activating the 1.16 and 1.13 triggers, it dropped to the 1.1 zone and is now making a pullback to its previous support—similar to Bitcoin.
💥 For a long position, we’ll need a Dow Theory confirmation. For a short, we can wait for a pullback to 1.13 and look for a bearish confirmation to enter.
📅 USDT.D Analysis
Now onto Tether dominance: yesterday, after breaking 4.79, it moved up to 4.98. Following that, it reversed and is now back down to 4.79.
🔑 If 4.79 breaks, Tether dominance could drop further to 4.70 and 4.64. But if it holds and finds support there, another bullish leg may begin.
❌ Disclaimer ❌
Trading futures is highly risky and dangerous. If you're not an expert, these triggers may not be suitable for you. You should first learn risk and capital management. You can also use the educational content from this channel.
Finally, these triggers reflect my personal opinions on price action, and the market may move completely against this analysis. So, do your own research before opening any position.

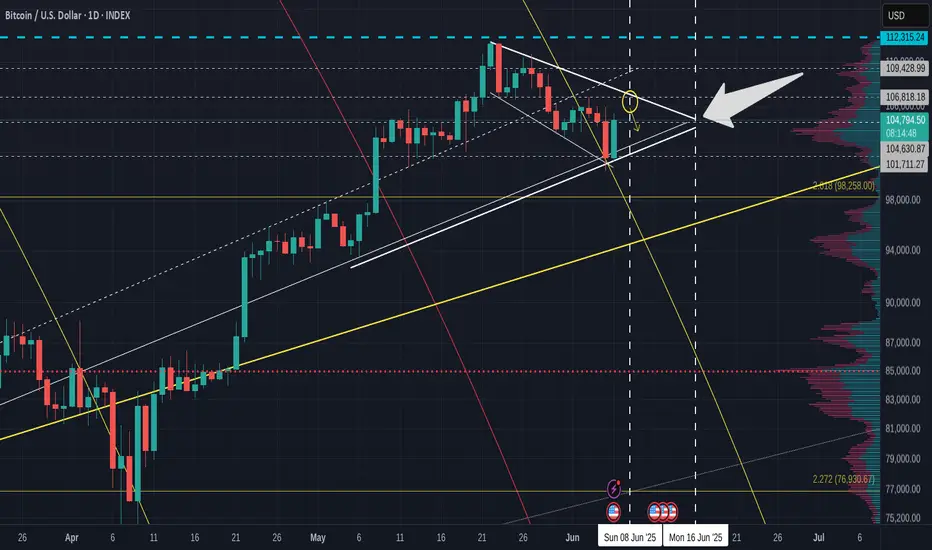
Quick BITCOIN update using old Fractal chart - a small red June
Bitcoin appears to be taking a rest when it is strictly not required.
We are heading towards the 2nd dashed arrow, which as I pointed out months ago is a very possible and more realistic path for Bitcoin to take this cycle.
We have left the 2013 - 2017 Fractal and yet are likely to follow the idea of moving higher to a new ATH from this level off the Fractal.
PA entered that circle I drew back in Feb and is still in it right now, as we can see in the chart below
We can also see how PA has bounced off the 50 SMA on this daily chart.
This does NOT guarantee a continued move higher but it may offer some levels of support.
Should this fail, we do have various levels of support down to around 94K
I will refer back to a previous post and mention that to some extents, I am expecting a RED June. This does not need to be a Big candle, just 1 usd less than the open price wil create that.
104648 was the open price, so, we can easily stay above 100K and create that red candle.
Why do we want a red candle..?
Because, to put it simply, statistically, we have a better chance of continued monthly Green candles after a red june this time
I will attach the chart below so you can read about this in more detail.
This may or may not be good for ALTS>.... but I do not have many now.....just my preference

1️⃣ Bitcoin. Analysis of US Treasury DocumentsHello, crypto enthusiasts, decentralization adepts, and those who still believe in "financial freedom". Get ready, because what you are about to read might shatter your template, but it will clarify where your beloved market is heading.
In June 2016, the blockchain world witnessed an unprecedented event – the hacking of The DAO , which called into question the fundamental principles of decentralization and smart contract security. This incident not only led to Ethereum's historic hard fork but also became a powerful impetus for the development of safer and more reliable solutions in DeFi and DAOs. This article is dedicated to that event.
Now, we won't be talking here about "future technology," "blockchain revolution," or how your shitcoin will fly to the moon. No. First, we'll talk about how the "system" is preparing to digest and rebuild the crypto market to suit its needs, using everything from Forbes covers to global economic crises. Here, the author shares not just predictions, but presents in an accessible form a broad understanding of the interconnected global processes, where crypto is just one 🧩 puzzle piece of the overall picture of the future digital "brave new world" of cyberpunk . This scenario is not someone's wishful thinking, but the most plausible course of events. You may like it, you may not, it doesn't matter; what matters is what you will do with this information next.
The article will be divided into three separate ideas:
1️⃣ Main Idea: Analysis of US Treasury Documents
2️⃣ Who's Next? Or: Operation "Saving Private Saylor"
3️⃣ Altcoins and the US Crypto Reserve
Get ready, the article will intentionally be long to immediately filter out all "clip-thinking" gamblers. In general, everything as you love it, written with love in a rebellious style, with a 🤏"touch" of cynicism, sarcasm, and tragicomedy. If you are interested in continuing any of the topics, follow the links (which will be below), and then return to this root idea. So, let's go!
1️⃣ Main Idea: Bitcoin and Crypto. Analysis of US Treasury Documents
For a long time, the world of cryptocurrencies was the "Wild West" – a place where anonymity, quick money, and the dream of complete independence from traditional banks and governments reigned. Bitcoin, with its idea of "digital gold," became a symbol of this freedom, promising refuge from inflation and manipulation by fiat currencies. But, as they say, the "Wild West" doesn't stay wild for long, especially when trillions of dollars and a threat to global financial stability – which is, of course, always "national" – loom on the horizon.
It's no longer a secret that US authorities and major financial institutions are carefully studying and analyzing the digital asset market. In this article, we will uncover a multi-step scenario where the "invisible hand of the market" is actually controlled by quite visible structures. We will show how a series of seemingly independent events – from the media's "Forbes curse" to an inevitable financial crisis – perfectly fits into a plan to create a US "crypto-reserve" and fully integrate (read: subjugate) digital assets into the traditional, centralized financial system.
Prepare for the harsh truth. This is not a story about crypto saving the world from fiat slavery. This is a story about how the fiat system, when faced with a challenge, adapts and absorbs the threat, using its own ideas. And, unfortunately for some, it will do so at the expense of those who believed in unlimited growth. Let's dive into the details of this cunning plan, where Michael Saylor is not just an investor, but a key figure in this spectacle of life unfolding before our eyes.
📜 Our "sacred scriptures" – this is an analysis of three crucial documents published on the US Treasury website:
1. The Future of Money and Payments (FM&P, September 2022): This is like Grandpa's first tentative step into using a smartphone. "Oh, what's this interesting thing you have here? Fast? Cheap? And here we old folks are still rustling with checks..."
2. Digital Assets and the Treasury Market (DA&TM, October 2024): Here Grandpa already figured out that the smartphone can count money. "So, these 'stablecoins' of yours – they're buying our bonds? That's even better than the Chinese!"
3. Digital Money (DM, April 2025): And here Grandpa is confidently tapping the screen and even seems to be trying to take a selfie. "Alright, stablecoins are our new MMFs, and if anything happens – I'll arrange a 'run' for you, like in 2008! And your Bitcoin is just 'digital gold' for nervous investors who run from our inflation to it, and then back to us for a hedge!"
Forget about conspiracy theories – they're writing it themselves! Documents like those presented by the Treasury Borrowing Advisory Committee (TBAC) clearly outline their views on "Digital Assets" and "Digital Money." In these reports, Bitcoin is no longer a "speculative toy," but a "store of value, aka 'digital gold' in the decentralized world of DeFi". And if it's "gold," then, by their logic, it should belong to the state, shouldn't it? Prepare yourselves, because today we're going to look under the hood of how serious gentlemen from the American financial elite suddenly "fell in love" with digital assets.
❓ So, what are these US financial authorities really trying to achieve? By studying and analyzing this open information, one can understand the scope and plans of the US financial elites. The main aspects extracted from those three documents are highlighted below:
1. The dollar is the world's drug, and we will control the dose, even in digital form!
Stablecoins? They're our "digital servants"! In DA&TM and DM, they are no longer just "digital assets," but "ubiquitous cash on the blockchain". And most importantly – these naive crypto-enthusiasts (without even knowing it) are buying short-term US Treasury bonds as collateral! This is a goldmine! We're already printing debt, and now the crypto market is financing it. "Thank you for using our services to ensure your unstable stability!"
"Wildcat banknotes" vs. "real dollar": DM doesn't hesitate to draw direct historical parallels. "Remember those 'wildcat banknotes' in the 1800s? Poorly collateralized, constant runs... And then the government came and said: 'Want reliability? Here's our dollar!'" It's the same story with stablecoins: "Your USDT and USDC are nice, of course, but only if they are 100% backed by our T-bills. Otherwise – no offense, but we remember the Terra/Luna story (and can repeat it if necessary), and you certainly don't need such happiness!"
"Your 'stable' coins must be our stable coins!" DM explicitly states: "Stablecoins will be regulated as narrow banks or money market funds!" This means: no more shenanigans with 'algorithmic' wonder-coins, like Terra! Now you will be backed only by highly liquid, risk-free assets... guess which ones? That's right, our own, American Treasury bonds ! Hello, Tether, you are now officially our best client!
"Our CBDC is not 'Bitcoin for the people,' but a 'prison blockchain' for control!" FM&P cautiously hints at CBDC as a "safe" alternative. But let's be honest: they don't just want a "convenient" digital currency. They want complete control. To know where every cent went, so that no Uncle Vasya can conduct a suspicious transaction without oversight. It's as if the NSA released its own crypto in 2008 – super-duper secure and decentralized, but every sneeze you make on the blockchain is recorded and tracked.
2. "We're for innovation! But only if it's on our platform, under our control, and preferably – on a private blockchain where you won't stick your curious nose!"
"Blockchain is cool! But not the one you're on!" DA&TM clearly states: "Public, permissionless blockchains? Oh, no, that's a nightmare! Scalability is lame, security is questionable, and let's not even talk about money laundering! We don't want every John Doe to be able to anonymously transfer millions. We need 'private and permissioned blockchains' where we know who's doing what, and can control everything."
"Tokenization is not a revolution, it's just a new Word for old documents!" Yes, they talk about "increasing efficiency" and "atomic settlements". But, in essence, they want to take their old, dusty Treasury bonds, slap a "token" on them and say: "Look, we're trendy too! Now you can 'instantly' exchange our bonds!" It's like buying a new iPhone but installing Windows 95 on it. Looks trendy, but works old-school. Tokenization of Treasury bonds is not for your pet hamster to buy a share in a T-bill, it's for "atomic settlements" and "improved collateral management" between large banks and institutions. If anything gets faster, it's their corporate ⚙️ gears, not your small transactions.
3. "Financial stability means your money is with us, not on some DeFi protocol!"
"We remember 2008 and 2020! And your stablecoins are MMFs on steroids!" DM very clearly shows that "runs" on stablecoins are exactly the same as "runs" on money market funds during a crisis. And the consequences? "Fire sales" of Treasury bonds, falling prices, chaos. "So, folks, if you want to be 'stable,' be like our MMFs – backed only by our government's risk-free securities!"
"Banks are sacred, and don't encroach on their deposits!" DM expresses unambiguous concern that these "interest-bearing stablecoins" could draw deposits away from banks. And this, begging your pardon, "could negatively affect banks' ability to attract deposits and make loans". That is, on bank profits. And we cannot allow that, because banks are the pillars of our system!
Thus, the "US financial authorities" are not just a group of boring accountants. They are strategists who play the long game. They cannot (or do not want to) stop the crypto revolution, but they can direct it into a channel that is beneficial to them. They want to:
"Regulate" stablecoins so they are simply a digital embodiment of their Treasury bonds.
Use blockchain for their own infrastructure, but with such centralization and control that Satoshi Nakamoto would turn over in their anonymous grave.
Ultimately, issue their own "digital dollar" (CBDC), which will be both "innovative" (in words) and "controlled" (in practice), so that no "private digital currency" infringes on their monopoly.
This is not about "freedom," it's about "controlled dominance". They are not chasing the crypto train – they are buying it, repainting it in the colors of the American flag, renaming it the "Financial Stability Express," and selling tickets that you will buy with your own, strictly regulated, stablecoins. Our three documents are not just bureaucratic papers. They are, in essence, a strategic plan to "tame the beast" and redirect its energy in the right direction. Or, as some official would say, "optimization of national interests". And in our language – "how not to lose global financial hegemony while these hipsters play with their numbers".
In the end, the US financial authorities are engaged in a kind of "digital colonialism". They cannot ignore blockchain and crypto, because it's no longer just "internet money for geeks," but a multi-trillion dollar market. Therefore, their goal is not to fight windmills, but to build their own, much more efficient windmills on the wind of digital innovations. And at the same time, ensure that all these windmills grind flour for their loaf of bread, that is, for the US dollar.
They want you to continue using the dollar, even if it's "digital".
They want your "stable" assets to generate income for them by buying their bonds. They want any "effective" blockchain solutions to be under their watchful eye, so that no one escapes into the "wild, unregulated" world of anonymity and decentralization. This is not about "freedom of financial innovation," it's about "innovation under strict supervision". Or, if you prefer, "controlled digital expansion". After all, what's the point of new technology if it doesn't serve the interests of good old hegemony?
🔍 Let's examine in more detail what is stated in the document: "Digital Money" (DM, April 2025). Or "The American Pump: Why Washington Wants 2 Trillion of Your 'Stablecoins' (and what they'll get for it)"
Imagine, our bureaucratic friends from TBAC (a club of clever people who whisper with the US Treasury) held a secret meeting in April 2025. And what did they see there? A prophecy! 💥 A prophecy that the stablecoin market, currently hovering around $234 billion, will soar to $2 trillion by 2028! That's an 8.5x increase, if you can count! A typical crypto bro would say: "Whoa, pump! We're making x's!" But a serious uncle from the Treasury would say: "Excellent structural demand for our Treasury bonds! Finally, these 'digital monies' are working for us!" So, how is the US government going to arrange this "pump" without admitting it?
📝 The "Digital Milking Machine" Scenario (or why your stablecoin is their new wallet):
"Our Dollar – Your Problem!"
▫️ "Stablecoins? They're our best friends!" At first, they frowned, saying, "anonymous, decentralized, risky." But then they saw that 99% of stablecoins are just digital dollars, pegged to their own paper! And they are used as "cash on the blockchain," meaning people in the crypto world are already actively using them. "Aha," they thought, "so the world has already accepted our dollar in digital form, even without our direct involvement. Excellent! Now we need to ride this and monetize it."
▫️ "Hey, stablecoins, buy more of our bonds!" The cherry on top from DA&TM: "Stablecoins hold $120 billion in Treasury bonds!" And if the market grows to $2 trillion, imagine: how much will that be in our precious, ever-deficient T-bills? It's just a celebration! "Please, keep issuing your stablecoins, the more the better! And we will give you paper with interest. And you, naive ones, will think it's 'collateral,' and we will think it's 'a new source of financing our debt'!"
"Regulation is Love (for our interests)!"
▫️ "We will regulate you to death... so you can be 'stable'!" TBAC explicitly states: "If history teaches anything, stablecoins must be regulated like 'narrow banks' or 'money market funds'". This is not for your safety, folks, it's for theirs. "We don't want you playing with 'algorithmic stability' and crashing markets like Terra/Luna. No, no, now you will walk the line, backing every dollar of yours with OUR Treasury bonds. Because only that is 'real' risk-free collateral, right?"
▫️ "But your 'interest-bearing' stablecoins... we don't really like them!" Why? Because they can "compete with bank deposits" and "undermine banks' ability to make loans". That is, if your stablecoins start earning you real interest, you'll run from the banks! And that's an assault on the sacred. "Propaganda for 'Tokenization' is a new 'quantum leap' (for our national debt)!"
▫️ "Tokenization? What's that? Oh, it's just our new way to sell bonds!" FM&P and DA&TM talk about "increasing efficiency of clearing and settlement" through tokenization. Sounds boring, but the meaning is this: "We want to make our national debt even more liquid and accessible. If these crypto-guys love tokens so much, then let our bonds be tokens too! And then, who knows, retail might follow, through these 'tokenized Treasury bond funds'!"
▫️ "Forget 'decentralization' for bonds, that's only for 'us'!" DA&TM clearly states: "Public blockchains are garbage for Treasury bonds". They need "private, permissioned blockchains". This means: "Blockchain is cool, but only if it's controlled by us, our banks, and you sit there like mice and don't make a peep. No anonymous movements!"
So yes, the US government will indeed "pump" the crypto market, but not in the way you think. It won't buy Bitcoin or Ethereum (at least not openly). It will "pump" the stablecoin market because it's:
A brilliant way to finance its own national debt by attracting capital from the crypto world.
An ideal tool to expand the global influence of the dollar, making it convenient "digital cash" in decentralized ecosystems, but under its control.
A method of "taming" the wild crypto-west, forcing it to play by its rules of financial stability, lest any glitch should harm their "traditional" system.
It's as if a casino decided to "pump" its players by saying: "We'll let you play with chips that are backed by our own debts. The more chips you make, the more of our debts you buy! And if your chips crash, that's your problem, because we warned you it was 'risky'!" So, yes, expect stablecoin capitalization to grow by at least $2 trillion by 2028.
🎮 All right, if you want to delve deeper into these documents yourself, follow the links above, and we'll move on. Now let's play a guessing game with you. The task: by elimination, figure out who on this list are "their guys" for the US government, who is a "stranger," and who cannot be touched, and who can or even should (from the US perspective) be "taken advantage of"?
📊 Largest Known BTC Holders (as of May 2025):
1. US Government: ~200,000 BTC (confiscated during investigations)
2. Satoshi Nakamoto: ~1.1 million BTC (not moved since mining)
3. BlackRock (iShares Bitcoin Trust - IBIT): ~650,000 BTC
4. Fidelity (Fidelity Wise Origin Bitcoin Fund - FBTC): >200,000 BTC
5. MicroStrategy (MSTR): ~576,000 BTC (as of May 2025)
6. Grayscale Bitcoin Trust (GBTC): ~187,000 BTC (outflows occurring)
7. Coinbase (reserves): >600,000 BTC (exchange balance, including client funds)
8. Binance (reserves): >500,000 BTC (exchange balance, including client funds)
9. Bitfinex (reserves): ~400,000 BTC (exchange balance, including client funds)
10. Gemini (reserves): >127,000 BTC (balance including client funds)
11. Tether (USDT, own reserves): ~100,000 BTC (in addition to fiat reserves)
🧮 Who are "their guys" and who is a "stranger"? Distribution of influence in the crypto market. In the grand game for control over the future financial landscape, especially in the digital asset sphere, the US government and its affiliated traditional financial institutions act strategically. Their goal is not to destroy cryptocurrencies, but to integrate and subjugate them on their own terms , creating a "National Crypto Reserve" and a new, controlled digital financial infrastructure. This process implies a clear distinction: who is "one of us" (a useful or tamed element of the system), and who is a "target" (a source of assets or a potential object for threat elimination). There are also unique cases that fall outside this dichotomy. Let's analyze the list of the largest BTC holders as of May 2025 from this perspective:
"Their Guys" (fully integrated, tamed, or cooperating): These players are already deeply embedded in the traditional US financial system or are actively striving for full regulatory compatibility. For the US government, they are either direct partners or "tamed" assets that contribute to achieving strategic goals. They are not touched, but used as tools or components.
1. US Government (~200,000 BTC): Status: absolute "their guy" and main player. They are the ones who will "take advantage" of others. They are the ones who set the rules and collect dividends. Their Bitcoins are confiscated assets, a "free" replenishment of the future "National Crypto Reserve".
2. BlackRock (iShares Bitcoin Trust - IBIT: ~650,000 BTC) and Fidelity (Fidelity Wise Origin Bitcoin Fund - FBTC: >200,000 BTC): Status: key institutional "their guys" from traditional finance. These are Wall Street giants who have received SEC approval for their spot Bitcoin ETFs. Their massive BTC accumulations are not speculation, but a strategic integration of cryptocurrencies into the existing system. They act as main gateways for institutional capital, channeling it into a regulated stream. They are actively involved in shaping the new financial architecture, for example, BlackRock with the BUIDL fund for tokenized Treasury bonds, which fully aligns with the TBAC vision. They cannot be touched; they are part of the control mechanism.
3. Grayscale Bitcoin Trust (GBTC: ~187,000 BTC): Status: tamed "their guy." After the trust's conversion to an ETF and massive outflows, GBTC came under direct SEC control. Despite asset losses, the remaining assets are now in a regulated product. Grayscale was forced to fully adapt to the system's rules. There's no need to touch it – it's already in the system.
4. Coinbase (reserves: >600,000 BTC): Status: key "their guy" in the US crypto market. This is the largest regulated American crypto exchange that actively cooperates with authorities. Coinbase serves as the "main entrance" for retail and institutional investors in the US. Its transparency and compliance make it indispensable for the system as a tool for data collection and control over fund movements. It will not be touched, but will be used as part of the regulated infrastructure.
5. Tether (USDT, own reserves: ~100,000 BTC): Status: "tamed" and useful "their guy." Tether, being the largest holder of US Treasury bonds, is already deeply integrated into the financial system. The system does not seek to destroy it, but to fully subjugate it to regulatory control. For the government, it is a source of demand for their debt (Treasury bonds) and a potential tool for controlling digital flows. It will be "regulated" in the sense of "finally brought to heel," so that it becomes absolutely transparent and controllable, essentially a private digital dollar under supervision. (See DA&TM pp. 4, 17, 25).
6. Bitfinex (reserves: ~400,000 BTC): Status: "their guy" through affiliation with Tether. Since Tether is already recognized as "their guy" and is under regulatory pressure, its affiliated structures, such as Bitfinex, also automatically fall under this logic. If Tether is "tamed," then Bitfinex, as part of the same ecosystem and holding significant assets, will also be forced to comply with the same standards of transparency and compliance. This is not a "stranger" in the full sense, but rather a "younger brother" controlled through the elder.
7. Binance (reserves: >500,000 BTC): Status: already "regulated." Lawsuits, multi-billion dollar fines, and CZ's removal are classic examples of how the system forced the largest global, but previously less regulated, player into submission. Now Binance, although still a powerful force, is forced to operate within the given rules. It no longer needs to be "touched" in the same sense – it has been "tamed" and included in the sphere of influence.
8. Gemini (reserves: >127,000 BTC): Status: "their guy," but with caveats. Gemini is an American exchange actively striving for compliance. Despite past regulatory difficulties (e.g., with the Earn program), it remains part of the regulated American crypto infrastructure. It will be used to control flows, but also kept under constant supervision.
Neutral Player (not participating in the game): This anonymous entity is outside the system of control and is neither "their guy" nor a "target" in the traditional sense. Satoshi Nakamoto (~1.1 million BTC): Status: Neutral, not participating in the game, and untouchable. These Bitcoins remain untouched and symbolize true decentralization and uncontrollability. The US government cannot touch them , unless "Satoshi" himself decides to move funds to a regulated platform or an incredible cryptographic vulnerability is found.
So, the only major target that can be 'taken advantage of' is, 🥁 drumroll: Micro Strategy (MSTR: ~576,000 BTC) Status: 🎯 Main Target. Although Michael Saylor is a prominent Bitcoin supporter, and Micro Strategy is a public company, their aggressive accumulation strategy (often through debt) makes them extremely vulnerable to the price of Bitcoin. In the event of a serious market crash, Micro Strategy will face enormous pressure (margin calls, debt obligations). In such a scenario, their significant assets could become targets for forced liquidation or acquisition by organizations with deeper pockets and government backing. Their "high-beta" nature (as described in TBAC documents) makes them vulnerable.
For the continuation of Michael's story, see the separately published idea:
2️⃣ Operation: "Saving Private Saylor." Or how Uncle Sam "nationalizes" Bitcoin while Michael is busy with micro-strategies.
🎼 "History doesn't repeat itself, but it often rhymes" – and for Michael Saylor, this rhyme echoes with unsettling persistence.
In 2000, he, the shining dot-com hero, faced the prose of numbers when the Securities and Exchange Commission (SEC) knocked on his door . The overstatement of revenue by MarginCallStrategy MicroStrategy and non-compliance with "Generally Accepted Accounting Principles" (GAAP) – all this led to a restatement of financial results and a stock collapse of -60% in a day, and then almost -90% in a few weeks. But this episode was just the first line in a long poem.
Two decades later, Michael Saylor re-emerged on the scene, now as a prophet of "digital gold," transforming his company into the largest corporate holder of Bitcoin. His passionate belief in decentralization and the unique nature of BTC is striking. He claims that Bitcoin is a hedge against inflation, an eternal store of value, immune to the manipulations of the fiat system. But the louder his sermons about Bitcoin, the more they rhyme with the past: excessive confidence, public bravado, and disregard for fundamental risks.
History does not repeat itself literally, but it rhymes. Michael Saylor in 2000 and Michael Saylor today are two lines of the same poem, where the final chord will belong not to "digital gold" in its pristine, decentralized form, but to "tokenized government bonds" and CBDCs, which will become the foundation of a new, controlled financial order. Bitcoin, of course, will survive another -70% collapse, but in a completely new role that better suits Washington's needs than the dreams of crypto-anarchists.
Let's delve deeper. To avoid overloading the article, it has been decided to publish the section on altcoins and the scenario for replenishing the US "Crypto-Reserve" separately from the main root idea. If you are interested in learning how the government intends to make the US the "crypto capital of the world," and the fate of altcoins with a forecast for 2025-2028, follow the link:
3️⃣ Altcoins and the US "Crypto-Reserve"
Excellent, let's continue. Now we are on the home stretch! Connecting all the dots: the Forbes curse, the inevitable crash, the insidious plans of the US government, and finally, the final mega-pump.
Washington's Grand Crypto-Gambit: How they will crash the market to orchestrate a 'Final Pump' (and why they need your altcoins at dirt-cheap prices for this)
My previously published basic crypto forecast is not just relevant – it is becoming even more ominously realistic; it's just (as usual) slightly shifted in time. Because the "big guys" in Washington are not some Elon Musks who pump with tweets. They work on a schedule, and their schedule is called "global economic recession," which the Democrats have stubbornly delayed until Trump's presidency since 2023.
◻️ Part 1: "Pre-Pump Cleanse" – Why a crash is coming (and why Bitcoin won't hold up either) 2025-2026.
While you rejoice that Bitcoin is demonstrating "phenomenal resilience," trading around $75,000 - $100,000 (thanks to Bitcoin ETFs and migrating Chinese, at least some demand!), I'll tell you straight - it's an illusion. It's like the last dance before the fall.
▫️Bitcoin – king, but on a shaky throne: Yes, demand from ETFs and "fleeing capital" from China have kept the price around $100k for the last three quarters. But, let me remind you what TBAC said (and that, by the way, is the voice of the Treasury!): Bitcoin is a "high-beta asset." This means it amplifies market movements. If the stock market sneezes pretty hard (down -30-40%), Bitcoin will catch pneumonia (down -60-70%).
▫️Alts – it's already a "bloodbath": While Bitcoin is setting its historical highs (essentially drawn on the enthusiasm of new funds), alts are already howling in pain. The altcoin index CRYPTOCAP:OTHERS is already -40% lower since the beginning of the year, with its capitalization falling from $450 billion to $260 billion.
The Impending (US-Managed) Armageddon in the Markets:
"Debt market? What's that?" The absence of buyers in the debt market (hello, USA, Japan, EU!) – this is not just a "small problem," it's a systemic crack. Who will finance all these government expenditures if no one wants to buy bonds?
"Liquidity? What liquidity?" The liquidity problems in the global "Eurodollar" financial system are no longer a joke. When the world's largest financial arteries become clogged, blood stops flowing.
US stock market (SP500 and NDQ100) crash of -30-50% from their ATH in 2025. This is not just a "scare," it's a controlled demolition of an old building to construct a new one. And in the still "very small cryptocurrency market" (by traditional market standards, of course), this will result in a further -60-80% drop from current levels!
Buckle up, Bitcoin to $30,000 - $50,000! Yes, my forecast is harsh, but realistic. Before a new phase of growth for the entire cryptocurrency market (yes, not just Bitcoin, but your beloved altcoins too), we are obliged to see a final sell-off.
◻️ Part 2: "Final Pump: When Uncle Sam Becomes Your Crypto-Manager" (2026-2028)
This is where it gets really interesting. After the market is flushed out, "weak hands" are eliminated, and Michael Saylor's (and many others') "digital gold" is "nationalized" at a bargain price, they will enter the stage – the US authorities.
"Our dollar – your digital wallet!" Remember TBAC's forecasts that the stablecoin market will grow to $2 trillion by 2028? This is no coincidence. It's a plan. They don't want to "pump" Bitcoin; they want to "pump" their stablecoins, which, of course, will be 100% backed by their own Treasury bonds. This is the ideal mechanism for financing their bottomless debt!
"Regulation? No, it's controlled growth!" They will "regulate" the market to make it safe... for them. Stablecoins will become "narrow banks," and private blockchains – "permissioned." This means: "Use our 'digital currency' (stablecoins), buy our bonds with them, and everything will be fine. And if you want 'innovations,' only on our centralized infrastructure!"
"Tokenization of all America": When traditional markets are in ruins, they will announce a "new era" – the era of tokenization! Tokenized Treasury bonds (convenient for buying with your stablecoins!), tokenized stocks (after the crash, they will become very "attractive" for buying via blockchain!), tokenized real estate... And all this under the supervision of "reliable" centralized structures.
"Final explosive growth" (under control): It is precisely this controlled growth, this inflow of liquidity through stablecoins and the tokenization of traditional assets, provoked and financed by the US authorities, that will be the "final explosive growth" for the entire crypto market in 2027-2028. Crypto will grow not because it is "decentralized," but because it has finally been "tamed" and integrated into the global financial system, but on Big Brother's terms.
📉 Periodic Crashes – A Tool for Capital Redistribution
Many current fresh gamblers "investors" don't understand a simple thing: periodic crashes in financial markets, be it stocks or cryptocurrencies, are not a "bug" or an accident, but a built-in "feature" of the system itself. This is a powerful tool for redistributing capital, constantly transferring wealth from some to others. At each turn of the economic cycle, when "bubbles" inflate (be it dot-coms, mortgages, or crypto), and then deflate with a resounding crash, a massive redistribution of wealth occurs. This is not a natural disaster, but rather a well-oiled mechanism.
Accumulation of assets by "dumb money": During periods of rapid growth, when markets are overheated and assets are rising rapidly, "dumb money" enters the game – that is, ordinary retail investors, small speculators, newcomers without a deep understanding of risks. Inspired by stories of successful success and the fear of missing out (FOMO), they pour their savings into the market at its peak, often using borrowed funds or buying the most volatile and overpriced assets. They buy "hype," not value. It is here that MicroStrategy, aggressively buying Bitcoin with borrowed funds, becomes a symbol of this vulnerability, albeit on a larger scale.
Shaking out weak hands: For the "system," there are two main methods to get rid of "excess passengers" and "weak hands" in the market. The first is sharp, panic-driven crashes, when fear forces investors to sell assets at a loss, just to "get out of the game." The second, no less effective, is the exhaustion of enthusiasm over time (prolonged periods of stagnation). These are months or even years of boring "sideways" trading (trading in a narrow range) or slow but steady price declines. At such moments, the belief in quick profits fades, and investors, especially those who invested in altcoins without fundamental understanding, lose patience and leave, abandoning their assets at throwaway prices. Both methods effectively "clear out" inexperienced or insufficiently patient participants.
Creating "liquidity" for institutions: Crashes and price declines, as well as periods of stagnation, create what is called "liquidity" – an opportunity for large players to buy assets at significantly discounted prices. When the market is "bleeding," or when "hamsters" get tired of waiting and sell everything in despair, that's the "meat" that the "falling knife" provides for "smart money."
Benefits for "smart money": Giants like BlackRock, Fidelity, Vanguard, or legendary investors like Warren Buffett, do not invest in "hype." They create trends and wait. They possess enormous capital reserves, access to insider information (analytics, government plans, such as TBAC documents), and, most importantly, iron discipline and patience. They do not succumb to panic; they create it when needed! When markets are bleeding and "ordinary mortals" sell everything in a panic, these "sharks" of the financial world go hunting, buying quality assets (be it stocks, real estate, or even Bitcoin, which is already recognized as "digital gold" in certain circles) at prices inaccessible to small players.
Centralization of wealth: As a result of each such cycle, a further centralization of wealth occurs. Capital flows from less informed, less disciplined, and more emotional market participants to those who play by the rules of the "big game," having access to resources, analytics, and, possibly, even a certain influence on the system itself. Market crashes are not system errors, but its key redistribution function, allowing capital to remain in the hands of the elite and constantly increasing their share of the overall wealth pie. This is a brutal but extremely effective mechanism of "natural selection" in the world of finance.
And these are not some "conspiracy theories" but the harsh truth, whether someone likes it or not. According to 2022 data, people with capital over $1 million, making up only 1.1% of the world's population, own ~50% of the world's wealth, while the richest 12.2% of people own over 85%. At the same time, the poorest 55% of the planet's population controls only 1.3% of the world's wealth. Between these two poles, about half of the global wealth is (for now) dispersed. And in 2026-2028, you will have the last chance to enter this "middle class," which is systematically being destroyed by those at the top of the pyramid.
✴️ Your place in the "New World Crypto-Order" (or why freedom is an illusion)
We live in an era when even the seemingly most "decentralized" and "independent" market, like crypto, ultimately finds itself under the close scrutiny of those who hold the strings of the global financial system. Documents like TBAC (which you will hopefully now read with double attention) are not just bureaucratic reports; they are roadmaps to how "Big Brother" intends to integrate, and essentially subordinate, the "wild" world of digital assets to its interests. So, we have established that:
The upcoming stock market crash and, consequently, crypto crash in 2025-2026 – this is not just an "unexpected market correction," but an inevitable managed stage of "cleansing" that will allow the "system" to get rid of "weak hands" and acquire assets at a discount. Your altcoins, which are already bleeding, will become even cheaper before they are picked up by those who know what they are doing.
"Pump" of stablecoins to at least $2 trillion by 2028 – this is not a sign of your victory, but a brilliant way for the US government to find a new, bottomless source of financing for its ever-growing national debt. Your "stable" money will become their "stable" bonds, as most stablecoins, especially USDT and USDC, are backed by US Treasury bonds, which creates direct and massive demand for US debt obligations. "Continued growth of stablecoins... will create structural demand for short-term US Treasury obligations." (DA&TM, p. 16)
The narrative "Bitcoin – digital gold" – this is not just a marketing ploy by crypto enthusiasts, but a convenient concept that the government can use to "nationalize" large crypto assets at a bargain price and use them for its own benefit. The hidden, but key goal of this narrative is to create a new, global tool for absorbing and refinancing part of the colossal US national debt. The higher the recognition and price of "digital gold" controlled by the state, the more financial leverage it will gain to manage its obligations, turning a decentralized asset into a new pillar of the fiat system .
❓ What does this mean for us, mere mortals, trapped in this crypto-matrix?
This means that the next six months are a time not for euphoria and not for buying a "strategic reserve," but for strategic retreat and patient waiting. While "Big Brother" squeezes the market and prepares for the "nationalization" of crypto assets through defaults and margin calls, we should:
Keep a finger on the pulse of the global economy: Attention to the debt market, Eurodollar liquidity problems, and the predicted stock market crash in 2025 – this is not background noise, these are the main indicators of the upcoming "cleansing."
Forget about FOMO for Bitcoin at $100k: These are just the death throes of a "bull market," supported by artificial demand. The target range of $30-50k is an entry point that "their boys" are preparing for themselves.
Aim for altcoins: Your favorite altcoins, which have already fallen by -40% since the beginning of the year and still have room to fall (by -60-80% from current levels) – this is where the real "bloody auction" will be. It is these assets that, after the crash, will become most attractive to those who understand what will follow the market "cleansing" and which coins will end up in that very US "crypto-reserve."
🏁 Final Act: Controlled Explosive Growth (2026-2028) When the dust settles, and Michael Saylor's (and many others') Bitcoins are in the hands of the "State Crypto-Reserve" at a large discount, the real "pump" will begin. But this will not be a pump of "decentralization" or "freedom." This will be controlled, institutional, government-funded growth, based on:
Excess liquidity created by banksters. Growth in the broad cryptocurrency market, especially on such a massive scale, is impossible without an influx of "cheap" money into the global financial system. For this excess liquidity to appear, appropriate conditions must be created: low-interest rates (close to zero) and a reactivated "printing press" (Quantitative Easing – QE). To achieve this, the stock market (and, consequently, the traditional economy) must first be sharply crashed to force the Fed to abruptly "change course" and begin "saving" the economy by injecting trillions of dollars into the system. This "flood" of liquidity will be the fuel for a new wave of crypto market growth, but strictly under the control of their guys institutions.
Trillions of stablecoins, backed by US national debt. These stablecoins, as we already understand, create structural demand for short-term US Treasury obligations, becoming a powerful tool for managing national debt.
Mass tokenization of traditional assets on "private, permissioned blockchains" managed by banksters. This will create huge new markets and capital flows that will be controlled by their players.
And, of course, a legitimized Bitcoin as "digital gold," which will now be in safe government hands, not with some "alchemists" or "micro-strategists."
💡 Be smart, not emotional.
The cryptocurrency market – is not just a set of charts and technologies. It's a battlefield where the interests of decentralization and centralized control clash. In the coming years, we will see how the last "wild" frontier of digital assets will be integrated into the traditional financial system.
Your task is to understand this scenario, step aside while the "elephants dance," and prepare to enter when "blood is flowing in the streets." Only then will you be able to become part of this final explosive growth, which, ironically, will be provoked and financed by the very forces that are now trying to herd crypto into a corral.
⚠️ See you in 2026! And remember: knowledge and understanding – this is your only superpower in this zero-sum game, as everyone, to the extent of their understanding, works for themselves, and to the extent of their misunderstanding – for those who know and understand more.
🚀 As a token of gratitude, don't forget to hit the rocket under this unique work.
🙏 Thank you for your attention.
📟 Stay in touch.

Was that end of bull run? BTC Price action + signal!Hello everyone! i want share my idea + signal at bitcoin.
I'll make simple technical analysis, yesterday bitcoin test 106500 LVL but i think sellers are still strong and they will brake that support zone and then we have 101000-100000 support zone where we can see real buyers if we are still in bull trend. in my opinion bear trend will start soon.
Why bitcoin made new high? with technical it tested 1 week FVG and it worked well but what happened exactly?
Despite the high, profit-taking is evident. On-chain data shows $4.02B in volume from 1–5y holders (highest since February), suggesting old hands are selling into strength. ETF inflows slowed this week, and the Fear & Greed Index at 74 (“Greed”) signals potential overheating. If $100K fails, a deeper correction to $90K–$87K could confirm a short-term bear trend.
Institutional Adoption: Highlighted $40B+ ETF inflows and corporate buying (e.g., MicroStrategy), as these are major drivers of the $111,880 high on May 22, 2025.
Regulatory Tailwinds: Noted Trump’s re-election and SEC speculation, which markets priced in as bullish.
Halving & Scarcity: Linked the April 2024 halving to reduced supply, supported by on-chain data showing low exchange inflows.
Macro Factors: Tied Fed rate cuts and BTC’s “digital gold” narrative to the rally, as these are widely discussed in 2024–2025.
Added on-chain evidence ($4.02B volume from older holders) to support your view of profit-taking and seller strength.
Noted slowing ETF inflows and high Fear & Greed Index (74) to justify a potential correction, aligning with your bearish outlook.
Suggested $100K as a critical level to watch, with a break below signaling a deeper drop to $90K–$87K, giving traders a clear risk framework.
This is not long term, short signal but for few days it will be good, we have FOMC soon and it will show us real bitcoin price direction.
Open short at 1075000
Stop loss at 109000
Take profit at 101000
Always make your own research!!!!
for collaboration text me Private!!!

Bitcoin Analysis – Possible Scenarios🟠 Price is consolidating around 104,500, sitting right on the short-term ascending trendline. No clear breakout yet.
🔴 Supply Zones:
1️⃣ OB 1H:📍 107,800 – 108,600📌 Strong rejection zone that led to the current decline.
2️⃣ OB 4H:📍 106,100 – 107,500📌 Key resistance zone – a valid break above may trigger bullish continuation.
3️⃣ Upper OB 1H:📍 110,700 – 111,400📌 Higher resistance to watch in case of strong breakout.
🟢 Demand Zones:
1️⃣ FVG 1H:📍 103,900 – 104,300📌 Price is nearing this imbalance zone – bullish reaction expected if support holds.
2️⃣ Lower FVG 1H:📍 99,900 – 100,700📌 If current support fails, this is the next strong liquidity zone.
📊 Possible Scenarios:
1️⃣ Bounce from current trendline & FVG → move toward OB 4H (buy setup with confirmation)
2️⃣ Break below trendline → deeper pullback into 100K zone
3️⃣ Breakout above OB 4H → target next resistance at 108,600 and above
‼️ Wait for confirmation before jumping in – price action is at a decision point.
🔍 Insight by ProfitaminFX
If this outlook aligns with your bias, or if you see it differently, feel free to share your perspective in the comments. Let’s grow together 📈

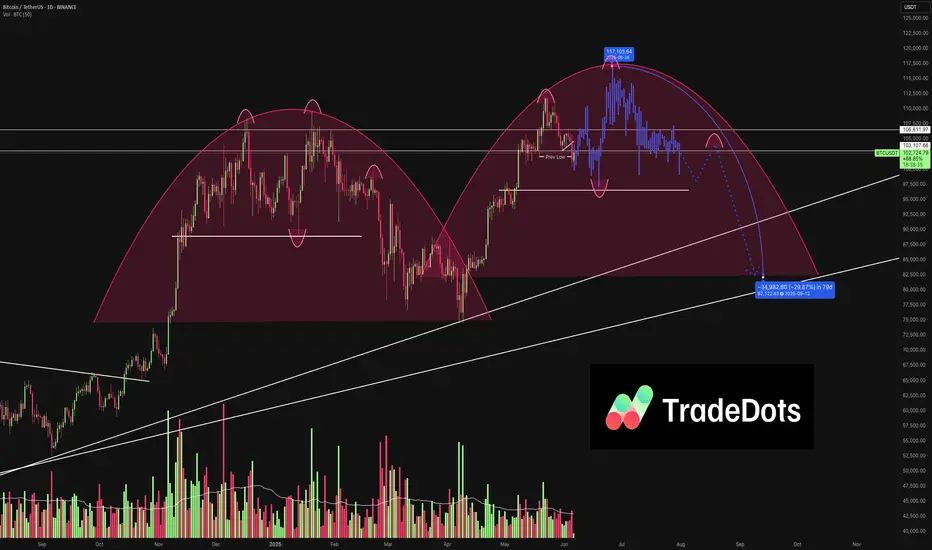
Is Bitcoin Repeating Its 2021 Price Action? | TRADEDOTSWe’ve observed that Bitcoin CME:BTC1! appears to be repeating a previous wave pattern. If it follows its historical price action yet again, here’s what we might expect:
2021 Comparison
Back in 2021, Bitcoin formed two large rounded wave structures where the second wave exceeded the first, forming two consecutive all-time highs followed by a huge drawdown. This year’s price action looks very similar to the beginning of the second 2021 waves. If it continues to unfold in the same way, we anticipate a new all-time high before the end of this year, followed by a notable pullback into early next year.
Key Support at $96,000
As long as BTC holds above $96,000, the bullish trend remains intact. This level has shown great demand and volume support, reinforcing its role as the floor for the short-term uptrend.
Upside Potential to $117,000
If buyers continue to support the market above $96,000, BTC could reach the $117,000 region, setting another all-time high. This expectation follows the earlier wave pattern seen earlier this year and completes a close parallel to the 2021 bull run.
Deeper Pullback Expected
After a potential new high, a larger correction is likely. Drawing on previous pullback price action, a 30% dip toward $82,000 could align with a higher-time-frame trendline and significant support area—mirroring the wave structure from 2021.
Final Thoughts
BTC remains structurally bullish above $96,000
A pullback to the $82,000 region could present a key buying opportunity if it occurs.
BTCUSDTHello Traders! 👋
What are your thoughts on BITCOIN?
Bitcoin entered a corrective phase after a liquidity hunt above the recent highs and is currently in a short-term pullback.
We expect this correction to extend toward the identified support levels, after which a new bullish wave may begin, potentially leading to fresh all-time highs.
The broader trend remains bullish, and the current correction could offer a buy-the-dip opportunity in line with the ongoing uptrend.
Don’t forget to like and share your thoughts in the comments! ❤️

Phemex Analysis #87: Pro Tips for Trading Hyperliquid (HYPE)Hyperliquid ( PHEMEX:HYPEUSDT.P ) has rapidly become one of the most talked-about cryptocurrencies over the past two months. Impressively defying broader market uncertainties, HYPE soared from a low of $9.313 on April 7 to a remarkable high of $40.019 on May 26—achieving an astounding growth of approximately 329%.
However, caution is advised, as recent price action has formed a classic "Head-and-Shoulders" pattern, with the third peak emerging around June 3. This technical setup often indicates weakening bullish momentum and potential trend reversal. Given this scenario, let's delve deeper into several possible outcomes that could unfold for HYPE in the upcoming days.
Possible Scenarios
1. Bearish Reversal
The Head-and-Shoulders formation signals a potential bearish reversal. If HYPE breaks below the critical support levels at $31.5, especially with increased trading volume, and subsequently breaches the $30 support, the likelihood of a sharp downward movement intensifies.
Pro Tips:
Short Positions: Consider initiating short positions upon confirmed breakdowns below $31.5 or $30. Always employ tight stop-losses to manage risk effectively.
Long-Term Accumulation: For those with a longer-term bullish outlook on HYPE, watch closely for price stabilization around lower support levels at $25.5 and $24.3, which could offer strategic entry points for buying the dip.
2. Retesting the $30 Support Level
Another plausible scenario is that HYPE might retrace to the $30 support level, characterized by declining trading volume. If volume diminishes significantly at this level, it could indicate that selling pressure is weakening, setting the stage for consolidation rather than further declines.
Pro Tips:
Grid Trading Strategy: Utilize grid trading to systematically capitalize on potential range-bound movement between clear support at $30 and resistance near $38.
Risk Management: Remain disciplined by setting clear stop-losses above the resistance or below support to protect against unexpected breakouts or breakdowns.
3. Breakout Rise (Bullish Scenario)
While considered less likely given current technical patterns, crypto markets often defy expectations. A bullish breakout above the immediate resistance levels at $37.2 and subsequently $39.7—particularly if accompanied by strong positive news or substantial trading volume—could signal another significant upward move.
Pro Tips:
Watch Resistance Levels: Stay alert for decisive breakouts above $37.2 and $39.7, validating the bullish scenario.
Confirmation Required: Only enter long positions if breakouts are confirmed by sustained volume and supportive fundamental news.
Conclusion
Hyperliquid (HYPE) currently stands at a crucial technical juncture, presenting multiple strategic opportunities for traders. Whether anticipating a bearish reversal, a consolidation phase, or a surprise bullish breakout, successful trading will depend on vigilance, technical confirmations, and disciplined risk management. Stay adaptable, carefully monitor key price levels, and remain informed about news and market developments to confidently navigate trading HYPE.
Tips:
Elevate Your Trading Game with Phemex. Experience unparalleled flexibility with features like multiple watchlists, basket orders, and real-time adjustments to strategy orders. Our USDT-based scaled orders give you precise control over your risk, while iceberg orders provide stealthy execution.
Disclaimer: This is NOT financial or investment advice. Please conduct your own research (DYOR). Phemex is not responsible, directly or indirectly, for any damage or loss incurred or claimed to be caused by or in association with the use of or reliance on any content, goods, or services mentioned in this article.

ONDO Finance Potential Bullish Breakout OpportunityONDO Finance seems to exhibit signs of overall potential Bullish momentum if the price action forms a prominent Higher High with multiple confluences through key Fibonacci and Support levels which presents us with a potential long opportunity.
Trade Plan:
Entry : 1.3
Stop Loss : 0.47
TP 1 : 2.13

RENDER Potential Bullish Breakout OpportunityRENDER seems to exhibit signs of overall potential Bullish momentum if the price action forms a prominent Higher High with multiple confluences through key Fibonacci and Support levels which presents us with a potential long opportunity.
Trade Plan:
Entry : 5.8
Stop Loss : 2.2
TP 1 : 9.4

BTCUSDT - at CUT n REVERSE AREA ? Holds or not??#BTCUSDT.. market just reached near to his ultimate aea that is around 104300
keep close that area because should holds above that if there is further buying scnerios.
otherwise below that not at all.
good luck
trade wisely

BTC: Facing Resistance?Bitcoin recently encountered renewed selling pressure, stalling the anticipated continuation of green wave B. Under the primary scenario, this corrective upward movement should still extend into the upper blue Target Zone between $117,553 and $130,891, where the price is expected to reverse and initiate green wave C. That move should complete with a low in the lower blue Target Zone between $62,395 and $51,323, thereby finalizing orange wave a. Following a corrective advance in wave b, the larger wave (ii) should reach its conclusion. There remains a 30% probability for the alternative scenario, in which BTC pushes above the upper blue Target Zone, establishing a new high in blue wave alt.(i)— which would delay the expected pullback.
📈 Over 190 precise analyses, clear entry points, and defined Target Zones - that's what we do.

"Caught the Dip – Next Stop: Resistance Zone 1. Current Price Action:
The asset has bounced off the demand zone around 101,500 – 102,000 USDT.
It is now trading at 102,204.56 USDT, indicating early signs of the expected bullish move.
A white curved arrow suggests a rounded bottom pattern, often signaling a bullish reversal.
2. Demand Zone (Support):
Remains the same as the previous chart: 101,500 – 102,500 USDT.
Price reacted exactly at this zone and is starting to move upward.
3. Supply Zone (Target Area):
Clearly marked at 104,800 – 105,500 USDT.
This is where the expected bullish move could face resistance or where traders might look to take profit (TP).
4. Visual Reinforcement:
The large blue arrow indicates strong bullish momentum is anticipated.
The meme (Leonardo DiCaprio pointing) emphasizes that the reversal is happening as previously predicted — likely for motivational or engagement purposes in a VIP group.
---
🧠 Technical Sentiment:
Bullish Bias confirmed: Price bounced exactly from the demand zone.
Momentum Shift is underway, as indicated by the reversal pattern.
A potential "Buy Confirmation" is in play with room to ride up to the 105K resistance zone.
---
🎯 VIP Trade Setup Recap:
Parameter Value
Entry Zone 101,500 – 102,000 USDT
Current Price 102,204.56 USDT
Target (TP) 105,000 – 105,500 USDT
Stop Loss (SL) Below 101,000 USDT
Bias Bullish / Reversal
---
📌 Suggested Title:
"Reversal In Motion – Ride to 105K 🎯🚀"
