Bitcoin 4 hour update and longer term outlook for next 5 days
Bitcoin is in a Rising channel after dropping.
This can be easily called a BEAR FLAG and it needs to be paid attention to for a number of reasons.
The line of support that held PA up in May is now close overhead resistance and we are climbing towards an apex around 11 June.
PA always reacts before APEX
I would expect this to happen from the 8th June but could obviously happen before.
I can see PA dropping to around 102K, on the POC ( red dotts ) off the VRVP
We will have to see what happens form there but there is a strong line of support just below this.
The 4 hour MACD is currently being rejected from Neutral back down into oversold.
The Daily MACD is continuing to fall Bearish and will reach neutral bu the weekend, the 7th
This could be the beginning of a longer term Bearish move and could end up back in the mid 95K before it finishes over the next 8 weeks
HOWEVER, PA does have the ability to turn the tables on the newly woken Bears
We will have to take this a step at a time right now.
But as emtioned in apost earlier today, I do expect us to NOT move to much higher in the near future but more to range once again, maybe for up to 8 - 10 Weeks
We shall see and watching the Dominance chars right now is a VERY good idea
Cryptomarket

Toncoin Major Advance Now! New All-Time High Incoming (PP: 200%)Toncoin entered its current price range in February, four months ago. After some shaking, this project has been sideways and four months sideways is a very long time when it comes to Crypto, there is good news of course.
When the drop happened in March a bottom pattern was confirmed. A bottom means the bearish trend ends and the market prepares to change.
Just a few days ago, TONUSDT produced really high volume, signaling the start of a new uptrend, higher highs and higher lows.
This post is a friendly reminder just to let you know that Toncoin is about to go up and it will de so really strong.
The signals are in. Consolidation has been strong. The action is happening above support.
An advance now will be strong first, then fast, then slow followed by additional growth. I mean, the bullish action won't stop at $5.51 nor $10 ($9.92), it will continue growing, growth long-term. We are set to experience a new all-time high, the strongest bullish action in the history of Toncoin, it is starting now.
Thank you for reading.
Namaste.

TradeCityPro | Bitcoin Daily Analysis #108👋 Welcome to TradeCity Pro!
Let’s dive into the analysis of Bitcoin and key crypto indices. As usual, in this analysis, I’ll review the futures session triggers for New York.
⏳ 1-Hour Timeframe
As you can see in the 1-hour timeframe, yesterday the 105087 trigger was activated, and now after a pullback to that level, the price is heading toward the 103899 support.
💥 If you entered a short position based on the 105087 trigger, you can hold it until 103899. If you haven’t opened a position yet, you can consider today’s triggers.
🔽 The first short trigger for today is the 103899 level. A break below this level can start a major bearish move. Personally, I’ll enter a short if this level breaks.
⚡️ Breaking below 38.95 on the RSI will give us a suitable momentum confirmation. If selling volume increases, the probability of a bearish move will rise.
📈 For long positions, our first trigger is the same 105087 level. If a higher low is formed compared to 103899 and this level breaks, it will provide a good long opportunity.
💫 The main long trigger is 106586. If this level is broken, the uptrend can resume and price could move toward higher resistance levels.
👑 BTC.D Analysis
Looking at Bitcoin Dominance, a range box has formed between 63.93 and 64.23.
✨ A break above 64.23 confirms bullish continuation, while a break below 63.93 confirms a bearish trend in dominance.
📅 Total2 Analysis
Moving to Total2, yesterday it closed below 1.17, and now after a pullback, it's heading toward 1.16.
✅ If 1.16 breaks, a short position can be opened. If the downward move turns out to be fake, a break above 1.18 gives us a long trigger.
📅 USDT.D Analysis
Looking at Tether Dominance, yesterday it confirmed above 4.70 and is now moving toward 4.79. A break of 4.79 could signal a continuation of the upward move.
📊 If it closes back below 4.70, the price could move toward 4.64. A break below 4.64 would signal a bearish trend in USDT dominance.
❌ Disclaimer ❌
Trading futures is highly risky and dangerous. If you're not an expert, these triggers may not be suitable for you. You should first learn risk and capital management. You can also use the educational content from this channel.
Finally, these triggers reflect my personal opinions on price action, and the market may move completely against this analysis. So, do your own research before opening any position.

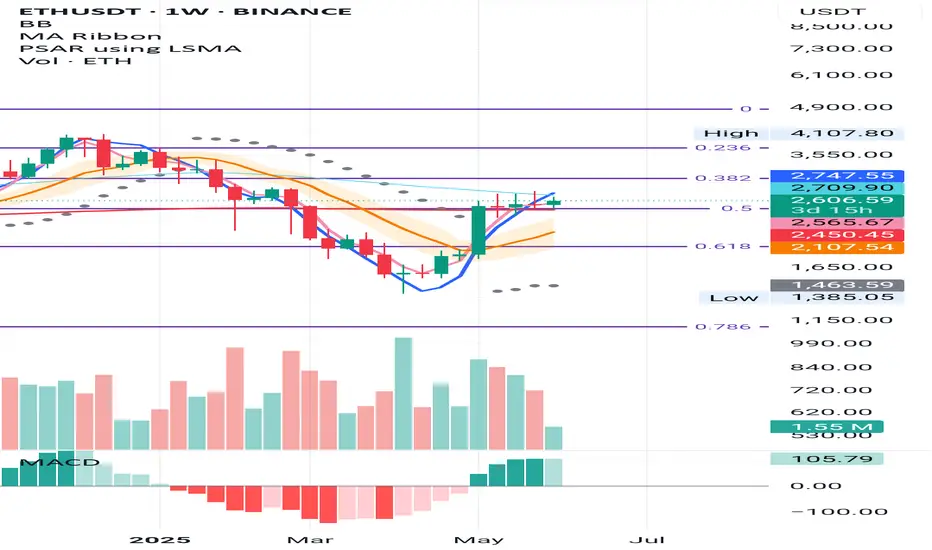
ETH Weekly – Signs Aligning for a Long Setup
ETH is forming subtle higher lows above the 0.5 Fibonacci level and the 200MA—both sitting near the same key support zone.
The 50MA is currently acting as resistance, but structurally we’re seeing MLR > SMA > BB center, and the PSAR flipped bullish since the week of May 12.
We now have all the signals needed for a valid long entry on this timeframe.
Feel free to drop your thoughts in the comments—good or bad, all engagement is appreciated.
Take profits. Manage risk. Stay sharp.
PEPE at Key Reversal Zone — Support Test Coming Soon?Today I want to look at the PEPE token ( BINANCE:PEPEUSDT ), which is part of the memecoin category, and provide you with a short-term analysis on the 1-hour timeframe .
PEPE token is trading in Potential Reversal Zone(PRZ) .
In terms of Elliott wave theory , the PEPE token appears to be completing the microwave 5 of the main wave C . The structure is a Zigzag Correction(ABC/5-3-5) .
Also, we can see the Regular Divergence(RD-) between Consecutive Peaks .
I expect the PEPE token to attack the Support zone($0.0000120-$0.0000108) after completing the main wave C .
Note: Stop Loss = $0.0000362
Please respect each other's ideas and express them politely if you agree or disagree.
Pepe Analyze (PEPEUSDT), 1-hour time frame.
Be sure to follow the updated ideas.
Do not forget to put a Stop loss for your positions (For every position you want to open).
Please follow your strategy and updates; this is just my Idea, and I will gladly see your ideas in this post.
Please do not forget the ✅' like '✅ button 🙏😊 & Share it with your friends; thanks, and Trade safe.

TradeCityPro | ALGO: Bearish Pressure Builds Near Key Support👋 Welcome to TradeCity Pro!
In this analysis, I’m going to review the ALGO coin for you. The Algorand project is one of the Layer 1 and RWA projects.
⚡️ The coin, with the ticker ALGO, currently holds a market cap of $1.63 billion and ranks 53rd on CoinMarketCap.
⏳ 4-Hour Timeframe
As you can see in the 4-hour timeframe, after the price reached the 0.2505 resistance level, a bearish phase began, and with the breakdown of the 0.2123 level, the first bearish leg extended down to 0.1912.
✔️ After this drop, the price retraced up to the 0.382 Fibonacci level and now has returned to the 0.1912 zone. Given the strong bearish momentum in the market, the probability of breaking this level is quite high.
✨ If 0.1912 is broken, the extension wave could begin. According to Fibonacci projections, the targets for this position are 0.1780, 0.1732, and 0.1602.
💥 An entry of RSI into the Oversold zone would serve as a very strong momentum confirmation for this position. If that happens, the price may reach the 0.1602 target.
📊 Volume also plays a key role. Currently, the selling volume isn’t very strong, which might result in a fake breakout of 0.1912. I suggest waiting to see whether sell volume increases, because without volume, price movement is unlikely.
📈 For a long position, the first trigger we currently have is the 0.2023 level, which is a significant high and overlaps with the 0.382 Fibonacci retracement level. Breaking this level could resume the long-term bullish trend.
💫 The momentum confirmation for a long position would be the RSI breaking above the 50 level. A breakout here could kick off a bullish trend in the higher timeframes.
📝 Final Thoughts
This analysis reflects our opinions and is not financial advice.
Share your thoughts in the comments, and don’t forget to share this analysis with your friends! ❤️

ETH Monthly – Fibonacci Structure in Play
ETH has been respecting the monthly Fibonacci levels with surprising precision.
There was a clear double top at the 0.236 Fib in May and November 2024, with a base forming at the 0.5 Fib. That same 0.5 Fib now acts as support, aligned with the 50MA.
The BB centre is currently stopping price, but for how long remains to be seen.
SMA is above MLR and rising, which supports a bullish bias.
If this structure holds, the next resistance zones may align with the higher Fib levels.
Feel free to drop your thoughts in the comments—good or bad, all engagement is appreciated.
Take profits. Manage risk. Stay sharp.

NEAR Protocol Can Hit $35 or $52 in 2025 (PP: 2,000%+)Back to what I was doing... NEAR Protocol (NEARUSDT) closed red three weeks and this week is the fourth week with the action being bearish, why am I bullish?
Four weeks of bearish action and there isn't much, well, bearish action. Total drop is less than 30%. If you look back to January, or say May 2022, four weeks red would be something completely different; market conditions are not the same.
The market now is not bearish nor crashing so we are only seeing a retrace, a retrace is a small correction that ends in a higher low. Wait, let me make a long story short, NEAR Protocol is set to grow.
The market bottom in October 2023 is much, much lower compared to the low hit April 2025, much lower. So we have a very, very strong higher low. This only reveals something we already know, NEAR is bullish and bullish means up. Prepare for growth. The 2025 targets can be seen on the chart.
» How likely is a new all-time high in 2025?
Probabilities are really, really high. NEAR Protocol has a very strong chart that points to a long-term higher high next. The ath being $20, it can easily go higher thanks to the strong higher low mentioned above.
» How long will it take for this new ath to be hit?
Can be anywhere between 4-8 months. I know it is a wide range but with thousands of altcoins, some will move first while others will take longer to reach their bull market top. But late 2025 is the main date and some altcoins will continue bullish through early 2026.
Yes, this pair can be approached with leverage.
Low leverage is better. Low risk is better. Spot is best.
Thanks a lot for your continued support.
Namaste.

Major Enters Bullish Zone, 800%+ Profits Potential MappedSo this is a game on the TON network. It is good you called this to my attention because I love games. I don't play them but I love them, I think these are good for the Cryptocurrency market.
We are looking at MAJORUSDT, thank you for taking the time to read.
It is my pleasure to write for you and I am always grateful for your continued support... Let's read the chart.
There is high volume on the chart, twice. After 3-February and after mid-March. In both instances the high volume happened on green candles. It is an early reversal signal.
MAJORUSDT was moving down, a downtrend; this is when the candles were producing lower highs and lower lows. 11-March 2025 comes the bottom and the downtrend ends. The end of the downtrend is good news, this market is no longer bearish, it goes from bearish to sideways.
The initial recovery, small, peaks 20-March after 165% growth. Then comes the first retrace and the pair is bullish and strong because it ends in a higher low. 7-April of course, when the entire altcoins market bottomed. This higher low is a technical double-bottom. From this point on, instead of the initial breakout and sideways, we have the start of a bullish wave.
MAJORUSDT starts to grow and now it is up. Current action is happening 153% higher compared to March low, the market bottom.
After some higher highs and higher lows, MAJORUSDT is now sideways again, consolidating but this time bullish, building strength before the next bullish jump. So we can expect some more sideways, with some swings followed by additional growth. You can find two nice targets on the chart.
» The first target sits at $0.9347 for 275% profits potential, the second goes beyond 800%.
I love you.
Thanks a lot.
Your support is appreciated.
Namaste.

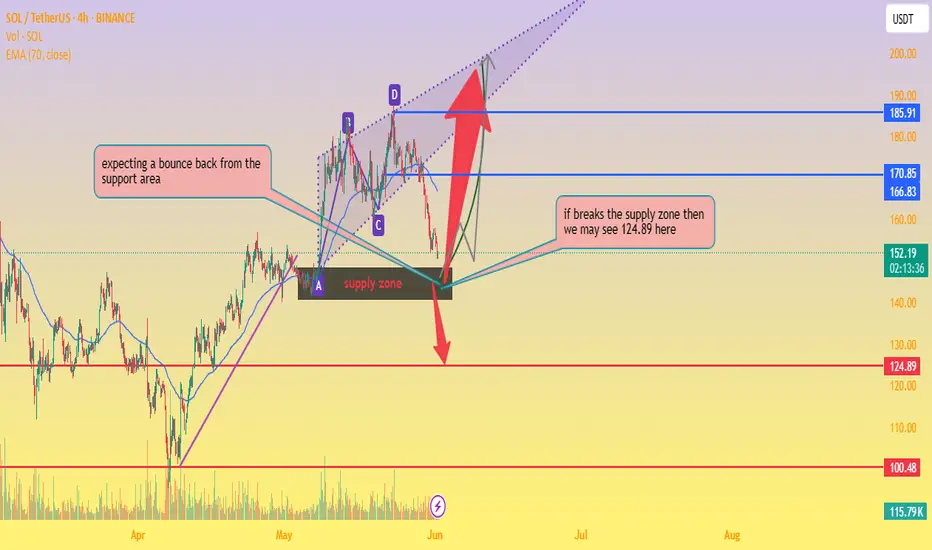
SOL/USDT Key Reversal Zone – Bounce or Breakdown?📊 Chart Analysis:
Current Price: $151.91
EMA 70 (Dynamic Resistance): $166.82
Support Area: Around $150, overlapping with a key supply zone.
Chart Pattern: Harmonic/ABCD structure completing near support.
🧠 Observations:
Price is testing a strong support/supply zone.
📦 If bounce occurs, potential targets:
🎯 First Target: $170.85
🎯 Second Target: $185.91
📉 If support breaks, then:
⚠️ Target: $124.89
📉 Next Major Support: $100.48
🧭 Trade Plan:
🔹 Long Entry (on bullish confirmation):
Entry: $152–$155
SL: Below $149
TP1: $170.85 🎯
TP2: $200 🚀
🔹 Short Entry (on breakdown confirmation):
Entry: Below $148
SL: Above $153
TP: $124.89 🧨
support and drop down your thoughts about it thanks
COMP/USDT Breakout Alert !!COMPUSDT has broken out of a long-term downtrend line on the daily timeframe, signaling a potential bullish reversal.
Chart Analysis:
Downtrend line broken with a strong bullish candle
RSI recovering to 57.28 — showing improving momentum
Price holding above local support near $36.41
Key Levels:
Support: $36.41
Resistance Levels / Targets:
Target 1: $54.68
Target 2: $89.71
Final Target: $123.13
Bias: Bullish — as long as price sustains above the downtrend line and holds support
Timeframe: 1D
Strategy: Watch for retest of breakout zone ($43–$45) as potential entry, with targets as mentioned.
This is not financial advice, please research before investing, as we are not responsible for any of your losses or profits.
Please like, share, and comment on this idea if you liked it.
#COMPUSDT #CryptoTrading #TechnicalAnalysis #Altcoins #Breakout #BullishSetup

If price doesn’t break you, it’s building you.ETH has been printing higher-timeframe indecision — but within that noise, the structure is crystal clear. We're trading between two OBs. That’s not chaos. That’s preparation.
Here’s the map:
Price has respected the lower OB multiple times — but has yet to displace from it
There’s a clean FVG below, untouched — it’s the draw if this OB fails
To the upside: upper OB is where the game flips — either distribution or continuation
Until then, this is a defined range between intent and indecision
Execution here isn’t about speed — it’s about patience.
How I’m positioning:
A break and close below the OB = short into the FVG at ~2469
If price instead consolidates here and pushes up, I’ll wait for rejection at the upper OB for a reversal short
Only if we displace through the top OB and hold it, do I flip bias back to longs
This isn’t the time to guess. It’s time to observe. Let price do the heavy lifting — your job is to interpret.
More like this — structure-driven setups with real intent — are detailed in the profile description.

Binance Coin Consolidation Bearish or Bullish? $975 TargetThat's the question I am about to answer.
The action is happening above the March 2024 high. Binance Coin's current consolidation is considered bullish because it is happening above this level. There is also a series of higher lows since 2-Feb. 2025. There has been a strong recovery in the last four months.
The fact that the recovery is slow and extended gives it strength.
The action is sandwiched between 0.5 and 0.618 Fib. extension levels. These two levels work as immediate resistance and support.
Bullish patterns and signals are present all across this chart.
» BNBUSDT is bullish. Next strong target and new all-time high will be $975.
Thank you for reading.
Namaste.

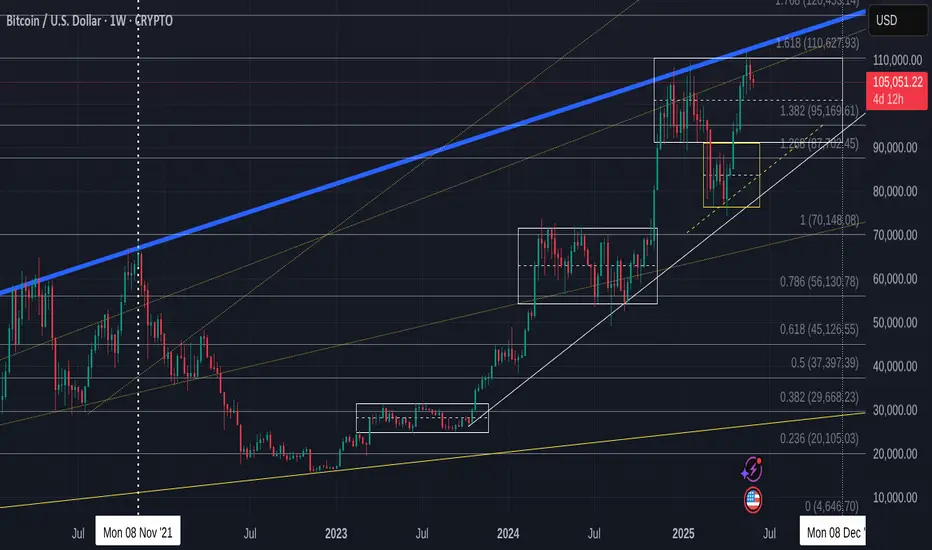
Bitcoin-is that it for now ? Lazy summer, take off in September?
Not posted this chart for a while but we may find it has become Very relevant to what to expect for the next few months
First thing to note is that PA is once again in TOP of range box and ALSO got rejected off the Long Term Blue line that has rejected BTC PA ATH since 2017. This also coincidened with the 1.618 Fib Extension.
Rejection here was highly likely and given how PA had pushed up, it is not surprising to see PA at least taking a breath.
For me, even though we do have the ability to push higher, I am not to sure we will just yet.
The weekly MACD could offer some credence to this idea
The Arrow points to an area that could turn out to be similar to what we are doing now.
The MACD has begun curling over after a prolonged push higher. While There was strength left, PA took a breath and regrouped.
The Chart below shows this period and how BTC PA reacted...and is circled
This was in Dec 2023 to Jan 2024.
PA had just had a sustained push higher and needed a break.and following a 7 week range, PA moved up another 67%
7 weeks from now brings us to near August.
There are charts that point towards a move in August / September
Here is another chart that offers some confluence to this idea.
The Dotted line is a line of support that PA has used as support numerous times this cycle and currently, is almost bang on the 50 SMA. Assuming that PA goes back down to that and bounces again, a 67% rise takes us back up to the Top of Range
Should we drop that far, to the 50 SMA again, we are in the 92K - 95K zone, scaring a LOT of people, wrecking Leverged players and putting Fear everywhere.
PERFECT FOR BUYING
This area also happens to be the 1.382 Fib extension on the main chart, the next Major line of support below us currently.
Should we fall through that, we reach the Bottom of Range and the intersection with the 50 SMA in.......August
So, we have to wait and see. We can push higher now but to do so would require breaking through that long term Blue line of resistance. I am not sure we can do that just yet.
Also, Should we post a RED June candle, Even a small one, the ideas in the Monthly candle post I recently posted also back up the idea of a lazy summer...... and a move higher around Mid to late August
Stay safe
Nano Will Trade At $28 in 2025, A New All-Time HighIt will be a surprise for many. It will not be a surprise for me as you can see I am sharing the chart, but many people will be surprised to see Nano trading at $28 even if it last there only a few weeks.
$28 is the standard 2025 all-time high projection for this bull market. Notice that I mention bull market all the time but there isn't really any, this is just a prediction and it will become true very soon.
XNOUSDT is now out of the long-term accumulation zone. A zone (price range) that was active in 2019-2020, before the previous bull market and also in 2022, 2023, 2024 and briefly in 2025. So Nano gave us years to buy and accumulate at amazing prices. This is about to end.
Not all is bad news—this is actually good news. Low/good prices are over but growth/high profits will enter the picture.
In short, prices will go up. Growth is starting now. Long-term growth.
Expect a long stretch of higher highs and higher lows. Can be 4-6 months of bullish action. Can be a bit less or can be more. Err on the positive side.
Namaste.

TradeCityPro | Bitcoin Daily Analysis #107👋 Welcome to TradeCity Pro!
Let’s dive into Bitcoin and key crypto indices. As usual, in this analysis I’ll walk you through the triggers for the New York futures session.
⏳ 1-Hour Timeframe
As you can see in the 1-hour timeframe, yesterday the price made another upward move and formed its resistance at the 106586 level and a bottom at 105087.
📈 For a long position, considering the uptrend in higher timeframes such as the daily and weekly, we can enter upon a breakout of 106586. A bounce of the RSI from the 50 level can act as a good confirmation for the position.
📊 Buying volume is currently increasing, but the price is still sitting on the support bottom and hasn’t moved upward yet. If this volume inflow continues, a breakout of 106586 would be a strong confirmation for a long position.
🔽 For a short position, the first trigger is the breakdown of the 105087 bottom. If this level is broken, we can enter a short. The main short trigger is at 103899.
💥 Conditions are currently favorable for a short position, and the current candle has strong bearish momentum. So, if 105087 breaks, a short position would be appropriate.
👑 BTC.D Analysis
Let’s look at Bitcoin Dominance. After a pullback to the 64.23 level, the next bearish leg continued to 63.93. If 63.93 breaks, the downtrend is likely to continue and the price could fall to 63.50.
✅ If 63.93 holds, dominance may start moving back up toward 64.67.
📅 Total2 Analysis
Now let’s check out Total2. This index is still below the 1.18 level, and breaking this level would confirm a bullish move.
✨ A new bottom has also formed at 1.17. If this level breaks, we can look for a short position.
📅 USDT.D Analysis
Now to Tether Dominance. This index has formed a box between 4.64 and 4.70.
🔔 A breakout above 4.70 could initiate a bullish move in dominance, while a breakdown below 4.64 could trigger a bearish move.
❌ Disclaimer ❌
Trading futures is highly risky and dangerous. If you're not an expert, these triggers may not be suitable for you. You should first learn risk and capital management. You can also use the educational content from this channel.
Finally, these triggers reflect my personal opinions on price action, and the market may move completely against this analysis. So, do your own research before opening any position.

Potential Reversal Zone for NVDAThis chart of NVIDIA Corporation (NVDA) as of June 3, 2025, shows a technical analysis scenario forecasting a possible bearish reversal. The price action, zones, and arrows suggest a setup based on supply and demand zones.
Key Elements in the Chart:
🔴 Supply Zone (Resistance Area)
Location: Around $141.73 to ~$144
Observation: The price recently entered this red-shaded area, indicating strong historical resistance.
Implication: The area is expected to act as a ceiling, where sellers may overwhelm buyers, causing a reversal.
⚫ Price Reaction:
The chart shows price approaching and briefly piercing the supply zone, followed by a bearish candle or rejection (as indicated by the top arrow).
Arrows project a downward movement, suggesting bearish sentiment.
🟢 Demand Zone (Support Area)
Location: Approximately $114–$121
Observation: This green-shaded area acted as a base for a previous upward move.
Implication: It is likely to act as a strong support if the price drops significantly.
Projected Price Path:
Short-term reversal from the resistance zone (~$144).
Initial drop to mid $130s (likely a lower high or minor support).
Continuation to demand zone around $116, completing the projected bearish move.
Technical Interpretation:
This setup is a classic supply and demand reversal strategy.
Confirmation of the short setup may require:
A clear rejection candle at resistance.
Break of minor support levels on the way down.
Risk for bulls is high near resistance; short sellers may find opportunities targeting the demand zone.

FET Correction Bottom Confirmed —Buy OpportunityThe next All-Time High for FETUSDT in late 2025 or early 2026 can reach between $5.42 or $8.56, giving us more than 1,600% profits potential from the current price. This is taking $8.56 as the next All-Time High. Let's get that part out of the way because I want to show you the end of the current correction. I am using the linear scale so it won't let me show you higher targets on the chart.
There was a resistance level in April 2022 as the bear market developed. This resistance was confirmed again in February 2023. It took 270 days, or 9 months, before this resistance level was conquered (broken). As soon as it broke, it was tested as support (Feb. 2024) and then a major rise. This major rise completed a long-term bullish cycle and after a bullish cycle a correction always develops.
How far down can the correction reach?
How low can prices go?
The correction started in March 2024 and is active until this present day. Obviously, the strongest resistance price range in the history of FETUSDT will need to be tested again but as support.
Now, FETUSDT bottomed last week and this bottom happened at the same level where the April 2022 and February 2023 resistance was found. As the action approached this level, volume started to go up. The next week, this week, we have a bullish candle and this is very likely the end of the correction; the bottom is in.
I just wanted to let you know that this level will hold because it was a strong resistance in the past. A resistance level once conquered turns into support.
As prices are now, it is the best possible time to enter; buy, go LONG.
This is a friendly reminder. I am wishing you tons of success and huge profits in this bull market that is just about to develop. It will be a bull market that will change the world. The world is already changing, but this bull market will close the deal. By the time it is over, Cryptocurrency will have taken over the world.
New money. The rich nouveau.
Namaste.

Chainlink Next Move Now Imminent, Strong Setup (8X)I still think that Chainlink has a strong chart setup that can start moving any time without warning.
The rise from 7-April lasted only six weeks and later the retrace lasted 3 weeks. That's 50% of the time. The sixth week that produced the peak was also a red week. When a pair is about to start moving, this is already a strong enough retrace. Three weeks out of a total of eight would be a perfect retrace, both are fibonacci numbers.
The retrace pierced the 0.5 Fib. retracement level and started to recover right above 0.618. The last candle close happened above 0.5. In short, this is perfect bullish price dynamics.
What's more, the short-term 0.618 Fib. retracement level here also marks the breakdown and recovery from July-November 2024. Back then we had a long bottom pattern and this time a short-term one. Another perfect pattern and classic; Elliotts law of alternation.
We have a good one here. I think Chainlink can be a win for us but only time will tell of course.
I thank you for reading.
First leave a comment and then follow.
Thanks a lot for your continued support.
Namaste.


TradeCityPro | APE: Key Breakout Watch in Gaming Token’s Range👋 Welcome to TradeCity Pro!
In this analysis, we’re taking a look at the APE coin — one of the prominent American gaming and metaverse projects that gained major traction during the last bull run.
⭐ Currently, APE holds a market cap of $540 million and ranks 110th on CoinMarketCap.
📅 Daily Timeframe
As shown on the daily chart, price has reached a key resistance zone and has tested it several times.
✔️ If this resistance breaks, it could confirm a trend reversal, potentially opening the way toward higher levels like 0.8990 and even 1.973.
🛒 For spot buying, an entry can be considered upon the breakout of this resistance, though it's safer to wait for confirmation of bearish momentum in Bitcoin dominance before entering a spot position on APE.
📈 However, for futures positions, this same breakout trigger can be used — either on the daily chart or lower timeframes.
🔽 On the short side, a support level has formed at 0.6073. A break below this could extend the bearish trend toward 0.3833.
⚡️ Still, there’s a major support level nearby at 0.5633. If you’re looking for a more conservative short entry, you might wait for a clean break below 0.5633.
💥 Momentum confirmation for the short position would come with an RSI breakdown below 46.46, which would signal stronger bearish pressure entering the market.
📝 Final Thoughts
This analysis reflects our opinions and is not financial advice.
Share your thoughts in the comments, and don’t forget to share this analysis with your friends! ❤️

ETH/USDT 1DAY CHART UPDATE !!ETH has broken out of a long-term downtrend (black diagonal trendline) and is now in a consolidation phase below the $2,800–$2,850 resistance.
The price is currently $2,612, showing hesitation below the key horizontal resistance.
Resistance Zones:
$2,800–$2,850: Key horizontal resistance. Breaking above this confirms bullish continuation.
$3,200 and $3,600: Medium to long-term bullish targets.
Support Zones:
$2,000–$2,200: Strong horizontal support + ascending trendline + 50 EMA (red line)
$1,410: Key long-term support (unlikely to be tested soon unless the market reverses)
ETH breaks and closes above $2,850 ➝ $3,200 → $3,600 → $3,800+ likely to rise
The structure suggests that a higher low will likely form before the breakout.
If ETH rejects at $2,850, expect a retest of $2,000–$2,200 (golden zone)
This would create a bullish higher low setup and could be a strong buy-dip opportunity.
Thanks for your support!
DYOR. NFA

Ethereum - The most important analysis for 2025!Ethereum - CRYPTO:ETHUSD - is clearly shifting bullish:
(click chart above to see the in depth analysis👆🏻)
After four years of trading, Ethereum is now sitting at the exact same level compared to mid 2021. However, Ethereum has been creating a significant triangle pattern and with the recent bullish price action, a breakout becomes more and more likely. Then, the sky is the limit.
Levels to watch: $4.000
Keep your long term vision!
Philip (BasicTrading)
