PENDLE – Bullish Continuation Setup from Key Support ZonePENDLE remains one of the standout performers in the crypto space, maintaining its bullish market structure even amid broader market uncertainty. With price currently holding well above key support, this presents a favorable opportunity for a swing long position, especially if the broader market stabilizes.
📥 Entry Zone:
$3.50 – $4.30
🔹 Confluence with previous resistance turned support
🔹 Demand zone within bullish structure
🔹 Ideal for scaling in
🎯 Take Profit Targets:
🥇 $5.45
🥈 $6.30
🥉 $6.85
🛑 Stop Loss:
Daily close below $3.00
Structure breakdown
Cryptomarket

INJ at Key Compression Zone – Breakout Loading?Hello Traders,
CRYPTOCAP:INJ is currently trading between two key zones — a strong upper resistance and a solid lower support.
The price is getting squeezed between a descending resistance line and a rising support trendline, creating a high-confluence area.
So far, bulls are holding the support well. If price breaks above the upper zone, it could trigger a strong move upward.
However, if the support fails, a deeper correction may follow.
🔍 Watch closely — a breakout is brewing, and volatility is on the horizon.
DYOR, NFA

ENA Coiling Up — Parabolic Rally or Pullback Ahead?$ENA/USDT Analysis:
Price is currently moving sideways, stuck between a clear support and resistance zone.
It’s been bouncing off the lower support zone and consistently facing rejection from the upper resistance zone.
A breakout above the resistance could trigger a strong upward move — possibly a parabolic rally.
On the flip side, if it breaks below the support zone, we could see a deeper correction.
Until then, it’s all about patience and watching for that breakout or breakdown confirmation.
DYOR, NFA

Is Ethereum ready for a higher high?CRYPTO:ETHUSD seems to be the only one, from the top cryptos, wit the best technical set-up, at the moment. Let's dig in.
CME:ETH1!
Let us know what you think in the comments below.
Thank you.
77.3% of retail investor accounts lose money when trading CFDs with this provider. You should consider whether you understand how CFDs work and whether you can afford to take the high risk of losing your money. Past performance is not necessarily indicative of future results. The value of investments may fall as well as rise and the investor may not get back the amount initially invested. This content is not intended for nor applicable to residents of the UK. Cryptocurrency CFDs and spread bets are restricted in the UK for all retail clients.

BITCOIN LONG TRADE IDEAI'm looking forward to buying BTC in this price level if I see a good bullish price action which confirm my trade idea.
Market structure on 4HR is currently bullish.
Looking at the monthly and weekly time frame, BTC is extremely bullish and it's clear that BTC is not done with it's bullish run.
I expect to see BTC give another good run to the 120k-150k price level

TradeCityPro | Bitcoin Daily Analysis #106👋 Welcome to TradeCity Pro!
Let’s dive into Bitcoin and the key crypto indices. As usual, I’ll be reviewing the futures triggers for the New York session.
⏳ 1-Hour Timeframe
On the 1-hour chart, the 105800 trigger was activated yesterday and Bitcoin’s trendline was broken. However, the price failed to hold above 105800 and quickly fell back below, making it a fake breakout.
⚡️ For now, I’m keeping the 105800 level as the long trigger to observe how the price reacts. We need to wait for a clear reaction to this zone to better refine the trendline. On the next test, if it breaks successfully, we can enter a long position.
🔍 If a higher low forms above 103899 and the RSI finds support above 50, the likelihood of breaking the 105800 resistance increases, potentially leading to a stronger upward move.
✨ On the short side, since the 105800 breakout failed, bearish momentum could increase. A breakdown below 103899 would trigger a short position with a target at 10750.
If you’ve already opened a short position before this trigger, be aware that it's a risky trade and shouldn’t be relied on as a long-term position.
👑 BTC.D Analysis
The downtrend in Bitcoin dominance has continued following the breakdown of 64.29, and now it has also broken below 64.15, heading toward 63.87.
⭐ For now, BTC dominance is temporarily bearish. If the market corrects, Bitcoin might fall harder, but if the market recovers, altcoins could perform better — unless BTC dominance reverses trend.
📅 Total2 Analysis
Yesterday, the long trigger at 1.16 was activated, and now the index has reached 1.18. Thanks to falling Bitcoin dominance, altcoins have outperformed Bitcoin.
✔️ If 1.18 breaks, the uptrend could continue. Key levels to watch next are 1.21 and 1.24.
📅 USDT.D Analysis
This index formed a lower high below 4.79 yesterday and is now retesting 4.70 after breaking below it.
🎲 If this pullback gets rejected, it confirms weakness in USDT dominance — which supports long positions on altcoins. However, if USDT.D climbs back above 4.70 and it turns into a fake breakdown, there’s a strong chance it could revisit 4.79 or even break that resistance.
❌ Disclaimer ❌
Trading futures is highly risky and dangerous. If you're not an expert, these triggers may not be suitable for you. You should first learn risk and capital management. You can also use the educational content from this channel.
Finally, these triggers reflect my personal opinions on price action, and the market may move completely against this analysis. So, do your own research before opening any position.

Wedge pattern - Bullish Strategy (MSTR)My expectations for June for Microstrategy stock aka Strategy. Ofc, It all depends heavily on BITSTAMP:BTCUSD

TradeCityPro | APT: Triangle Squeeze Near Crucial Support Zone👋 Welcome to TradeCity Pro!
In this analysis, I’ll be reviewing the APT coin. The Aptos project is one of Ethereum’s Layer 2 solutions.
✔️ This project’s token currently holds a market cap of $3.1 billion and ranks 32nd on CoinMarketCap.
📅 Daily Timeframe
On the daily chart, you can see a very strong support level at 4.718, which has been tested multiple times. The price has once again reached this zone.
💥 A descending trendline can also be drawn, showing clear reactions from the price. The area between this trendline and the 4.718 support forms a triangle pattern.
⭐ If the 4.718 support breaks, a short position could be considered. A breakdown below 37.78 on the RSI would serve as strong confirmation of bearish momentum.
📉 The initial target for the short would be 4.338. However, if a new bearish leg forms and the market heads toward lower lows, a drop toward the 3.12 support level is also possible.
📊 Confirmation of a bullish reversal would come from a breakout above the descending trendline. If this trendline is broken and the 6.152 trigger activates, it would justify opening a long position or even buying in the spot market.
🛒 When it comes to spot purchases, the most important factor is a trend reversal in Bitcoin dominance. Personally, I do not buy any altcoins on spot until Bitcoin dominance shifts downward on the daily chart — I only trade them in futures.
📝 Final Thoughts
This analysis reflects our opinions and is not financial advice.
Share your thoughts in the comments, and don’t forget to share this analysis with your friends! ❤️

Bitcoin Dominance, BTC ATH and ALT Seasons since 2017-some facts
There is little doubt now, that this Crypto cycle is very different from previous cycles and the main reason for this is the Bitcoin Dominance ( BTC.D) of the Market.
The reasons for this Dominance is complicated but we can certainly point towards the arrival of ETF's as one of the principle factors.
Corporations simply Buy Bitcoin, Hold it and Trade the ETF's - The Key Principle here being that the Coins are HELD Long term.
As we can see from the main chart, we have a key point in the BTC cycle called the Bitcoin Halving. To many extents, the explanation of this is not relevant right now.
But what you can see is how, previously, after the BTC Halving, we saw a drop in BTC.D,
This was due to the money Flow out of BTC and into ALT coins.
As more ALT coins were bought up, the demand drove the price higher and so their dominance increased, driving BTC.D down
This has not happened this cycle due to bulk buying of BTC for ETF's and BTC being Held Long term.
We can also see how , as we approached a certain time span After the Halving, we saw a sharp rise in BTC.D as we headed towards the next BTC ATH as the BTC buying picked up.
Again, this is not happening this cycle as the Bitcoins are being held long term.
What we can also see on the main chart is how we would normally be approaching a period of expected BTC ATH ( green vertical box )
And the HUGE question is, Will we get a Bitcoin ATH in this period ?
This is, to many extents, impossible to answer but as demand for Bitcoin continues and coins become harder to find, the price should continue to rise.
The tricky bit is, now, with a Bitcoin costing over 100K usd, it becomes harder to move the price. Only Corporations can afford to bulk buy.
So, again, things are different.. Retail is struggling to find a foot hold in the Bitcoin market, seeming to think that a Bitcoin is too expensive for them.....forgetting that they can buy a bit and that will also increase in price by the same %.
And so they look to the ALTs, fast volatile price rises and high returns,
This is seen very clearly in this chart that shows us when we had previous ALT seasons after the Halving
See how, after a period of time after Halving, the ALT Seasons appeared when the BTC.D dropped.
And that has simply just NOT happened this time.
It has to be said, it did try to appear. ALT season tried to happen.
See how after 210 days after halving this cycle, BTC.D did drop sharply but, it found a line of support and bounced back, Killing the ALT season dead in its tracks
There have been a lot of attempts since but the Market has been Bloody for ALTS, with sharp rise and Falls destroying confidence..... And Bitcoin continues to Rise.
So, where are we now ?
This Daily BTC.D chart may offer some ideas
BTC.D PA is currently at TOP of long Term range and finding it hard to get over that line of resistance.
BTC.D Weekly MACD , while not overbought, is curling over Bearish
BTC ATH's have previously been attained from Oversold areas as MACD Rose back higher.
The Volatility has gone and MACD is ranging smooth
SO, in conclusion, it is anybodies Guess right now if we will ever see an ALT season again.
Technically, on many fronts, we are poised, ready for it, even if it is a mini one.
But as we have seen on many occasions this cycle, Bitcoin is a very desired asset now and Demand drives price.....and so the Sell off that we need to drive an Alt season just may not occur.
One thing that is Absolutely certain though, we are highly likely to see another Bitcoin ATH
Stay safe everyone and Love one another. It is Free to do and is worth more than anything

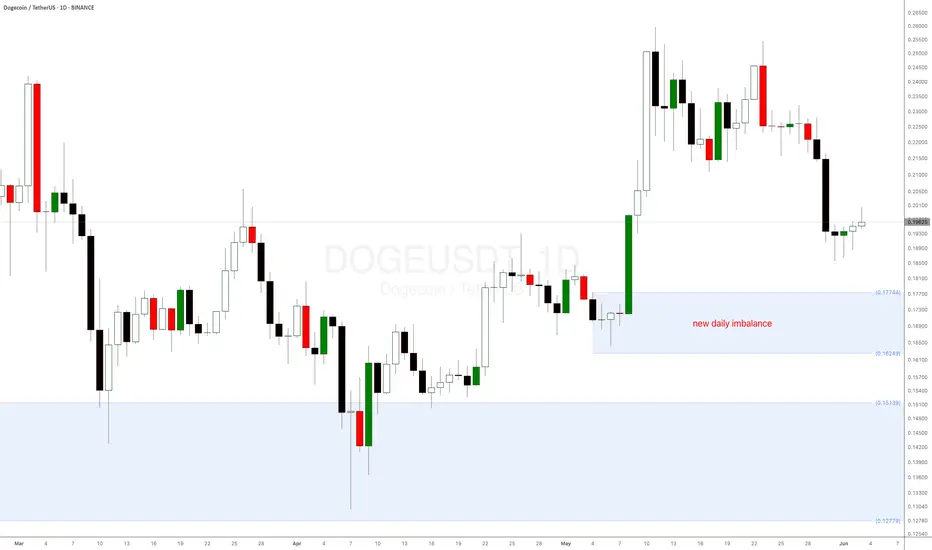
How to Spot the Perfect Dogecoin Buy Signal!Dogecoin (DOGE) is showing another major bullish signal!
After bouncing from the key weekly demand level at $0.151 mentioned in a previous supply and demand crypto analysis, DOGE coin is now approaching a new daily demand imbalance at $0.18035—a level where buyers have historically stepped in aggressively.
Why This Matters:
Strong Reaction Expected: Similar imbalances on other altcoins have led to sharp upward moves.
Long-term weekly imbalance: The weekly demand level is playing out very well.
Dogecoin (DOGE), the world’s favourite meme cryptocurrency, is trying to reach a critical weekly demand level at $0.151—its strongest daily demand zone in a long time! This presents a prime buying opportunity, especially for crypto beginners looking to enter the market.
Check the previous DOGE analysis from a few weeks ago.
Solayer 144% —The Fed Will Lower Interest Rates June 2025Endless opportunities this market has to offer. Even the same opportunity turns up over and over, again and again. If you missed it once, you can comeback and the market will opens its door for you to trade.
Easy win, easy buy, easy profits, easy hold, easy trade.
Solayer went even lower and matched the early March 2025 low prices. It can continue even lower before reversing so watch-out. It can also start moving right away. The trick is to buy and hold, not worrying about the short-term.
If the market wants to move lower, that's ok, we wait. If it moves higher, we have a win (green), this is also good, we wait for our target to hit to sell. You can use the target on the chart or you can aim higher is up to you.
If prices move lower, you can use a stop-loss or quit at a loss. No bueno.
If the market moves lower, it will recover because we are bullish now-long-term.
If the market was bearish, the overall market and cycle, then we wouldn't be talking about holding and long-term growth, we would be talking about taking profits and going home.
The Fed will lower interest rates later this month. This will create a major boom; Crypto is going up. You can more than double your capital with this pair. Endless opportunities the Cryptocurrency market has to offer.
Thank you for reading.
Namaste.

Critical Support Test for Bitcoin: 100K Holding or Breaking? Dear Traders,
Bitcoin's previous support level of 106,000.00 has now been broken, turning it into a resistance point.
At this moment, Bitcoin is at a critical stage, and the most important support level is 100,000.00.
In this zone, rather than opening a position, it is wiser to observe carefully.
If the 100,000.00 support level breaks, I will provide you with a downward target.
If Bitcoin holds at this level and finds support, I will share an upward target.
Right now, Bitcoin is choosing its direction. Will the whales push the price up with their purchases, or drive it down with their sales? We have to watch patiently, like a hunter, to see how this unfolds.👀
Each and every one of you is incredibly valuable to me! I am always working hard to bring you the most accurate and insightful analysis.
A huge thank you to everyone who supports my work by leaving likes.🙏

Bitcoin: $333,333 New ATH? The Bears Are Gone!Let's start with a question: How can Bitcoin be bearish while trading above $100,000? Please answer. How is that even possible?
How can Bitcoin be bearish when the price is $105,000+ at any point in time. How? It makes absolutely no sense. Think about it.
What is it that defines Bitcoin as either bearish or bullish? It's price.
What is Bitcoin's current price?
If you were ready to sell Bitcoin at $105,000 does that mean that the bull market is over for Bitcoin? Or does it mean that you expect for Bitcoin to recover after a correction or retrace?
If it is going to recover, then how long would such an imagined correction last?
How far down would that correction go?
You know the problem with answering all those questions don't you?
The problem is that they are all in your head, based on imagination, because Bitcoin is not going down instead it has been going up now for almost two months. Straight up.
The fact that Bitcoin remains trading above 100K, safely, opens the doors for 200K. 200K means 100% growth left in the coming months and this is guaranteed based on the state of the altcoins market. We are all one.
Before you give up on Bitcoin remember the easiest of all cycles, the halving. Bull market year happens the year after the halving. Bitcoin's block reward is cut in half. Less Bitcoins, increasing demand = higher price.
It is going up. There is still so much room left for growth that you would be surprised to know, this is only the start.
Bitcoin might be preparing for the bull market of its life, 10 years growing straight up non-stop.
There is no bear-market. There is no correction. There is no retrace, there is no pause.
The data is already in, the bears are gone.
Namaste.

Bitcoin Turns Bullish, What To Expect—$200,000 New All-Time HighWe have good news here. Bitcoin continues trading above $100,000-$102,000, in fact, this range hasn't been tested as support so far and this is a bullish development. Not moving below 100K can lead to a new all-time high in the coming months.
What to expect short-term.
The action is bullish now and we see some rising volume. Very little volume but still rising with two green candles. We have multiple levels to consider.
1) The $106,000-$107,000 price range. This is the zone labeled "local resistance" on the chart. If Bitcoin manages to move and close above this level on a daily basis, we can say the bulls are back in. While Bitcoin trades below this level, market conditions remain bearish and you can expect lower prices. Right now it is still bearish.
2) Once this local resistance is broken the next resistance to consider sits around $110,000. As soon as Bitcoin breaks this level it is hyper-bullish and we can aim for 200K.
Let's visit the all-time high potential in late 2025.
» If Bitcoin crashes below 100K and reaches the low 90Ks or lower, then the 200K target for a new ath later this year becomes less likely.
» If Bitcoin never moves below 100K then 200K becomes a high probability target, makes sense?
Right now conditions are still bearish because Bitcoin trades below "local resistance." The small green candles are not enough and it is still too early to say. Market conditions remain the same.
A good scenario would be consolidation, sideways, before additional growth. This would produce the best possible conditions for the altcoins market to thrive and grow.
Namaste.

Phemex Analysis #86: Pro Tips for Trading Ethereum (ETH)Ethereum ( PHEMEX:ETHUSDT.P ) has captured traders’ attention after experiencing a notable 50% rise since early May. Currently, ETH has been consolidating between $2,800 and $2,300 for approximately three weeks. This sideways movement indicates that the market could be in a phase of accumulation, potentially preparing for a bullish breakout. However, traders should remain cautious, as consolidation can sometimes precede bearish trends as well. Let's carefully evaluate several possible scenarios to better understand Ethereum’s next potential move.
Possible Scenarios
1. Breakout Rise (Bullish Scenario)
If Ethereum successfully breaks the critical resistance at around $2,855, particularly with increased trading volume, this would strongly signal the onset of a bullish trend. Such a breakout could attract additional buyers, further fueling upward momentum.
Pro Tips:
Entry Strategy: Consider entering a long position only after ETH clearly surpasses $2,855 with substantial volume.
Risk Management: Place stop-loss orders below the recent resistance-turned-support area around $2,800 to safeguard against potential fake-outs or reversals.
2. Retesting Support Levels (Bearish Scenario)
Should Ethereum fail to surpass the $2,855 resistance zone convincingly, a pullback towards lower support levels becomes likely. Significant areas to monitor in such a scenario include support at $2,320, $1,750, and potentially as low as $1,536.
Pro Tips:
Buy the Dip Carefully: Watch closely for price stabilization at these support levels before initiating accumulation.
Risk Consideration: Avoid aggressively entering positions if price shows accelerated declines with increasing volume. Always wait for confirmed support and reversal signals.
3. Continued Consolidation (Range-bound Scenario)
Ethereum might extend its current consolidation, continually bouncing within the range of $2,300 to $2,800. This scenario presents unique opportunities for traders to capitalize on repeated price movements.
Pro Tips:
Grid Trading Bots: Implement a Grid Trading strategy to effectively capitalize on small but frequent price fluctuations. Start long grid positions near the $2,300 support area and short grid positions around the $2,800 resistance.
Caution and Risk Management: Always set clear stop-loss levels outside the trading range, specifically below support or above resistance, to protect against sudden trend reversals or breakouts.
Conclusion
Ethereum’s current price action presents traders with multiple strategic opportunities, whether through breakout trades, support-level retests, or consolidation strategies. By remaining vigilant, monitoring key levels, and employing disciplined risk management, traders can effectively navigate Ethereum’s evolving market conditions and enhance their trading outcomes.
Tips:
Elevate Your Trading Game with Phemex. Experience unparalleled flexibility with features like multiple watchlists, basket orders, and real-time adjustments to strategy orders. Our USDT-based scaled orders give you precise control over your risk, while iceberg orders provide stealthy execution.
Disclaimer: This is NOT financial or investment advice. Please conduct your own research (DYOR). Phemex is not responsible, directly or indirectly, for any damage or loss incurred or claimed to be caused by or in association with the use of or reliance on any content, goods, or services mentioned in this article.

PIVX: Easy 340% Profits Potential (Round 2 is On!)PIVXUSDT did a nice 150%+ on its first round. And now we are ready for round 2...
My dear friend, I don't have to go too deep into writing because we are talking about money today; easy money, an easy win, the easiest trade.
The higher low is in. The higher high which follows can reach 244% or even up to 340%.
The first high was hit after 22 days. This one can happen in a similar time window, can be some 21 days or 42 days. It is an easy wait when you buy low and hold letting the market take care of the rest.
I don't have to go too deep into writing today because you've already won. A trading system so easy that it works without your consent. So much value, that you tend to take it for granted.
An entire new set of altcoins are about to move strong. You can find them all here first. @MasterAnanda —Do follow now. The 2025 altcoins bull market is starting to heat up. It will be awesome. It is already great.
There is no retrace. There is no correction. There is no downside, there is pause... Pause...
Round 2 is On!
Namaste.

BNB - LONG SET-UPBINANCE:BNBUSDT
This is a high-probability bullish setup on the weekly timeframe
Price is coiling below resistance, and pullback into green zone gives a low-risk entry
EntrY Zone - 590 -- 610
SL Below 575
Target Above 650 -- 700++
Manage Leverage & MargiN As Per Your Risk Capacity

Xrp - New all time highs will come next!Xrp - CRYPTO:XRPUSD - is preparing for new all time highs:
(click chart above to see the in depth analysis👆🏻)
Xrp has clearly been trading sideways for the past 8 years. Meanwhile, market structure is respected perfectly and it seems to be just a matter of time until Xrp will create new all time highs. With the recent bullish break and retest, this scenario becomes even more likely.
Levels to watch: $3.0
Keep your long term vision!
Philip (BasicTrading)

XRP Repeating 2024 Setup? Monitor the RangeCRYPTOCAP:XRP is once again in a familiar phase — accumulation. After its previous range-bound phase led to a powerful breakout, we’re now seeing a similar structure forming on the weekly chart.
The price is consolidating within a clear range, showing signs of strength but awaiting a breakout to confirm the next move. History suggests this kind of accumulation can often lead to explosive upside — but patience is key here.
📌 Key takeaway: Until a clean breakout occurs, it’s best to observe, not chase. Keep your eyes on the upper range boundary for confirmation.
Let the market come to you.
DYOR, NFA
Thanks for following along — stay tuned for more updates!

CHILLGUY Tight Range Play – Patience Could PayCHILLGUY/USDT Analysis – 6H Chart
CHILLGUY is currently consolidating above a strong demand zone and key support line. Price is squeezing into a tight range, showing signs of buildup after the recent uptrend.
As long as the support holds, a bounce toward the mid S/R levels looks likely. A strong breakout from this zone could fuel the next leg higher.
But if price loses the demand zone, it may trigger a deeper correction.
Stay alert — a decisive move is nearing.

Bitcoin Bullish Bias Becomes Stronger —New All-Time High EasyWith every day that passes and Bitcoin doesn't move below 100K the bullish bias becomes stronger. It is a death sentence for the bears. Bitcoin can't never move lower as long as the $100-$102,000 mega support barrier continues intact. And it hasn't been tested yet.
Good afternoon my fellow Cryptocurrency genius, how are you feeling today?
The market gives, the market also takes.
When looking at Bitcoin with a short-term mindset, everything is possible, it is hard to predict what will happen next but, when we focus on the actual price action, no doubt remains. Let me explain.
It doesn't matter if a candle is big or small...
It doesn't matter if Michael Saylor and the ETFs are buying or selling Bitcoin, what matters most is resistance and support.
Bitcoin's strong long-term mega-support remains intact and that is $102,000. Bitcoin is hyper-bullish above $100,000 and this is obvious. We are near the all-time high and the closer the action happens to resistance, the stronger the market. As Bitcoin moves sideways, consolidation, the altcoins will grow.
The altcoins cannot grow if Bitcoin is going to crash and yet the altcoins are starting to recover and some are looking great. I will continue to share more and the more I share the more convinced you will become that the next major move is up. We are set to experience growth long-term.
Aim higher, we are now-already in the 2025 bull market.
Never short Bitcoin within a bull market.
Namaste.

BTC Enters Price Discovery Above $110K—A New Bull Cycle BeginsHistoric Breakout:
Bitcoin has officially entered uncharted territory, breaking decisively above the previous all-time high of $108,364 to surge past $110,000. This isn’t just psychological — it's a clear technical confirmation that the corrective phase is over and a new bullish cycle is underway.
Momentum Without Pause:
The impressive rally has unfolded with minimal pullbacks, a sign of:
Strong institutional accumulation
Growing retail FOMO
This sustained buying pressure suggests we’re witnessing more than a short-term rally — this could be the start of a parabolic move.
Risk Management & Key Support:
Even with minor pullbacks, the technical picture remains bullish.
The $102,000–$106,000 zone (previous resistance) is now key support
This area offers a strategic entry point for those waiting to buy the dip
Price Discovery Mode:
Now in true price discovery, Bitcoin faces no historical resistance overhead. The path of least resistance remains upward, with potential for explosive gains as we move into the summer months.
🚀 Next stop? Price targets in the $130K+ zone may soon come into focus.
#Bitcoin #BTC #AllTimeHigh #CryptoBreakout #PriceDiscovery #BullRun #CryptoMarket #TechnicalAnalysis #BitcoinToTheMoon

BTC: Slowing DownBitcoin managed to stabilize over the weekend after its recent slide, nudging slightly higher from local lows. We continue to expect the current rebound—interpreted as wave B—to stretch into the blue Target Zone between $117,553 and $130,891. Once that move tops out, the next leg lower should follow, with wave C driving the price into the lower blue zone between $62,395 and $51,323. That would likely complete wave a in orange and pave the way for a temporary recovery before wave b rolls over into the final drop of wave (ii). The alternative scenario, which we’re still assigning a 30% probability, assumes Bitcoin is already in wave alt.(i) in blue—a more bullish path that would extend the rally well beyond $130,891 without another major correction first.
📈 Over 190 precise analyses, clear entry points, and defined Target Zones - that's what we do.
