KAS/USDT Analysis (4H/1H)1️⃣ 🟢 KAS/USDT
KAS/USDT found a bottom at 0.0831 USDT and is now tracing a quick five-wave rally. A clean 4H candle close above 0.0875 USDT flips the bias bullish. First target: 0.0901 USDT. 🚀✨
2️⃣ Wave Structure
• Wave (1) peaked near 0.0872 USDT
• Wave (2) held at 0.0831 USDT (strong flip)
• Wave (3) climbed toward 0.0880 USDT
• Wave (4) pulled back to 0.0862 USDT (higher low!)
• Wave (5) projects up to 0.0925–0.0930 USDT once 0.0875 breaks
3️⃣ Key Levels
• 0.0831 USDT – Wave (2) support (pivot) ✅
• 0.0862 USDT – Wave (4) higher-low 💪
• 0.0875 USDT – 4H trendline resistance ⚠️
• 0.0877–0.0880 USDT – resistance zone (former support)
• 0.0901 USDT – first profit zone 🔥
• 0.0925–0.0930 USDT – Wave (5) extension 🎯
4️⃣ Indicators
• 4H MACD: still slightly negative but histogram flattening → bears weakening
• 1H MACD: just crossed bullish → short-term upside momentum ✅
• If 1H MACD stays positive as price hits 0.0875, expect a quick breakout
5️⃣ Trade Plan
• Entry: Wait for a 4H candle close above 0.0875 USDT. Confirm on 1H that price stays above.
• Long near 0.0877–0.0880 USDT.
• Stop Loss under 0.0855 USDT (below Wave (4) at 0.0862).
• TP 1: 0.0901 USDT (take 50% off).
• TP 2: 0.0925–0.0930 USDT (exit remaining).
6️⃣ Invalidation
If price closes below 0.0831 USDT on 4H, the bull count fails. Risk shifts down toward 0.0796 USDT. 🚨
7️⃣ Aggressive Entry (ADHD-Friendly Tip)
• Start a small long at 0.0862–0.0864 USDT (Wave (4)).
• Tight stop under 0.0855 USDT.
• Add more once 0.0877 USDT flips.
8️⃣ Quick Signals to Watch
• 4H close > 0.0875 USDT → GO! 🟢
• 1H candle stays above 0.0875 USDT → Confirm!
• 1H MACD histogram positive → Keep it rolling!
9️⃣ Bullmaster Conclusion
“KAS/USDT shows textbook 5-wave structure off the 0.0831 pivot. With a higher-low into 0.0862 and bullish MACD on the 1 hour, the path of least resistance is up, provided we break the 4 hour descending trendline at 0.0875–0.0880. Our first target is 0.0901, where momentum may pause, but a sustained rally could carry us into the 0.0925–0.0930 zone. A stop under 0.0855 protects the setup—bulls look ready to flip control.”
🔟 Next 8 Hours (Zoomed-In OR in a nutshell )
• Watch for 1H MACD staying green → fuels the bounce into 0.0875
• If 1H price holds > 0.0875, it’s a go→ 0.0901 then 0.0925!
• If price dips back under 0.0862 on 1H → abort mission; bears still in charge.
Let’s keep it simple, stay focused, and ride those bullish waves! 🌊🐂✨
Cryptomarket

TradeCityPro | Bitcoin Daily Analysis #105👋 Welcome to TradeCity Pro!
Let’s dive into Bitcoin and key crypto indices. As usual, in this analysis, I’ll walk you through the triggers for the New York futures session.
⏳ 1-Hour Timeframe
On the 1-hour chart, as you can see, Bitcoin’s correction phase began after the breakdown of the 107010 level. Currently, after pulling back to the 105673 area, it seems ready to begin its next corrective leg.
✔️ One of the reasons Bitcoin has moved downward over the past few days is the escalation of war between Ukraine and Russia. As the conflict intensified, risk assets like Bitcoin dropped while safe-haven assets like gold surged.
🔍 Currently, price action is forming an expanding triangle and is trending downward. It was recently rejected from the triangle’s top and is now sitting on a key support at 103899.
💥 If 103899 breaks, a short position targeting 101750 could be triggered. Selling volume has increased significantly, confirming bearish momentum, so opening a short upon a break of 103899 appears logical. However, keep in mind that the primary market trend remains bullish, and there is a high probability that any short may hit stop-loss.
📈 For a long position, the first trigger would be a breakout above the triangle. In this case, breaking 105673 could justify entry. Key overhead resistances are located at 107010 and 110256.
👑 BTC.D Analysis
Looking at Bitcoin dominance, the metric continued its upward move to reach 64.67 and has since been rejected from that level.
⚡️ If the bullish move continues, the breakout above 64.67 would act as a bullish trigger. On the other hand, a breakdown below 64.29 would confirm a bearish shift.
📅 Total2 Analysis
Total2 is currently ranging between 1.13 and 1.16. A breakout from either side could serve as a trigger for a directional position.
📊 If 1.13 breaks, a short position could be considered. Conversely, breaking above 1.16 would signal a potential long.
📅 USDT.D Analysis
After breaking above 4.70, USDT dominance has been ranging between 4.70 and 4.79. It’s now heading back toward the 4.79 resistance.
🧩 If 4.79 is broken, the next bullish leg in dominance may begin. A drop back below 4.70 would bring the dominance back into its previous range and could lead to further downside toward 4.49.
❌ Disclaimer ❌
Trading futures is highly risky and dangerous. If you're not an expert, these triggers may not be suitable for you. You should first learn risk and capital management. You can also use the educational content from this channel.
Finally, these triggers reflect my personal opinions on price action, and the market may move completely against this analysis. So, do your own research before opening any position.

Bitcoin needs to hold the major support at 104,5 k on 2 WeekBitcoin needs to close above the previous 2 week candles to confirm the next major upside move. A close below would most likely lead to a drop in next week. 9th of June we will know for sure what the future has for us.
BITSTAMP:BTCUSD
COINBASE:BTCUSD
NASDAQ:MSTR
CME:BTC1!
CRYPTOCAP:OTHERS
COINBASE:ETHUSD
BINANCE:SOLUSD

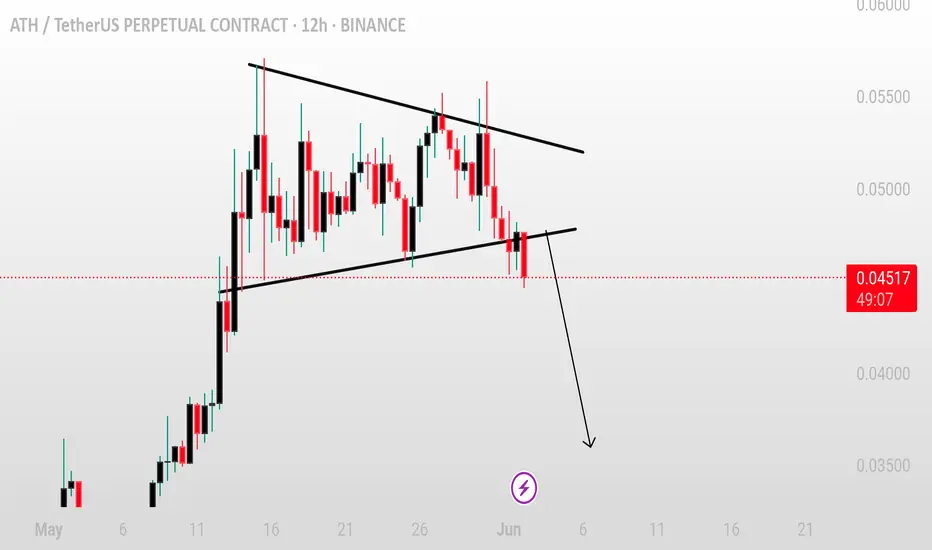
ATHUSDT breakdown alertATHUSDT breakdown alert
ATHUSDT has broken down from a triangle pattern and seems to have completed a retest of the breakdown level. If the price continues to reject that zone, it could confirm bearish momentum and lead to further downside movement.
Key levels to watch:
– Retest zone acting as resistance
– Immediate support levels below
– Volume confirmation on rejection
Stay alert — if the retest holds, ATHUSDT may continue its downward move.
TradeCityPro | FET: Bullish Weakness Near Key Support Zone👋 Welcome to TradeCity Pro!
In this analysis, I’ll be reviewing the FET coin — one of the popular projects in the AI space.
✔️ This project’s token currently holds a market cap of $1.75 billion and ranks 48th on CoinMarketCap.
⏳ 4-Hour Timeframe
On the 4-hour chart, we can see an uptrend in place. However, in its latest leg up to 0.923, the trend has weakened significantly and lost momentum.
💥 After getting rejected at 0.923, the price saw a deep correction down to 0.718 and failed to form a higher low — a clear sign of weakness in the bullish trend.
🔍 The 0.718 level is a crucial support, and breaking below it could trigger a long-term short position targeting 0.639.
✨ A confirmation for this short setup would be an RSI drop into the oversold zone along with increased selling volume. For now, sell volume is low and offers no confirmation yet.
🔔 On the long side, if the 0.764 level is broken, we can consider that 0.718 has held as support, allowing for a potential long entry.
🧩 In my view, even if this trigger activates and the price moves higher, it’s likely to form a lower high or retest the 0.923 level without breaking it. A breakout beyond 0.923 seems unlikely for now.
📈 For the long setup, RSI confirmation would come with a break above 42.05. As market volume is still declining, we’ll need to wait for increased buy volume to strengthen the bullish case.
📝 Final Thoughts
This analysis reflects our opinions and is not financial advice.
Share your thoughts in the comments, and don’t forget to share this analysis with your friends! ❤️

Ethereum D1 Chart Update Hello Traders,
As you can see that there SBR Zone maintained with RSI DIV as long SBR zone maintained market remains Bearish for shorter Term
once market will break SBR and turned SBR to RBS the it will move towards 3500 or even 3900
Disclaimer: Forex is Risky

BTC/USDT – Retest in Play After Breakdown!Bitcoin broke below its 4H ascending trendline and is now showing signs of a retest at the broken trendline zone.
It tried to break the immediate resistance of $105,100 but couldn't sustain it.
📉 Breakdown confirmed
Key Levels:
Resistance: $105,968 | $108,941
Support: $101,539 | $97,205
Bearish Target remains near $97K if rejection holds
Watch how the price reacts here — rejection could lead to further downside. A break back above $105K may invalidate the move.
#Bitcoin #BTCUSDT #CryptoTrading #TechnicalAnalysis #TrendlineBreak #Retest #BearishSetup #PriceAction

BTCUSDT: Strong Risk-On Signal, Optimal Swing Above 103k__________________________________________________________________________________
Strategic Summary
__________________________________________________________________________________
Global bias : Dominant bullish structure, confirmed sector momentum, “risk-on” technical setting.
Opportunities : Favored swing entries above supports (103703.7–107019.9), breakout plays at 104865/106537.
Risk zones : Technical invalidation below 103703.7 or rapid ISPD DIV deterioration (red/orange zone + extreme selling volumes).
Macro catalysts : Rate, inflation/PCE, job numbers publication (48–72h) – to monitor closely for volatility pivots.
Action plan : Tight stops below supports, partial profit-taking on resistances, reduce exposure before key macro events, re-enter post-announcement on confirmed direction.
__________________________________________________________________________________
Fundamental & Macro Analysis
__________________________________________________________________________________
Favorable macro momentum (BTC, ETH, equity indices, institutional trust). Bull-cycle confirmation via technical triggers (bullish cross, MACD divergence).
Risks : Major token unlocks coming (3.3B+), on-chain euphoria (extreme profit/loss, exchange dominance >33%). Dynamic risk management crucial – swing stop-loss < 103703.7 is imperative.
Events to watch : US rates, inflation/PCE, payroll data – periods of heightened volatility expected, necessitating exposure adjustment.
Swing trade plan : Defensive entries on key supports, reduction pre-announcement, gradual profit-taking below 106537, then 109952.8/111949.
Risk/reward : Optimal for swing trades near supports, tactical management required for breakout chasing.
__________________________________________________________________________________
Multi-Timeframe Analysis
__________________________________________________________________________________
1D (Daily) : Bullish structure intact, key supports (107019.9, 81075.6). Risk On / Risk Off Indicator remains “Strong Buy”. No excess in volumes or behavior – buyers’ climate.
12H – 6H : Solid momentum above 103703.7–106537. Risk On / Risk Off Indicator still “Strong Buy”, ISPD DIV neutral, standard volumes.
4H – 2H – 1H : Pivot range (103703.7/104865/106537), buyer momentum, swing/scalp strategies favored. Supports to watch: 103703.7 (main stop trigger).
30min – 15min : Tight range (103703.7/104865), Risk On / Risk Off Indicator “Buy” (slightly weaker on 15min). Tactical scalping on bounce or pivot breakouts – risk zone if range breaks sharply.
Summary : Sectoral outperformance on all timeframes via the Risk On / Risk Off Indicator, ISPD DIV neutral, normal volumes. Key pivots: 103703.7 (support) and 104865/106537 (resistances) frame all action. Swing trading optimality as long as these levels hold.
__________________________________________________________________________________
Conclusion
__________________________________________________________________________________
BTCUSDT market remains bullish on all timeframes, supported by strong sector momentum (Risk On / Risk Off Indicator), steady volume and behavioral stability (neutral ISPD DIV). Preference remains for long strategies on support, with increased vigilance around macro windows (events, unlocks). Strict stop discipline and active profit-taking are key on extension moves.
__________________________________________________________________________________

LPT reversed a 3-month bleed — and I caught the reset candle.This isn’t noise. This is reversal.
LPT just completed a 96-bar, -86% bleed. But price didn’t just stop randomly — it formed a rounded base and exploded straight into a 1D breaker block, clearing internal structure and printing a clean power candle.
Now? Price is retracing.
We’re back into the 1D OB at 8.31 — aligning perfectly with the 0.618 fib retracement of the entire move. This is where price pauses, not reverses. And if Smart Money is still in control, this is where the next leg builds.
Targets are layered:
9.29 (0.5) is the first inefficiency reclaim.
10.28 (0.382) is the emotional level that marks continuation.
13.01 is the liquidity pocket — and the full draw.
This isn’t about whether price “goes up.” It’s about how price delivers.
Execution structure:
🟩 Entry: 8.31–6.91 (discount into 1D OB)
🎯 Target 1: 9.29
🎯 Target 2: 10.28
🎯 Final: 13.01
❌ Invalidation: sustained close below 6.12 (break of intent)
Everyone sees the candle.
Few understand the reclaim behind it.

Kurzer Recap der Tradeidee vom letzten THE LEAPTrade setzte auf eine Trendwende nach dem Abwärtstrend – klassisches Trendbruch-Szenario.
Decentralized AI Infrastructure in a trade war between US/ChinaThe AI revolution is real, but it has a critical weakness: GPU scarcity.
NVIDIA's H100s are sold out to specific countries around the world, serving as crucial hardware for AI development. Cloud costs are skyrocketing. Access to compute is being gatekept by Big Tech. Meanwhile, China is no longer allowed to purchase these GPUs from the US due to the ongoing trade war and the escalating AI arms race between the two countries.
Enter $CRYPTO: IONEUSD — a decentralized GPU network on Solana aiming to become the infrastructure layer for AI, machine learning, and high-performance computing.
Just like Helium tokenized wireless infrastructure, IO is tokenizing global compute power.
-AI is the fastest-growing sector globally, but compute remains the biggest bottleneck.
-Cloud GPU costs are 4–10x higher than decentralized alternatives.
-IO.Net positions itself at the intersection of AI, Web3, and tokenized infrastructure.
-IO is early in its growth curve, currently holding a market cap of $131 million.
I believe that IO.Net could represent a way for China to compete with the US in the AI race, offering a high-demand substitute for expensive and sanctioned chips — helping China stay competitive in AI development.
Because IO.Net is decentralized, it cannot be easily shut down. I believe IO.Net is here to stay and has strong potential to grow significantly from its current market cap of $131 million.
COINBASE:IOUSD
NASDAQ:NVDA
NASDAQ:AMD
NYSE:TSM
BITSTAMP:BTCUSD
BINANCE:SOLUSD
AMEX:SPY

$ETH Analysis — Correction Incoming?Summary:
After a strong ~100% rally in ETH, price hit a major resistance zone near $2734.78, triggering a significant sell-off, likely driven by algorithmic profit-taking. Now, the market is poised for a healthy correction before another potential leg up.
📉 What's Next for Ethereum?
🔍 Expecting a Correction of 7% to 25%
Based on technical structure and indicator behavior, ETH is likely to retrace to one of the two key zones:
✅ Primary Buy Zone ("Most Likely"): $2297.20
This zone aligns with previous structure support.
It’s where the price may form a higher low and resume its upward trend.
Ideal for opening a swing long with a tight risk-reward ratio.
🔥 Deeper Correction Opportunity: $1779.58
While less likely, a drop to this level would be a major long opportunity.
Aligns with historical demand and long-term support levels.
Also intersects with the yellow trendlines suggesting trend-based support zones.
📊 Why This Correction Makes Sense:
Weekly Money Flow Index (MFI) is Dropping:
MFI divergence suggests money is flowing out, weakening bullish momentum.
A trigger wave is forming, often preceding price corrections.
Algo Profit-Taking is Done:
Smart money likely exited around $2734.78 (highlighted in chart).
They’ll need to accumulate again at lower levels before the next rally.
📈 Potential Upside Targets:
If ETH respects the structure and finds support around $2297 or deeper, we could see a rally toward $3296.85 — a key Fibonacci extension and psychological level.
🧘♂️ Reminder:
No emotional entries. Let the price come to you. Trust the setup and stick to your plan.
📌 Disclaimer: This is not financial advice. Just a breakdown of my trading thesis. Always manage your risk.

BERA LONG SETUP📈 BERAUSDT Long Setup
Entries: 2 staggered entries for optimal fill
Targets: 2 Take Profits to secure gains
SL: Trailing Stop Loss to protect downside
Approach: Play it safe — structured, risk-managed move

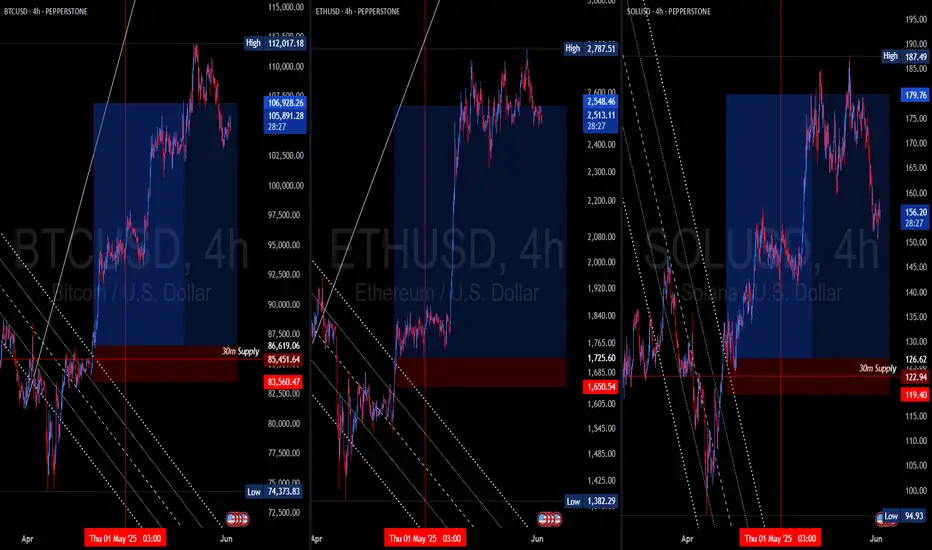
Bitcoin (BTC) Market Analysis1. Previous Analysis Validation
Our previous week's analysis played out perfectly, aligning well with the market movement.
2. Current Market Sentiment
The market remains bearish overall. However, we are seeing a short-term price pump, likely due to late short positions entering the market. This is resulting in a price move to trigger short liquidations. The recent 4H swing highs are acting as key stop-loss zones.
3. Imbalance & Rebalancing
The price is moving upward toward a daily imbalance area (highlighted in orange). We expect the market to rebalance in this zone, potentially leading to a price rejection and continuation of the downward trend.
4. Liquidity Zone
Our primary liquidity zone lies between \$100K and \$98K. We anticipate this area to be a key region for price reaction.
Bearish reversal?The Bitcoin (BTC/USD) is rising towards the pivot and could reverse to the 1st support.
Pivot: 107,412.53
1st Support: 102,164.07
1st Resistance: 111,566.95
Risk Warning:
Trading Forex and CFDs carries a high level of risk to your capital and you should only trade with money you can afford to lose. Trading Forex and CFDs may not be suitable for all investors, so please ensure that you fully understand the risks involved and seek independent advice if necessary.
Disclaimer:
The above opinions given constitute general market commentary, and do not constitute the opinion or advice of IC Markets or any form of personal or investment advice.
Any opinions, news, research, analyses, prices, other information, or links to third-party sites contained on this website are provided on an "as-is" basis, are intended only to be informative, is not an advice nor a recommendation, nor research, or a record of our trading prices, or an offer of, or solicitation for a transaction in any financial instrument and thus should not be treated as such. The information provided does not involve any specific investment objectives, financial situation and needs of any specific person who may receive it. Please be aware, that past performance is not a reliable indicator of future performance and/or results. Past Performance or Forward-looking scenarios based upon the reasonable beliefs of the third-party provider are not a guarantee of future performance. Actual results may differ materially from those anticipated in forward-looking or past performance statements. IC Markets makes no representation or warranty and assumes no liability as to the accuracy or completeness of the information provided, nor any loss arising from any investment based on a recommendation, forecast or any information supplied by any third-party.

BTC/USDT – Bitcoin 1 hour timeframe 📊 Technical Overview
🟢 Support Zone:
📌 Around $105,700
🛡 Marked by multiple bounces (white arrows), this zone shows strong buyer interest.
🔁 Historically acts as a springboard for upside moves 📈.
🔴 Resistance Zone:
📌 Range: $109,000 – $111,500
🚫 Every approach has triggered a sharp sell-off (black arrows), confirming this zone as significant supply.
🔄 Price Action & Pattern Insights
📉 Bearish Swings from Resistance:
Several high-wick candles followed by strong rejections ⛔
Downward arrows suggest a distribution phase near the top range
📈 Bullish Reversal Signals:
Price sharply rebounds from support 💥
V-shaped recovery setup in motion with a clean reaction from the demand zone ✅
Arrow projection hints at a potential full range recovery 🌈
📦 Box Range Formation:
Market has been consolidating in horizontal zones
Each zone acts as a base for accumulation or distribution 🧭
🎯 Trade Idea & Forecast
📍 Current Price: $105,793.35
📈 Projected Move: Upside rally toward $111,000+
🧠 Rationale:
Bounce from a major support zone
Prior similar price actions led to parabolic rises 🚀
No lower lows made – signs of a bottom forming 🪙
📌 Action Plan
✅ Long Setup:
Entry: Above $106,000
Target: $109,000 – $111,500
Stop Loss: Below $105,000
📉 Risk/Reward: Favorable (~1:3)
🚫 Bearish Alternative:
Breakdown below $105,000 with volume ❗
Target: $103,000 (next liquidity zone)
📎 Conclusion: Ready for a Bullish Comeback?
Bitcoin (BTC/USDT) is showing signs of a textbook bullish reversal 📘 after defending a key demand level 💪. If the current momentum holds, we could see a swift move back to the top of the range. Ideal for short-term buyers looking to ride the intraday wave 🌊.

ETHUSDT Breakout Watch: Bullish Momentum Brewing🧠 Chart Analysis Summary:
This chart suggests a bullish continuation is likely for ETHUSDT based on the current market structure and visual cues:
🔍 Key Observations:
Current Price Zone:
Trading around $2,574, inside a consolidation range (highlighted blue box).
Strong Supply Area Identified:
Around $2,335.93 (marked in purple) – acted as a solid demand/support zone fueling the current move.
Breakout Box:
The price is forming a rectangle pattern, indicating accumulation or consolidation before a breakout.
Bullish Projection Arrows:
Two projected paths show:
Minor dip toward the supply area followed by a bullish breakout 🚀.
Immediate breakout from the box towards resistance levels.
🎯 Target Levels:
First Target: 🟣 $2,918.70 – “possible next move”
Second Target: 🎯 $3,006.40 – strong resistance zone
🧩 Conclusion:
This setup suggests ETH may be preparing for a breakout from the consolidation zone. If bulls maintain control, we could see a rally towards $2,918 - $3,006 in the coming weeks.
Risk Tip: Watch for a fakeout if price dips below the consolidation range — especially near the $2,335 area.
🧠 Trading Tip:
Use volume confirmation and candle closes above the box to validate the breakout! 📊

PIXELUSDTThe outcome of this analysis is that based on the structure of a zero - D wave, which may be a pig or triangle, or even a pig, we should look for the optimal areas to buy Spot …
In the event that this analysis is correct, it may be ideal to purchase Spot in the vicinity of Beijing to the tribes.
A cautious target for the Chinese outbreak and a more risky target could be a dollar casualty.
In time terms too, mid - June and more accurately the beginning of the third week of June would be the ideal approximate time for the start of the DC wave …
As indicated in the chart late July and early September are important times in the chart that will probably work depending on the structure and my guess is that the mentioned times are the ideal time for the end of the larger D - wave …

Can Potentially move upwards from here?Bitcoin just created an inducement and it has been hunted. Now the structure is also broken and the inducement is also taken out. The market is in a discount zone, and there's an overlap of a Breaker Block and FVG (Fair Value Gap), which indicates that the market can potentially move upwards from here.
Wait for bullish confirmations here, such as MSS (Market Structure Shift), CISD (Change in Character/Continuation of Internal Structure Dynamics), and failed selling PD Arrays!
Do Your Own Research (DYOR)! This is not financial advice.

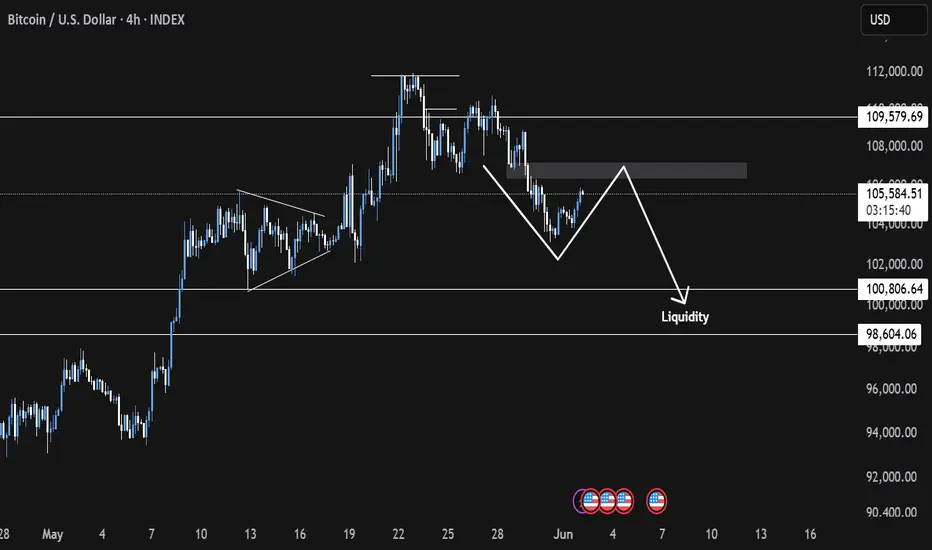
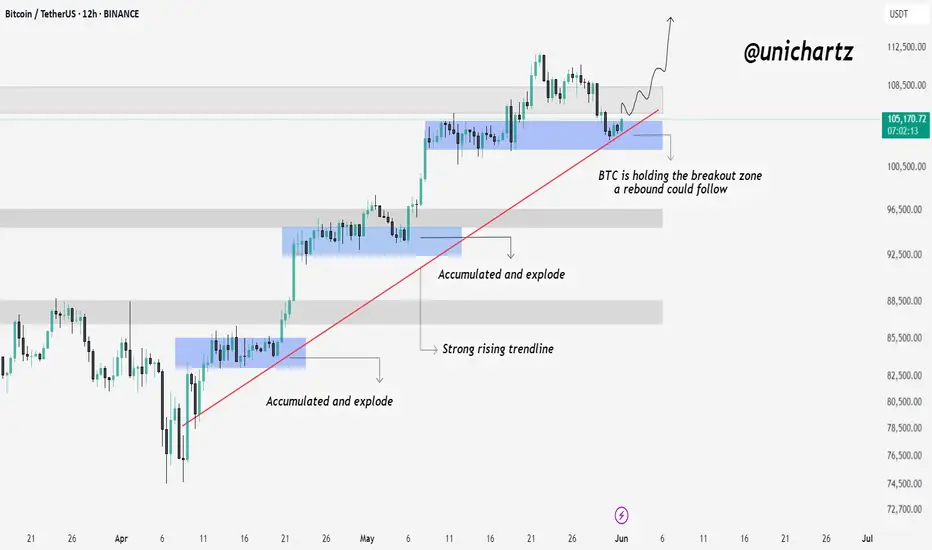
Bitcoin Retests Breakout Zone – Will It Bounce Again?Hello traders, here is the Quick CRYPTOCAP:BTC update
Bitcoin is currently holding right at the previous breakout zone, which also aligns with the rising trendline and previous accumulation area.
This zone has acted as a strong launchpad in the past — where BTC accumulated and exploded higher. If buyers defend this level again, we could see another rebound play out from here.
As long as BTC holds this structure, the bullish trend remains intact.
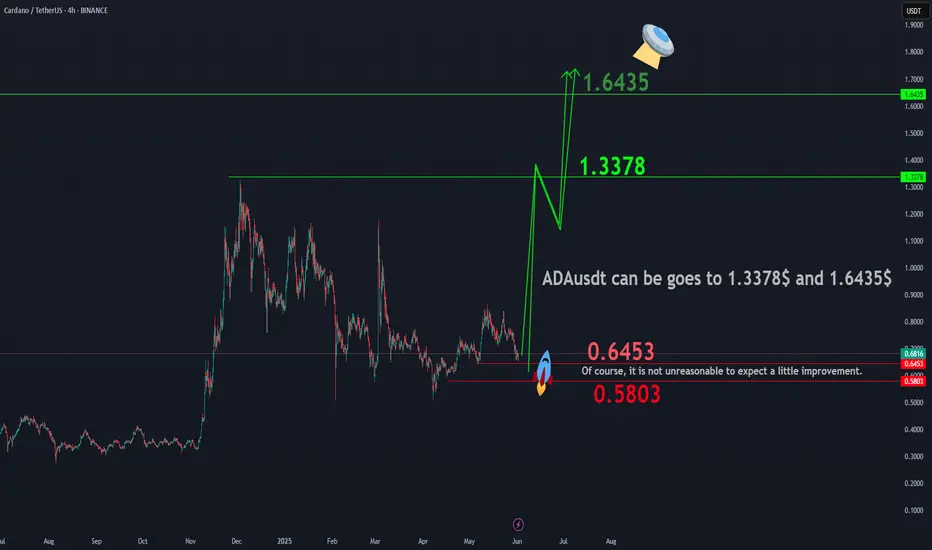
ADAUSDTBINANCE:ADAUSDT shows potential for an upward movement towards the targets of $1.3378 and $1.6435, making the current price zone attractive for long-term investment . While a correction towards $0.6453 or even $0.5803 is possible, these levels present favorable buying opportunities for investors with a long-term perspective. Even if a deeper correction occurs, the market geometry suggests that reaching the aforementioned targets is a likely outcome.
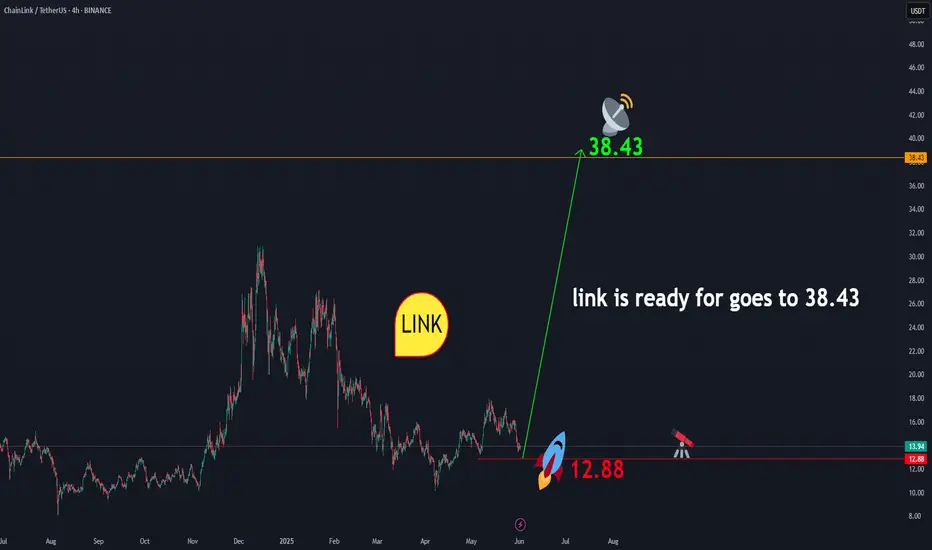
linkusdtLINK is showing readiness to initiate an upward movement towards $38.43. From the current price range of $13.93, a correction down to the $12 area is possible. This zone presents a favorable opportunity for long-term investment . In any case, according to the geometry that has formed in LINK, the price level of $38.43 is expected to be achieved. And this is certain.
BINANCE:LINKUSDT
Solana Long entry After a 100% move to the upside Solana is slowly cooling off its run and heading back down to some key areas of support .
In this video I highlight where I think those reaction zones are and what I expect to see Long term from Solana .
Set alerts and be sure to monitor BTC which will give you the additional confluence of understanding why the alt coins are behaving Bearish/bullish.
Tools used in this video TR Pocket / Fibs / Volume Profile /
Any Questions feel free to ask in the comments
