Algorand 5X Lev. Full PREMIUM Trade-Numbers (PP: 1500%)This is an unusual pair for us to approach with leverage, the last time we opened a LONG on ALGOUSDT was in August 2023. Market conditions are different today.
Back then, prices were trading at the bottom before the recovery, so we were predicting the trend reversal and bullish breakout. Today, the bottom pattern is already in, a rounded bottom coupled with a long-term higher low (April 2025 vs August 2024). So we are only predicting a continuation.
Needless to say, I believe the bulls have the upper-hand. The action right now is happening above the 3-Feb. low, and after more than a month of rising prices there is still no rising volume, which means that there is plenty of room available for growth.
We are doing an easy wave, easy targets. The final wave can go much higher than what is shown on this chart. Since we are not greedy, we are happy with 465% and 1,500%.
The 1,500% is a mild target and high probability.
The rest is up to you.
Thank you for reading.
Full trade-numbers below:
_____
LONG ALGOUSDT
Lev: 5X
Entry levels:
1) $0.2355
2) $0.2200
3) $0.2000
Targets:
1) $0.2564
2) $0.3247
3) $0.3800
4) $0.4352
5) $0.5138
6) $0.6139
7) $0.7243
8) $0.7926
9) $0.9031
Stop-loss:
Close weekly below $0.1900
Potential profits: 1502%
Capital allocation: 3%
_____
Namaste.
Cryptomarket

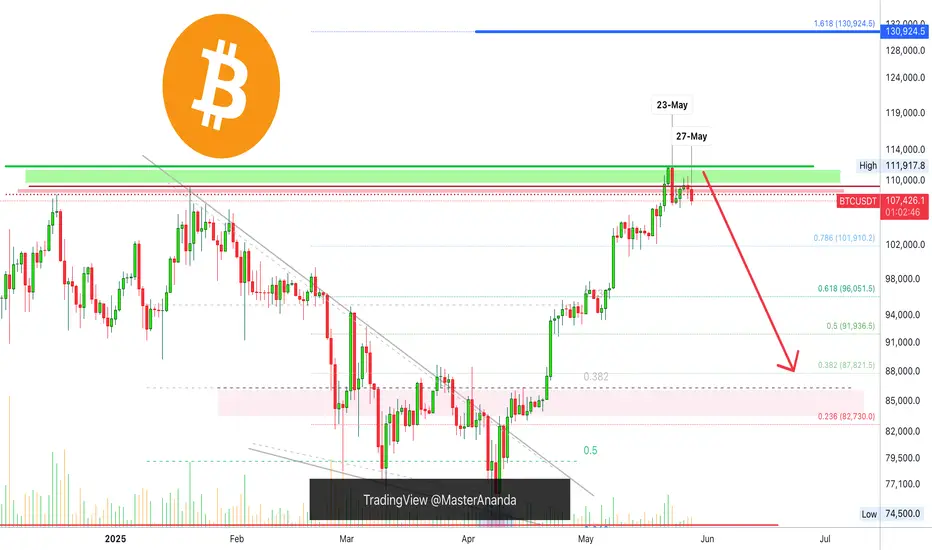
Bitcoin's Bearish Potential Explained Using Candlestick ReadingI will explain the chart as it is now based on candlestick reading and then add some additional information. The bearish bias short-term has been confirmed.
The green line marks Bitcoin's all-time high.
Dark red is the previous ath 20-Jan. 2025 and the dark red dotted line the high from 17-Dec. 2024.
Bitcoin (BTCUSDT) now trade below all three levels on a daily basis.
Right after the all-time high, 23-May, we have a full red candle.
The full red candle is a rejection as Bitcoin produced this new ath which is also a technical double-top.
After three days green, Bitcoin produces a lower high in the form of a Doji. 27-May. This Doji confirms the candle from 23-May.
Today, 28-May, Bitcoin produces a red candle as continuation of the action from 23 and 27 May.
Trading volume is super low.
Big institutions are buying and these always tend to buy at the top. The top means higher no more. A correction is upon us.
Resistance has been confirmed, how can Bitcoin turn bullish again short-term?
It needs to move and close above the all-time high on a daily basis. Anything lower and you can SHORT.
The fact that Bitcoin closed 7 consecutive weeks green, with the last few weeks become smaller, it is a sign of exhaustion, the market is looking for a relief.
A retrace can turn into a correction and if panic sets in a correction can turn into a crash.
It is still early though, but these things tend to unravel pretty fast.
Are you paying attention?
What will happen now?
A bullish trend is based on higher highs and higher lows. The bigger structure is not likely to break but, Bitcoin is going down, it doesn't matter if it is short or mid-term... Do what you have to do to protect yourself or secure profits. You can never go wrong by securing some profits when your pairs grew by 300 to 500%. If you are waiting for more, forever more, you are just a greedy ... trader.
Thanks a lot for your continued support.
Secure the win and forget the greed.
Win, win, win. And you will have the chance to play again.
Plan before buying. Develop a plan and use this trading plan to achieve trading success.
Whatever you do is up to you.
I am just reading the chart.
I left one question unanswered on purpose; How far down will it go?
Tell me in the comments, if you tell me your version I will tell you mine.
Thanks a lot for your continued support.
Buy and sell.
Sell, not hold.
Namaste.
ETHUSD - Consolidation Zone Analysis | Watch $2700 Breakout📊 Ethereum (ETHUSD) is currently trading within a consolidation zone between key support at $2458 and resistance near $2720 on the 1H timeframe.
🔹 Breakout above $2700 could indicate potential bullish momentum continuation.
🔻 Breakdown below $2450 may suggest bearish sentiment gaining control.
The price has been moving sideways, showing indecision and reduced volatility. Traders often monitor such range-bound phases for potential breakout opportunities in either direction.
⚠ This chart is for educational and analytical purposes only. It is not financial advice. Always do your own research and risk management.
---
🔖 Key Levels:
• Resistance: $2720
• Support: $2458
• Bearish zone under: $2500
#ETHUSD #Ethereum #CryptoAnalysis #TechnicalAnalysis #TradingView #PriceAction

WLD (Worldcoin) – Long Spot Trade Setup After 180% RallyAfter a massive 180% surge, WLD is showing signs of exhaustion and is likely to retrace toward the next major support zone. A pullback into the $1.22 – $1.35 area provides a favorable entry opportunity for continuation of the trend, assuming support holds.
🔹 Entry Zone (Support):
$1.22 – $1.35
🎯 Take Profit Targets:
🥇 $1.65 – $1.85 (prior consolidation and resistance zone)
🥈 $2.40 – $2.65 (upper range resistance / extension target)
🛑 Stop Loss:
Just below $1.10 (below structural support and invalidation level)

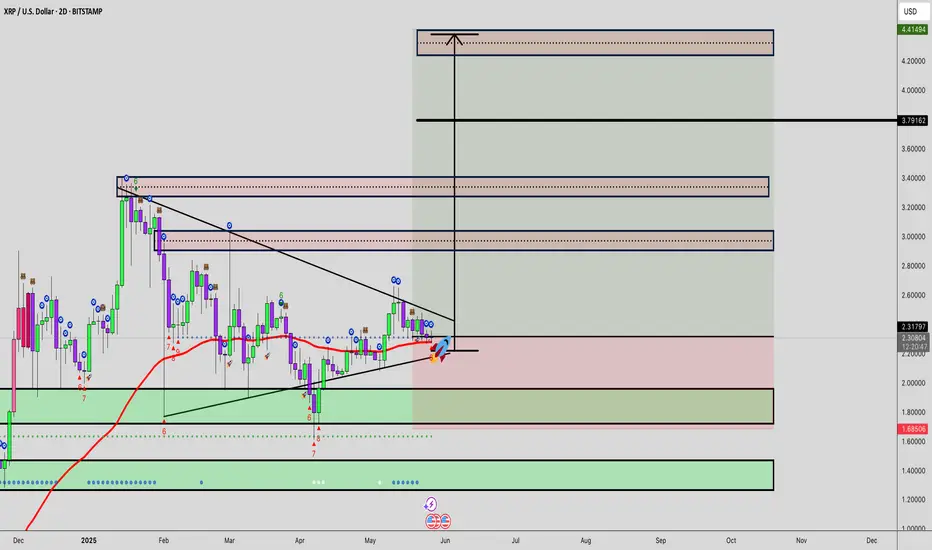
BULLMASTER PLAY – XRP/USD (1-Day)“Coiled price, loaded zones – when it pops, don’t blink.” 🐂
🔭 Big-Picture Structure
- Descending wedge** (white) compressing since Nov ’24 → stored energy.
- Demand Zone 2.15 – 1.97** (green) = 0.786 Fib **+ Major FVG** → institutional bid.
- Supply Zone 3.20 – 2.85** (crimson) caps every bull raid since Jan.
- Minor FVG 2.10 – 2.20** (teal) hugs wedge support – precision reload pad.
📈 Momentum Snapshot
- MACD hugging the zero-line → momentum fuel primed.
- RSI 14 carving higher lows while price prints flat lows → hidden bull div.
🎯 Battle Plan
| Setup | Trigger | Stop-Loss | TP1 | TP2 |
|------|---------|-----------|-----|-----|
| **Break & Ride** | Daily close **above 2.50** (wedge roof) | **1.99** (below Demand & Major FVG) | **2.92 $** | **3.41 $** |
*Risk ≤ 1 % per idea. Move SL to BE once TP1 prints.*
🗺️ Route Map
1. Expansion North – close > 2.50 → squeeze to **2.92**; acceptance → drive into **3.41** & upper Supply.
2. Fakeout & Sweep – rejection at roof → flush into **Minor FVG 2.10**; watch Demand 2.15 – 1.97 for bull reload.
3. Invalidation – full-body daily close **< 1.97** breaks wedge → bullish bias off.
---
⚠️ *Not financial advice. Plan the trade, size the risk, execute like a machine.*
Good hunting, legends! 💪🐂

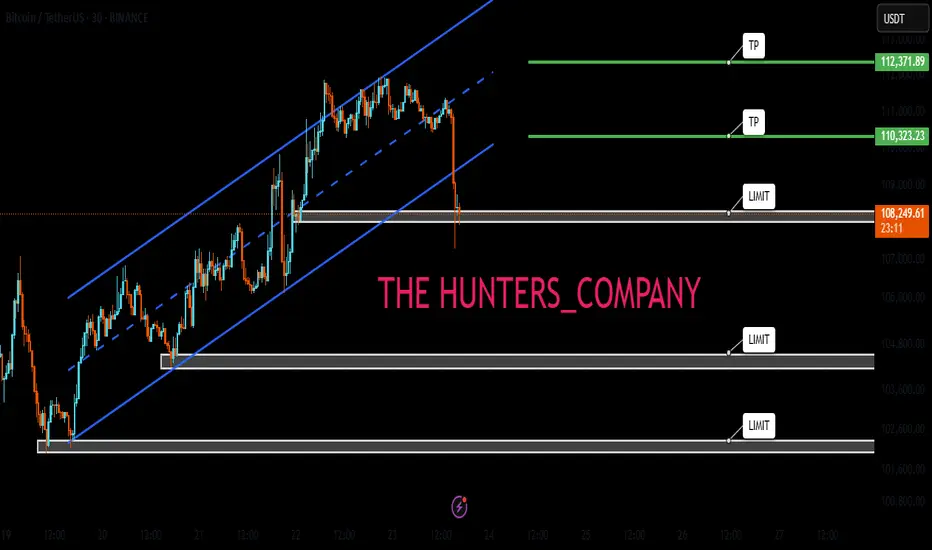
XRP/USD LONG SET UPTitle: XRP/USD (RIPPLE) BUY
Asset: Crypto
Symbol: XRP/USD
Market Entry Price 1: $2.28
Limit Entry Price 2: $2.08
Stop Loss: $1.88
Take Profit 1: $2.48 (close 10%)
Take Profit 2: $2.78 (close 25%)
Take Profit 3: $3.38 (close 50%)
Take profit 4: $3.88 (close 75%)
Take profit 5: $4.38 (close 100%)
Status: ACTIVE
TON on DailyFollowing an important distribution of TON, I have noticed how in the last period it is in a sideways phase, which could herald a Wyckoff accumulation.
Below I have made the relevant changes and included tickers so that you too can view them.
As always, you can copy and follow my setup.
Be careful out there.
Happy trading.

ETHUSD Trade Recap – +20R Hit ETHUSD Trade Recap – +20R Hit
As shared in my analysis yesterday, ETH played out perfectly.
🎯 Target was hit with precision
🔒 Executed with a tight stop-loss
📈 Final result: +20R gain
This trade was driven by structure, order flow confirmation, and disciplined execution. No guesswork — just clean setup + reaction + follow-through.
Thank you to everyone who followed the analysis. On to the next setup 👊
#ETHUSD #Crypto #TradeRecap #SmartMoney #OrderFlow #PriceAction #DisciplinePays #20R #TradingViewCommunity

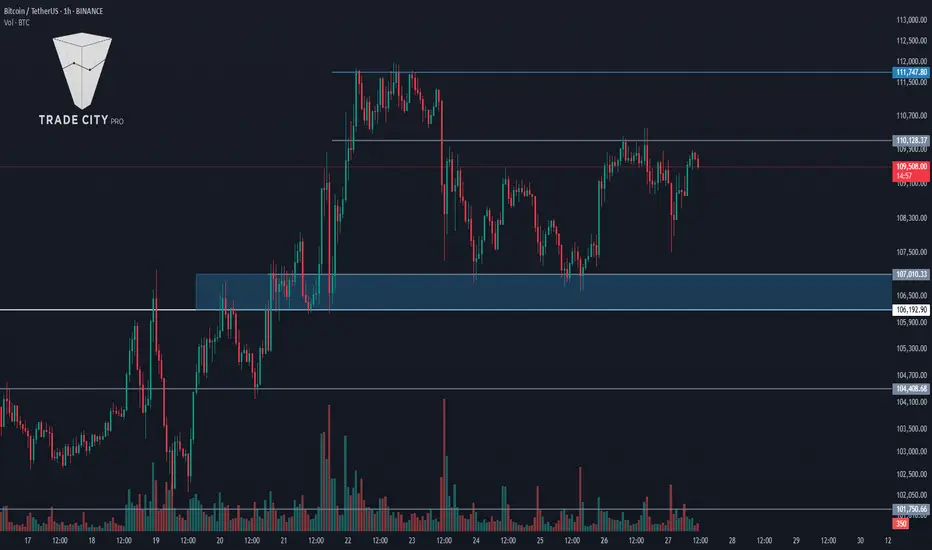
TradeCityPro | Bitcoin Daily Analysis #104👋 Welcome to TradeCity Pro!
Let’s dive into Bitcoin and key crypto indices. As usual, in this analysis I’ll walk you through the triggers for the New York futures session.
⏳ 1-Hour Timeframe
On the 1-hour chart, as you can see, Bitcoin was once again rejected from the 110128 level yesterday and is now hovering near 108237.
✔️ At the moment, price hasn’t yet touched the 108237 support. If it manages to stay above this level without breaking below, the chances of retesting 110128—and even breaking above it—increase.
🔍 If 108237 is broken, a short position could be considered. However, keep in mind that this setup goes against the current uptrend. As mentioned in previous analyses, the 106192–107010 range is a major support zone, and as long as price remains above it, the trend remains bullish.
📉 The main short trigger would be a break below this key support. If that occurs, it could introduce strong bearish momentum. An RSI break below 38.57 would serve as a momentum confirmation.
✨ During this pullback from 110128, market volume has been decreasing, which indicates the strength of the ongoing uptrend.
💥 If 110128 is broken, and considering the strong trend, a long position could be initiated. An RSI break above 50 would provide additional confirmation. The primary long trigger remains a break above 111747.
👑 BTC.D Analysis
Bitcoin Dominance continued to fall yesterday, reaching as low as 63.87. It has shown a slight bounce from that level and is currently in a mild upward correction.
⭐ If a lower high forms below 64.18, the chances of breaking below 63.87 increase. However, if the correction goes beyond 64.18, the probability of resuming the uptrend will grow.
📅 Total2 Analysis
Yesterday, Total2 was rejected from 1.24 and corrected down to 1.21. If price bounces from here and heads back toward 1.24, the chances of breaking that resistance will rise.
📊 If 1.21 fails to hold, a deeper correction toward 1.18 could follow.
📅 USDT.D Analysis
USDT Dominance is forming a lower high compared to 4.56. If this plays out and 4.49 is broken, it would confirm a bearish move.
⚡️ On the other hand, if 4.56 is broken to the upside, the move could extend toward 4.62.
❌ Disclaimer ❌
Trading futures is highly risky and dangerous. If you're not an expert, these triggers may not be suitable for you. You should first learn risk and capital management. You can also use the educational content from this channel.
Finally, these triggers reflect my personal opinions on price action, and the market may move completely against this analysis. So, do your own research before opening any position.

Bitcoin (BTCUSDT) - Consolidation Above Support Trendline -DailyBitcoin (BTCUSDT) price is currently consolidating above a trendline support level (between $107,000 and $109,000).
Bitcoin price has been in an uptrend throughout May 2025.
If Bitcoin price closes below $106,000 a pullback could occur down to $104,000 and $100,000.
Support Levels: $107K, $105K, $103K, $100K, $95K, $90K.
Resistance Levels: $110K, $112K, $120K, $130, $136K, $150.
Stock market correlations and corporate earnings could affect short-term price action for Bitcoin (e.g. S&P500, Nasdaq, Dow Jones, Nvidia, Dell, Marvell, etc).
Breaking News, corporate earnings and announcements, presidential and government law changes, and consumer sentiment can all affect the price of Bitcoin.

ApeCoin 369% Target Explained —Altcoins 2025 Bull MarketThis is an interesting pair. The entire Altcoins market is waking up now and gaining in bullish momentum. I just want to show you the target.
From the April bottom to present day, Apecoin has grown by ~100%, which is nice, solid, but there is great potential for additional growth.
The second target at 369% from current price, at the time of writing, would yield more than 840% from the April bottom. So if this isn't the 2025 all-time high, which I believe won't be, then the total growth potential for this bullish cycle is astonishing. It will be huge.
So far we continue to see and experience slow and steady growth, but soon, the Altcoins market will produce amazing growth. It will be something to experience, it is good now to buy and to hold LONG.
Namaste.

Pancake swing tradePancake is getting ready to release all the pressure that was build up inside of it.
we have vast amount of liquidity above us that we need to take.
Get ready! 🚀🌕
(You have the full responsibility for each action that u take because I'm not your financial advisor)

Ethereum - The bottom is finally in!Ethereum - CRYPTO:ETHUSD - is starting the rally:
(click chart above to see the in depth analysis👆🏻)
Finally, after dropping an expected -65% over the past couple of months, Ethereum is retesting and already rejecting a significant horizontal structure. Together with the strong confluence of support, Ethereum is now creating a long term bottom, initiating the next bullish cycle.
Levels to watch: $2.000, $4.000
Keep your long term vision!
Philip (BasicTrading)

Bitcoin: Will it surpass $109k in its upward trend?Since April, Bitcoin has traded in a clearly defined upward channel with two lower and upper trend lines. This channel was formed three touchpoints both on the lower and upper trendlines.
Near a critical zone
Now, BTC is at a key resistance zone where it previously peaked around $109,000, holding its all-time high. This level resists both judgement as well as forensic level significantly of a psychological barrier because it was the peak of the last major bull cycle. The price is currently hovering around the everyday resistance line while BTC is still in the upward channel. In conjunction with the historic all-time high and the upper channel resistance, range bound price action gives us an accurate capture of BTC’s behaviour.
Bullish breakout
The scenario outlined for this resistance zone makes the most sense as a rejection may lead to a temporary pullback, likely to the somewhat lower boundary of the rising channel. This in itself would not be the termination of the bullish trend, but instead a healthy retracement within the confines of an uptrend structure. But, if the market does break out above the $109,000 level with ample volume and bullish momentum, then things could start changing in the market for the better from there. Such breakout will confirm the uptrend is strong and valid where else new breakout targets will also be set turning the old high into new low. The $109,000 level would then probably move from resistance to support, making it a critical area for bulls to protect on any retests in the future.
A bearish breakout
The ramifications of a breakdown below the rising channel should also be understood by traders. It is crucial to keep an eye on the channel's lower barrier, which is presently at about $104,000. A significant decline below this level would signal a loss of short-term bullish momentum and lead to a more thorough correction. In that scenario, Bitcoin would probably go for the imbalanced area between $97,500 and $100,500, where the price has previously moved quickly without forming any solid support or resistance. Buyers may be able to intervene in this zone and try to restore bullish dominance, which may pave the way for a new breakout attempt and another surge toward the $109,000 barrier.
Conclusion
In conclusion, Bitcoin is at a critical point right now. Bitcoin is currently facing a significant resistance zone at its prior all-time high, but the upward channel that has directed price action since April is still in place. The degree of market momentum and the actions of buyers and sellers at these critical levels will determine whether the price hits new highs or declines. Investors and traders should be alert and ready for both situations since the next action could determine how Bitcoin develops over the following few weeks.
I appreciate your help.
To ensure you do not miss the upcoming analysis, be sure to follow me!
Please leave a remark and a like!

ETH 2025: $3000 is Key to Escaping Ethereum's Consolidation TrapEthereum (ETH) May Remain Consolidated Throughout 2025 if it Fails to Hit $3000: Here’s Why!
May 27, 2025 – Ethereum (ETH), the world's second-largest cryptocurrency, finds itself at a critical juncture. After a period of significant volatility and notable gains, ETH's price has entered a prolonged consolidation phase. While numerous bullish signals point towards a potential surge, a formidable barrier stands at the $3000 mark. Failure to decisively conquer this level could see Ethereum locked in a sideways trading pattern throughout much of 2025, deferring hopes of a new explosive bull run. This article delves into the intricate factors dictating Ethereum's price trajectory, exploring the tug-of-war between bullish aspirations and the stubborn realities of market resistance.
Section 1: The Current State of Ethereum - A Prolonged Consolidation
As of late May 2025, Ethereum continues to trade within a defined range, struggling to make a sustained break in either direction. The price has been attempting to pierce pivotal resistance zones, with recent attempts this month failing to hold despite decent volume. Some market observers note that Ethereum is currently consolidating between the $2,400 and $2,750 range. This period of consolidation is not unusual in cryptocurrency markets, often representing a "breather" after significant price movements or a period of price discovery as market participants digest new information and sentiment.
Historical chart patterns suggest that Ethereum may have entered a crucial price range, an "accumulation zone," which could prevent a significant breakout for several months. Certain technical indicators, which help identify trends when growth rates fluctuate, show ETH price entering bands that have historically preceded consolidation periods, sometimes lasting nearly a year, before the next major bullish wave. Given that ETH has already consolidated for approximately four months, another similar period could be on the horizon if key resistance levels are not breached.
This consolidation is a focal point for investors and analysts alike. On one hand, it can be seen as a period of building strength before the next upward move. On the other, prolonged consolidation can lead to investor fatigue and a potential drift lower if bullish catalysts fail to materialize. The market is currently in a state of anticipation, closely watching for signals that could indicate the end of this sideways movement. Ethereum's price is currently hovering in the mid-$2,500s, recovering slightly after brief consolidation and respecting key support levels.
Section 2: The $3000 Hurdle - A Critical Inflection Point
The $3000 level for Ethereum is more than just a number; it represents a significant psychological and technical barrier. A decisive break above this level would likely instill strong bullish sentiment, potentially paving the way for further gains towards previous highs and beyond. Conversely, a repeated failure to surmount $3000 could confirm the strength of the resistance, leading to a loss of upward momentum and an extended period of consolidation throughout 2025.
Market sentiment often coalesces around such round numbers. A breakthrough can trigger a fear of missing out, attracting fresh capital. Failure, however, can lead to disappointment and profit-taking, reinforcing the consolidation range. As of May 2025, ETH is expected by some to trade between $2,400 and $2,900, with a monthly close above $2,750 strengthening the case for retesting $3,000 in the coming quarter. Some projections suggest ETH might hover near the $3000 resistance in the summer months, potentially seeing profit-taking before a new range is established. If ETH fails to rise above the ascending trend line it has held since mid-2022, and with technicals like a potential bearish "Death Cross" (where a shorter-term moving average crosses below a longer-term moving average on weekly charts), the price could remain restricted below $2500 for a while, making the $3000 target even more challenging in the near term.
Section 3: Bullish Signals Amidst Consolidation - The Hope for a Breakout
Despite the consolidation, several bullish signals offer hope for an eventual breakout and a more dynamic 2025 for Ethereum.
Altseason Hopes
The term "altseason" refers to a market phase where alternative cryptocurrencies (altcoins) experience significant price surges, often outperforming Bitcoin. Ethereum, as the leading altcoin, plays a crucial role in signaling or even triggering such a season.
Recent technical analysis suggests that Ethereum has reclaimed a key technical level – the mid-line of a significant channel indicator on the two-week chart. This moving average-based band tracks long-term momentum. Historically, closing above this mid-line has preceded sharp price gains for ETH and marked the start of altseasons. For instance, after surpassing this mid-line in 2020-2021, ETH rallied dramatically. A similar pattern in late 2023 saw ETH climb significantly within a year. As of May 2025, the upper band of this channel represents the next significant resistance. A breakout above this could target previous cycle highs.
The impact on the broader altcoin market has also been historically significant. The combined market cap of altcoins (excluding ETH) surged considerably over a year after Ether's close above this channel's midline in past cycles. Some analysts suggest that ETH reaching certain key levels could signal the potential onset of an alt season.
Bitcoin Dominance and Altcoin Market Cap
The prospect of a 2025 altseason is further supported by patterns related to Bitcoin dominance – Bitcoin's market share of the total crypto market capitalization. Historically, after Bitcoin halvings, Bitcoin dominance tends to drop sharply, triggering altcoin rallies. This was observed in previous post-halving periods. With the latest halving in April 2024, a similar period is approaching, and a decline in Bitcoin dominance could occur within the next few months. If this trend repeats, some market observers anticipate the altcoin market cap could surge toward substantially higher figures. A falling Bitcoin dominance implies that capital is shifting from Bitcoin to altcoins, making them the market's primary focus.
Technical Formations
Several bullish technical patterns are currently visible on Ethereum's charts:
• Ascending Triangle: Ethereum's price action has been forming an ascending triangle pattern, characterized by a horizontal resistance level and a rising support line. This pattern typically indicates that buyers are gaining strength, pushing prices to higher lows against a flat resistance. A breakout above the horizontal resistance of this pattern could lead to a significant upward move.
• Inverse Head and Shoulders: Some analysts have identified an inverse head and shoulders pattern on daily trading charts, a classic bullish reversal pattern. The neckline of this pattern is cited around the $2,700 mark. A decisive close above this level could confirm the breakout, with an immediate target of $3,000.
• Bull Flag: On the daily chart, Ethereum appears to be forming a bull flag pattern, which is a bullish continuation pattern that typically follows a strong rally. The current sideways price action forms the flag, and a breakout could lead to a significant price increase.
• Bullish Market Structure: Despite the consolidation, the broader market structure for Ethereum can still be interpreted as bullish, with the potential for consecutive higher highs and higher lows to remain intact if key support levels hold. ETH trading above its key Exponential Moving Averages (EMAs) indicates a strong technical structure.
Analyst Sentiment
Market observers are cautiously optimistic, with many eyeing the $3,000 level as the next major milestone. Some predict that if Ethereum stays above $2,550, a breakout toward higher levels is likely in the near term. Holding above $2,500 is seen as crucial. If bullish momentum persists and broader crypto sentiment remains favorable, ETH could target the $4,000–$4,500 range later in 2025. Institutional interest, evidenced by spot Ether ETFs attracting inflows and Ethereum's growing market capitalization, also underpins a positive outlook.
Section 4: The Bearish Undertones - Risks and Fragility
Despite the array of bullish signals, Ethereum's path is not without significant obstacles and inherent fragilities.
Substantial Supply Near Cost Basis
A concerning factor highlighted by on-chain data is the substantial amount of Ethereum supply acquired near the current price levels. Analysis of blockchain data indicates that a very large volume of ETH supply, valued in the tens of billions of dollars, is near its cost basis and at risk of flipping into a loss if prices dip. This creates a precarious situation. If ETH's price were to fall below these investors' average acquisition price, it could trigger a wave of selling as holders try to minimize losses or break even. This sell-side pressure could exacerbate any downward trend or prolong the consolidation phase. There is also a significant cluster of investor cost-basis distribution around the $2,800 price level, implying potential sell-side pressure as ETH approaches this zone from investors looking to offload assets near breakeven.
Stubborn Resistance Levels
Ethereum is currently coiling under significant resistance. The $2,700 level has proven to be a formidable barrier, with ETH facing rejections multiple times in May. This level represents a key hurdle for bulls. Failure to convincingly break above $2,700, and subsequently $2,800 and the ultimate $3,000 target, could see selling pressure intensify. Each failed attempt can strengthen the perception of these levels as a ceiling, encouraging more traders to sell at these points.
Macroeconomic and Market-Wide Factors
The broader cryptocurrency market is susceptible to macroeconomic headwinds. Factors such as interest rate policies from central banks, regulatory developments, and global economic stability can significantly impact investor sentiment and capital flows into riskier assets like cryptocurrencies. While some anticipate potential interest rate cuts later in 2025 which could be bullish, ongoing quantitative tightening could pose a challenge. Bitcoin's dominance, while potentially set to fall, has also surged in early 2025, overshadowing altcoins for a period and reflecting a "risk-off" environment at times. Any negative shifts in these broader conditions could dampen Ethereum's breakout prospects, regardless of its specific technical or on-chain signals.
Section 5: Why Failure to Hit $3000 Could Mean Extended Consolidation in 2025
The $3000 mark is a critical psychological and technical threshold for Ethereum. Should the cryptocurrency fail to breach this level decisively in the coming months, several factors could contribute to an extended period of consolidation throughout 2025.
• Loss of Upward Momentum: A failure to achieve a widely anticipated price target like $3000 can significantly dampen investor enthusiasm. Bullish momentum is often self-reinforcing; when it stalls at a major resistance, the energy can dissipate, leading to a more cautious or bearish sentiment. Traders who bought in anticipation of a breakout might exit their positions, adding to selling pressure.
• Strengthening of Resistance: Each time a price level like $3000 (or even preceding levels like $2,700-$2,800) successfully repels an upward advance, it becomes a more established and psychologically potent resistance zone. More market participants will view it as a ceiling, placing sell orders around it, thus making future breakouts even more difficult.
• Capital Rotation: If Ethereum's price remains stagnant while other cryptocurrencies or asset classes show more promising returns, capital may flow out of ETH. Investors are constantly seeking the best risk-adjusted returns, and a prolonged consolidation in ETH could lead them to look for opportunities elsewhere in the dynamic crypto space or even in traditional markets.
• Investor Fatigue and Profit-Taking: Extended periods of sideways movement can lead to investor fatigue. Those who have been holding ETH through the consolidation might become impatient and decide to sell, either to lock in existing profits (if any) or to free up capital for other ventures. This is particularly true for the significant portion of supply bought near current price levels, where the desire to break even can lead to selling pressure if upward momentum wanes.
• Confirmation of Historical Patterns: As mentioned earlier, historical chart patterns suggest that Ethereum can enter extended consolidation phases before major bull runs. A failure to break $3000 would align with these historical precedents, suggesting that the market might indeed be settling in for a longer period of range-bound trading.
• Impact on "Altseason" Narrative: Ethereum's performance is often seen as a bellwether for the broader altcoin market. If ETH struggles to break key resistance and enter a clear uptrend, it could delay or diminish the prospects of a widespread "altseason," further contributing to a more subdued market environment for ETH itself.
Essentially, a failure at $3000 would signal that the current buying pressure is insufficient to overcome the selling interest at that level. This equilibrium could persist for an extended period, leading to the price oscillating within a defined range as bulls and bears remain in a deadlock. Until a significant catalyst emerges – be it a major network upgrade with immediate perceived value, a shift in macroeconomic conditions, or a surge in institutional demand that overwhelms sellers – Ethereum could find itself tracing a path of consolidation through 2025.
Section 6: Scenarios for 2025
Looking ahead, Ethereum's trajectory in 2025 largely hinges on its ability to overcome the current consolidation and the critical $3000 resistance. Several scenarios could unfold:
Scenario 1: Breaching $3000 and Igniting a Bull Run
This is the optimistic scenario favored by many ETH proponents.
• The Breakout: Ethereum successfully smashes through the $2,700-$2,800 resistance zone and then decisively conquers the $3000 psychological barrier. This breakout would likely be accompanied by a surge in trading volume, confirming strong buying interest.
• Targets: Once $3000 is overcome, analysts eye targets such as $3,200, $3,500-$3,600, and previous cycle highs around $4,100. Some even more bullish long-term predictions based on chart patterns suggest significantly higher targets if momentum is sustained.
• Altseason Trigger: A strong ETH rally, particularly one driven by reclaiming key technical levels, could indeed trigger a wider altseason. This would see significant capital flow into other altcoins, potentially leading to a massive altcoin market cap surge if Bitcoin dominance concurrently falls.
• Market Sentiment: Overall market sentiment would turn decisively bullish, fueled by positive price action and the realization of long-awaited breakouts. Institutional interest would likely further increase.
Scenario 2: Failure at $3000 and Continued Consolidation Throughout 2025
This scenario represents the central thesis of this article – a prolonged period of sideways trading.
• The Rejection: Ethereum makes attempts to break $3000 (or even struggles to consistently hold above $2700-$2800) but is repeatedly met with strong selling pressure. The price fails to establish a sustained uptrend above these key levels.
• Trading Range: ETH would likely continue to trade within a familiar range, potentially bounded by support levels around $2,300-$2,500 and resistance capping gains below $3000. This range could persist for a significant portion of 2025.
• Investor Sentiment: Investor sentiment would likely become mixed and potentially frustrated. While long-term believers might continue to accumulate, shorter-term traders could become disengaged due to a lack of volatility and clear direction. The "wait-and-see" approach would dominate.
• Impact on Altcoins: A stagnant Ethereum could dampen enthusiasm for a broad altseason, leading to more selective and narrative-driven gains in the altcoin market rather than a widespread euphoric rally.
Scenario 3: A Bearish Breakdown
While many signals are bullish or neutral (consolidating), a bearish breakdown remains a possibility, especially if broader market conditions deteriorate or if key supports fail.
• Support Failure: Key support levels, such as $2,450, $2,300, or even the psychological $2,000 mark, are breached decisively. This could be triggered by the large supply near cost basis flipping into loss and causing a cascade of selling.
• Negative Catalysts: This scenario could be exacerbated by negative macroeconomic news, stringent regulatory actions, or unforeseen issues within the Ethereum ecosystem.
• Price Action: A bearish breakdown would see Ethereum enter a downtrend, potentially revisiting lower support levels from previous market cycles. Technical indicators like a "Death Cross" on weekly charts, if confirmed, would add to bearish sentiment.
• Market Sentiment: Fear and uncertainty would grip the market, leading to a flight to safety, possibly increasing Bitcoin dominance or a move towards stablecoins.
•
The most probable outcome will depend on a confluence of technical breakouts, fundamental developments within the Ethereum ecosystem (like the impact of future upgrades), institutional adoption trends, and the overarching macroeconomic environment.
Section 7: Conclusion
Ethereum stands at a pivotal moment in May 2025. The allure of a significant rally towards $4,000 and beyond, potentially heralding a new altseason, is palpable, supported by historical precedents and bullish chart patterns. However, the path is fraught with challenges, most notably the formidable psychological and technical resistance clustered around the $2,700 to $3,000 levels.
The current consolidation phase, while potentially a healthy accumulation period, also carries the risk of morphing into prolonged stagnation if upward momentum cannot be decisively seized. The significant volume of ETH supply hovering near its cost basis presents a tangible threat, where a dip could trigger further selling pressure, reinforcing the consolidation or even leading to a decline.
Therefore, the central thesis holds considerable weight: should Ethereum fail to convincingly breach the $3000 mark in the coming months, it is highly plausible that the cryptocurrency could remain locked in a consolidative pattern for much of 2025. This would test the patience of investors and potentially delay the much-anticipated fireworks of a full-blown altseason.
The cryptocurrency market is notoriously dynamic and influenced by a myriad of unpredictable factors. While technical analysis and on-chain data provide valuable insights, they are not infallible crystal balls. Investors and traders must remain vigilant, continuously reassessing the evolving landscape, managing risk, and preparing for various potential outcomes as Ethereum navigates this critical juncture. The battle for $3000 will likely define ETH's narrative for the remainder of the year.

How To Spot The Next Big Algorand Crypto Move!In the fast-paced world of crypto trading, many traders gravitate toward intraday and scalping strategies, chasing quick profits while often ignoring the powerful signals presented by higher timeframes. Yet, the smart money — institutional players, whales, and seasoned swing traders — operate differently. They focus on bigger timeframe supply and demand imbalances to enter high-probability trades with calculated risk and substantial reward potential. One such opportunity is currently setting up in Algorand ( BINANCE:ALGOUSDT ).
Why Higher Timeframes Matter in Crypto Trading
Most crypto traders operate on the 1-minute to 15-minute charts. While this can be effective, especially with crypto intraday strategies, it often leads to overtrading and emotional decision-making. In contrast, higher timeframes — such as the daily and weekly charts — provide clearer market structure, show major supply and demand imbalances, and are less noisy.
These timeframes reveal where whales and institutions place large orders, creating impulsive moves that leave behind clues for patient traders. Ignoring these clues is akin to trading blind.
The Weekly Demand Imbalance on BINANCE:ALGOUSDT
BINANCE:ALGOUSDT is currently showcasing a textbook example of a solid and strong weekly demand imbalance around the $0.1380 level. A few months ago, this zone sparked a massive bullish impulse — a series of consecutive large-bodied white candlesticks that broke through resistance with conviction.
Such moves don’t happen randomly. They’re often the result of institutional accumulation — smart money stepping in with size. These large players create imbalances where demand far outweighs supply, causing prices to rally aggressively. The key for retail traders is to identify the origin of these moves and wait patiently for the price to return.

BITCOIN SIGNALS (DON'T MISS)Hello friends
Given the good price growth we had, you can see that the price has entered a correction and has provided us with a good opportunity to buy in steps in the specified support areas (of course with capital management)
The targets have also been specified...
*Trade safely with us*
TradeCityPro | Bitcoin Daily Analysis #103👋 Welcome to TradeCity Pro!
Let’s dive into Bitcoin and key crypto indices. As usual, in this analysis I’ll walk you through the triggers for the New York futures session.
⏳ 1-Hour Timeframe
As you can see on the 1-hour chart, Bitcoin was rejected from the 110128 resistance yesterday and began a pullback, but it didn't reach the support at 107010 — instead, it formed a higher low and is now moving back toward 110128.
📊 Buy volume during this bullish leg has been relatively low, which isn’t ideal for a strong uptrend and indicates potential weakness.
📈 If the 110128 resistance breaks, a long position can be considered. However, if you take this trade, I suggest not setting your target at 111747 — instead, aim for higher targets and hold the position longer.
💥 The main long trigger remains at 111747. So if you missed or don’t want to trade the 110128 breakout, you can wait for this higher confirmation.
🔽 As for short setups, just like yesterday, it's still better to wait for a trend reversal. As long as the price remains above the support zone, the uptrend remains intact.
👑 BTC.D Analysis
Bitcoin Dominance broke above 64.32 yesterday but failed to hold and fell back below it, also breaking the 64.18 support. It’s now moving toward 63.97.
⭐ Currently, there is strong bearish momentum in BTC.D, and if 63.97 is broken, this downward move is likely to continue.
📅 Total2 Analysis
Total2 printed a higher low above 1.18 and has now broken above the 1.22 resistance.
✨ If it can hold above this level, we could see an upward move toward 1.26. For bearish confirmation and short positions, a break below 1.18 would be the key trigger.
📅 USDT.D Analysis
USDT Dominance printed a lower high compared to 4.62 and is now sitting on support at 4.49. A break below this level could push the dominance down to 4.38.
🎲 To confirm a bullish reversal in USDT.D, we would need to see a break above 4.62.
❌ Disclaimer ❌
Trading futures is highly risky and dangerous. If you're not an expert, these triggers may not be suitable for you. You should first learn risk and capital management. You can also use the educational content from this channel.
Finally, these triggers reflect my personal opinions on price action, and the market may move completely against this analysis. So, do your own research before opening any position.
LongTerm BITCOIN LINEAR chart & NUPL tells a story -August Top
We can start with the main chart.
This is a LONG TERM LINEAR chart, showing the price action Directly, unaltered by mathmatics,
Long Term charts usualy are shown by logarithmic charts.
Linear and logarithmic trading charts differ in how they represent price changes. Linear charts display equal price changes the same, making them suitable for short-term traders focusing on exact price movements. On the other hand, logarithmic charts show percentage changes, which makes them better for long-term investors or volatile assets, as they help in analyzing trends and patterns more clearly over time.
This chart starts just before the 2017 ATH and you can easily see the line that rejects ATH and how PA is up near that area right now.
Things to note are the day count from 2017 ATH to 2021 Final ATH and the day count between that double Top in 2021.
These numbers are projected to our current cycle and show we are near the projected Top using this style of Chatr, The Log charts project further into the year.
It may also be worth noting how the 50 EMA (red) was used by PA after the Drop after the first ATH, to bounce back up to the next ATH at the end of that year.
We have just done exactly the same again, PA was rejected by that long term Line and Dipped down to the 50 EMA and has since bounced back up to the rejecting line.
IS REJECTION LIKELY NOW? [/b
This is something that is impossible to answer with any real Fact But we can look at data and make eductaed projections.
PA has the ability and strength right now, to range high, running up under this line of rejection until it becomes overbought on the long term MACD, RSI , TSI etc
But something that will absolutely decide when the top is in is the Profit taking by Holders.
We are currently seeing Selling taking place and we can see the potential profit by looking at NUPL
NUPL, or Net Unrealized Profit/Loss, is an indicator used in trading to measure the difference between unrealized profits and losses in the Bitcoin market.
Here is the chart from all the way back to 2010
Lots to see here but to summerise.
See how there are Peaks each cycle of Maximum available profit. The point where profit taking Tops out is arrowed. This area, up to the red line, shows us the TOP zone.
What is VERY noticable this cycle is how we have not yet reached that upper Red line.
Sellers appear to be taking theor profits earlier.
The upper day counts have been consistant in the past, with 2 double tops of potential profit before the selling sold it all off.
Many people, including me, have been saying "This time is different" and this is VERY clearly shown here by the fact that we have already had the 2 peaks of potential profit and we are currently climbing to the 3rd
This has NEVER happened before and, technicaly, this could continue.
The Lower day counts are from Mid Double Tops to the Next Mid double top of potential profits mentioned above,
The Next "Mid point" is projected to be around July.
This NUPL also shows ua how the high level of potentia profits was reached Quicker this cycle than previously. This was helped by the Corporations buying Early and Massive amounts, putting Large numbers of coins into profit
In Conclusion [/i
We have the Linear Bitcoin chart pointing towards a JULY / August Top
We have the NUPL also pointing towards a July / August Mid point of Potential profits.
If you loo cloely, BOTH charts, using differnet data, suggest 28 July
What also maybe worth considering here is how we see that Potential profits are reducing in availability. As the asset becomes more expensive to buy, it also gets harder to push the price higher and so make more profit. I,E. It was eaier to double the price of Bitcoin when it was $50 a coin
Of course, non of this may play out, Things ARE DIFFERNT but I have now decided to have another plan ready for August and we need to wait and see what happens Next
BE PREPARED FOR ALL POSSIBILITIES

HMSTR/USDT NEW BREAK ON WAYHMSTR/USDT has good chance to get a new break in the coming time frames, there are some trend data that shows that HMSTR/USDT has a good change for new time frame confirmation

Where to Look Today: 5 Hot Crypto Sectors with Real UtilityHello traders and investors!
These five sectors are seen as the most promising areas for crypto market development. Each represents real blockchain applications, not just speculation: they enable simpler, faster, and cheaper access to finance, data, and computing power. Based on them, you can build a diversified crypto portfolio. Each sector offers unique drivers—from real-world assets to AI. This selection helps you navigate trends and pick promising tokens according to your strategy and investment horizon.
1. Real-World Assets (RWA)
What it is: Real assets—such as bonds, real estate, or commodities—are digitized and issued as tokens on the blockchain. These tokens can be bought, sold, used as collateral, or integrated into DeFi applications.
Why it’s growing: Institutional players (funds, corporations, DAOs) are seeking reliable yield and transparency. Over $7 billion has already been invested in tokenized US Treasuries.
Top tokens:
ONDO: Token of Ondo Finance: offers access to tokenized funds, including U.S. Treasuries from BlackRock.
CFG: Token of Centrifuge: connects real assets (invoices, equipment, real estate) to DeFi, allowing companies to receive financing.
POLYX: Token of Polymesh: a blockchain specialized in securities tokens, with a focus on regulation and compliance.
RIO: Token of Realio: merges traditional assets (e.g., real estate) with DeFi and private equity potential.
2. Ethereum Layer-2 / Rollups
What it is: Layer-2 networks (Optimistic and ZK-rollups) process transactions separately and then send them to Ethereum in batches. This lowers load, speeds up the network, and reduces fees.
Why it’s growing: Layer-2 scales Ethereum without compromising security. Transactions become cheaper, dApps faster, and startups/corporates can build without overloading the base layer.
Top tokens:
ARB: Token of Arbitrum, the largest Optimistic Rollup network.
OP: Token of Optimism, which is being integrated into various partner projects and DAOs.
zkSync: Layer-2 platform based on ZK-rollups, focused on scalability and privacy. Native token: ZK.
STRK: Token of StarkNet, one of the most advanced ZK-based solutions.
3. Restaking & EigenLayer Ecosystem
What it is: If you’ve already staked ETH, you can reuse it by delegating it to EigenLayer, which lends it to other protocols. If they act honestly, you earn extra yield. This is restaking.
Why it’s growing: One ETH can now generate multiple streams of income. Restaking increases capital efficiency and supports a new ecosystem of reliable services that don’t need their own security. Total Value Locked (TVL) has already exceeded $15 billion, and the EIGEN token has just launched.
Top tokens:
EIGEN: Native token of EigenLayer.
ETHFI: Ether.fi platform issues eETH and enables restaking without transferring ETH custody to third parties.
PUFFER: Protocol offering pufETH—a token for restaking in EigenLayer. It features enhanced protection from price manipulation and MEV (Maximum Extractable Value) front-running, focusing on security and restaking yield optimization.
RSETH: Token from KelpDAO earned via restaking through EigenLayer. It's a liquid equivalent of a staked token, usable in DeFi apps while your ETH keeps working.
4. Yield Tokenization
What it is: Splitting an asset into two parts: principal and future yield. This lets you sell or buy just the yield the asset will generate.
Why it’s growing: It brings flexibility to financial planning. Users can lock in returns or buy discounted yield. A bond-like market within DeFi emerges. Traders, funds, and DAOs benefit from flexible and strategic income management.
Top tokens:
PENDLE: Sector leader; supports yield trading from crypto assets (e.g., stETH) and tokenized RWAs. Enables separating "principal" and "interest" to trade them independently—like selling a bond coupon without selling the bond itself.
ELEMENT: Allows trading fixed and variable yields. Users can split a yield-bearing token (like an LSD) into two parts—one entitled to yield, one not.
SWIVEL: Designed for institutional clients: supports KYC/AML and packages deals as fixed-rate, long-term bonds, easily understood by funds and treasuries. Works with crypto assets (e.g., staking and DeFi tokens) but presents them in traditional finance format.
5. AI & Decentralized Compute
What it is : Projects at the intersection of AI and blockchain: decentralized rendering, GPU power exchange, model training, and data sourcing.
Why it’s growing: Decentralized compute enables AI scaling without centralized cloud dependence. It boosts privacy and global access to AI infrastructure.
Top tokens:
FET: Fetch.AI: platform for creating "smart agents" — AI that can autonomously negotiate, buy or sell services and data. Entirely blockchain-based and mediator-free. Promising for automation in logistics, smart cities, and data economy.
TAO: Token of Bittensor: a network where thousands of participants train and share AI models. TAO is used for payments, rewards, and governance. Think of it as "Bitcoin for neural networks."
RNDR: Render Network connects users with spare GPU power to those who need rendering. A decentralized cloud-rendering system paid in tokens. In demand for 3D, film, and metaverses.
GRT: The Graph helps find and structure data from decentralized apps. Like Google for Web3—essential for the growing Web3 ecosystem.
Each of these sectors reflects real utility and demand for blockchain innovation. Following them may help you form a future-proof, high-conviction crypto portfolio.
Wishing you profitable trades!

TradeCityPro | AVAX: Watching Key Resistance in RWA Uptrend👋 Welcome to TradeCity Pro!
In this analysis, I’ll be reviewing the AVAX coin — one of the popular RWA projects in crypto with a high market cap.
🔍 This coin currently has a market cap of $9.94 billion and ranks 14th on CoinMarketCap.
⏳ 4-Hour Timeframe
As shown on the 4-hour chart, there’s a clear ascending trendline that has been tested several times. There was also a fake breakout below the trendline, and now price is reacting to it once again.
⚡️ A resistance level has formed at 23.90, which the price has reacted to. Given the recent bounce off the trendline, the probability of breaking 23.90 has increased.
✔️ A break above 23.90 offers a potential long entry, though this isn’t the main long trigger. The target for this move would be 25.78. The main long position should be considered after a breakout above 25.78.
💥 The 25.78 zone is a key resistance level that marked the top of previous bullish legs, so breaking it could lead to a strong bullish trend.
🔽 On the flip side, if the price prints a lower high below 25.78 and moves back toward the trendline, the probability of breaking the trendline increases.
✨ If the trendline breaks, the confirmation trigger would be 22.10. A break below 22.10 opens a short setup, with the next support level located at 19.23.
📊 Currently, market volume is favoring the buyers. With renewed buying volume off the trendline, if this momentum continues, the bullish scenario becomes more likely.
📝 Final Thoughts
This analysis reflects our opinions and is not financial advice.
Share your thoughts in the comments, and don’t forget to share this analysis with your friends! ❤️

CETUS Hack Giving Opportunities Within SUICRYPTOCAP:SUI SUI is one of the fastest growing L1 chains. Previously extreme intra SUI dominance within swapping volume by KUCOIN:CETUSUSDT CETUS. This hack is a direct threat to the confidence of not just the application but the chain itself just like Ethereum was exposed during the MakerDAO hack.
Volume market wants to know their funds are secure to certain degree and predictable. Volume flow is more than fine with centralisation, esp with low barriers. Should the deposits be mostly secured and exploit fixed then it can bring confidence roaring back not just to CETUS but more importantly, SUI.
CETUS dominance within SUI is falling to rising applications. My favourite is Bluefin with its low barriers to account creation like google login. KUCOIN:BLUEUSDT BLUE has rising dominance within SUI volume market.
