LINK 3D – Watching the 50MA Reclaim
After a clear rejection at the 200MA on April 25, LINK is now trading above the 200MA, but has faced rejection at the 50MA.
The green zone represents a key support area that started forming on Feb 3.
✅ MLR > SMA > BB Center, confirming that the bullish structure remains intact.
🔍 Note how the BB center and SMA are now aligned. The last time this happened (see orange zone) was also after a drop, and the recovery only started after price reclaimed the 50MA.(see green circle)
Unless macro headwinds (e.g. tariff war escalation) drag the market down, the key level to watch is the 50MA. A close above it could mark the next leg up. 📈
Thanks for reading!
If you found this useful, give it a like or drop a comment.
Manage risk, take profits.
Cryptomarket

XRPXRP just created a Inversion FVG on the 1h timeframe, paired with a sweep of the Previous Day Lows, indicates a strong move upwards.
We should see a retest of Previous Day High at $2.36 which may lead to a test of a 4h FVG between $2.38 - $2.40.
If we get any big announcements this weekend, we may see run towards $3 heading into the week.
Have an exit strategy once we have our banana move, it's been a great journey.
LOCK IN.

PEPE Daily – Testing Key Fib Support
After getting rejected at the 0.5 Fibonacci level on May 14, PEPE is now retesting it as support.
On the way down, price found support at the 200MA, even after briefly closing below it on the daily chart.
You could argue MLR > SMA, but both are still above the BB center and the 200MA, which maintains the overall bullish structure.
⚠️ Watch for a daily close below the 0.5 Fib—that would weaken the structure and could lead to further downside.
Look closer at smaller time frames.
Thanks for reading—if you found this engaging, react or comment.
Always manage risk and take profits. 📊

TradeCityPro | Bitcoin Daily Analysis #101👋 Welcome to TradeCity Pro!
Let’s dive into the analysis of Bitcoin and key crypto indices. As usual, I’ll go over the futures session triggers for the New York market.
⏳ 1-Hour Timeframe
As you can see on the 1-hour chart, after Bitcoin reached the top at 111,747, the market entered a corrective phase and BTC has pulled back to around 106,192.
🔍 For now, I’m not adjusting the 106,192 level because it remains a very strong support zone. If the price reaches this level and shows a solid reaction, we can look for entry triggers on lower timeframes.
💥 Currently, the trigger for a long position is at 109,229. This level previously caused the price to make a lower low, so breaking it could inject strong bullish momentum into the market.
📈 The main long trigger is at 111,747. However, this level is a strong supply zone and won’t be easy to break, so trading this level will be challenging.
📊 On the bearish side, we’re watching the RSI oscillator for a potential entry into the oversold zone. If RSI enters oversold territory, strong bearish momentum may follow and increase the chance of breaking below 106,192.
👑 BTC.D Analysis
After a retracement to the 63.50 level, BTC dominance has initiated a new bullish leg, reaching up to 64.32.
⭐ If 64.32 is broken, it confirms further upside toward 64.63. Conversely, if 63.97 breaks, we get confirmation of bearish momentum returning.
📅 Total2 Analysis
Total2 is currently forming a descending triangle after being rejected from 1.26T. Price is hovering around the 1.18T support.
⚡️ If 1.18T breaks, we could see a drop toward 1.15T. For a bullish breakout, we need to see a break of the trendline and activation of the 1.22T trigger.
📅 USDT.D Analysis
USDT.D is currently trading below 4.62. A break below this level would confirm further downside.
🎲 A break of 4.51 would further confirm a bearish trend in USDT dominance, signaling strength across crypto markets.
❌ Disclaimer ❌
Trading futures is highly risky and dangerous. If you're not an expert, these triggers may not be suitable for you. You should first learn risk and capital management. You can also use the educational content from this channel.
Finally, these triggers reflect my personal opinions on price action, and the market may move completely against this analysis. So, do your own research before opening any position.

TradeCityPro | HNT: Testing Resistance in DePIN Uptrend Structur👋 Welcome to TradeCity Pro!
In this analysis, I’ll review the HNT coin. The Helium project is a U.S.-based Web3 and DePIN initiative.
✔️ This coin has a market cap of $9.26 million and is ranked 97th on CoinMarketCap.
⏳ 4-Hour Timeframe
On the 4-hour chart, HNT has an ascending trendline with a resistance zone near 4.372.
💥 If this resistance is broken, the main upward move may begin, and a breakout above this level confirms a bullish trend for HNT.
📈 So for a long position, you can enter on the breakout or a pullback to this zone. The next resistance level is 5.333.
🔽 For a bearish scenario, the ascending trendline must be broken first to signal a potential reversal. A break below 3.971 would be the first confirmation of that trendline break and can be used as a short trigger.
⚡️ The main short trigger would be a break of 3.642, which could push the price down toward 3.245.
🧩 The RSI oscillator is currently sitting on the 42.91 support; a breakdown here would confirm bearish momentum for a short setup.
📝 Final Thoughts
This analysis reflects our opinions and is not financial advice.
Share your thoughts in the comments, and don’t forget to share this analysis with your friends! ❤️

Quick BITCOIN Fractal update, Not on Fractal but still good
BITCOIN still in that target circle, first posted in Feb 2025, and I expect to remain here till early June.
This daily chart shows us where exactly we sit in the circle.
There are a number of reasons why we may remain here a little longer but one thing to always look at is the MACD.
The Weekly is still rising Bullish with room to move higher
The Daily is choppy and currently just fallen below its Signal line
We need to watch this area as between the MACD and its Histogram, we could see a Strong Bearish Divergence
The shorter term 4 hour shows how support in approaching
The habit has been for MACD to bounce off Neutral line but if we look at that Histogram, we can see the volatility there and so this could point to a weaker reaction in the near future.
In conclusion, the potential for a drop lower exists but the lower time frame MACD can also show us that some support is available maybe
Lines of support for BTC PA suggest a Low of around 105K should curent support fail.
Bitcoin Dominance (BTC.D) is currently rising again while the others are dropping.
If BTC PA Drops while this is rising, ALTS will Bleed heavy
Continued Range is the likely option till we reach June and then, Mid June, 18th, we have the FED Rate decision.
This could trigger renewed reaction.
We have reentered a zone of upmost CAUTION till we get some stronger momentum signals

Is the BTC Bull Tired ? A Healthy Pullback May Be on the Horizon🚨 Market Watch Update 🚨
Hey fam while the macro trend is still bullish overall, I'm noticing signs that this current uptrend might be running out of steam. There’s a good chance we’re nearing a breakdown from the rising channel, which could open the door for a healthy correction down toward that ~$90K area.
Last week’s breakout really shook things up a ton of short positions got liquidated, which helped push the price higher in the short term. Classic squeeze move. 👀
But here’s what I’m watching next
🔻 In the near term, I’m leaning slightly bearish. I wouldn’t be surprised if price pulls back into the $102K–$99K zone sometime this week. That range could offer a decent reset before the next major move.
🧠 Remember, when green candles start popping, retail FOMO tends to kick in hard — folks jump in late, thinking the rally will never end.
That’s exactly where market makers step in, taking profits and reloading at better levels. Don’t be the exit liquidity.
Stay patient. Stay sharp. And as always I’ll keep you posted with a deeper dive soon. 🎯

BTCUSD | IntradayAlthough we have a buy direction on the daily time frame, there is a small correction in it, and we can try to take advantage of its movement!
Feel free to discuss

Bitcoin Daily Timeframe TargetAs we can see at Daily Timeframe :
1. As we have learned about market structure, bitcoin has finished its correction phase, and now in daily view, as the initial target bitcoin will touch the level that I have determined
2.Daily view will lead us to buy trade direction, this means the probability of buy is greater than sell, whoever takes sell trade will be eaten by whales

Bitcoin’s Breakout Pattern Continues – Is $120K Next?MARKETSCOM:BITCOIN Quick Update
Bitcoin is showing strong momentum — each time it accumulates, it breaks out to a new level. This "accumulate and explode" pattern has played out cleanly three times already.
Now, BTC is consolidating just under its all-time high. If this range holds, another breakout could be coming soon.
The structure remains bullish as long as price holds above the $103K zone. A clear break above ATH could send it toward $120K and beyond.

BTC Futures : My first attempt with a target price of 0Hello friends; I think not believing in Bitcoin is as natural as believing in Bitcoin.
I can't express my opinion here with moving averages and/or RSI levels.
The Beyond Technical Analysis might make sense for this trade.
If we are wrong, what is important here is our position and risk management. We do not open a transaction to say "I told you so".
I cannot explain this with any technical analysis method, blockchain data, etc.
Technically; everything that will be built based on this is the same as building a sand castle.
I don't think Bitcoin has an equivalent.
If we consider serious inflation rates, it is obvious that people will have much bigger and more vital priorities than buying Bitcoin or other cryptocurrencies. I am not even talking about electricity costs.
I definitely don't think it can be in the same class as Gold.
This trade alone offers us a very good risk/reward ratio.
I chose the contract covering the next period ending on May 30th, not the continuous CME contract, in order to save time.
A good place for a first try.
I will definitely try something similar.
I don't think I will have any views other than the short side in the future.
For years I have been asked, "If you don't believe us, why don't you open a short position?" I will try to achieve this.
So there's also an experimental side to this.
HIGHLIGHTS
We are closing our position before the contract switch date of May 30, 2025, without looking at the price. If necessary, we will try again in the next contract.
The value of 113690 is our stop value. We end our trade at this value.
We choose the smallest value as the position size.
If you expect something to be 0,
you should choose trading instruments that evaluate your position in currencies rather than in BTC value.
I chose CME because it is suitable for this.
Contracts that are further away are definitely not liquid.
It may be difficult to find buyers even at high values.
Target : 0
Absolutely no margin addition.
Best regards.

TradeCityPro | Bitcoin Daily Analysis #100👋 Welcome to the 100th Bitcoin Analysis!
I'm really happy we've shared this 100-day journey together, and I hope you've been able to benefit from these analyses along the way.
💥 Every single analysis I've posted so far has been the basis for real trades that I've taken myself. I'm glad to say the overall result of those trades has been profitable, and I hope your results have been positive too.
⚡️ Today, I want to do a full multi-timeframe breakdown of Bitcoin and other major crypto indices. Let’s dive in and see where the market stands.
💰 Bitcoin Analysis
📅 Weekly Timeframe
As you can see, in the weekly chart, Bitcoin reacted to an ascending curved trendline during its recent correction phase and retraced up to around 72,147.
💫 On the RSI, we also have a key support level at 44.75, which has held again. The combination of this support with the curved trendline has created a potential PRZ (Potential Reversal Zone), and price has since resumed its upward move.
✔️ Last week’s candle managed to close above the resistance at 104,919 for the first time ever. Many in the market expected that a weekly close above this level would trigger a sharp rally toward 130,000 or even 160,000.
📊 However, that hasn’t happened—this week’s candle is still small and lacks strong bullish momentum.
✨ We can now view the range between 104,919 and 108,454 as a resistance zone. Although the price has entered this zone, we haven’t yet confirmed a breakout. That confirmation would come with a weekly close above 108,454.
📈 Despite the strong momentum before breaking ATH, price seems to be losing steam now. That’s not necessarily bad—it’s actually expected, since this area is one of the most important supply zones for Bitcoin and won’t break easily.
🔽 If price gets rejected and this move turns out to be a fakeout, there’s a real possibility of a trend reversal. We’ve got a potential double top forming, which is usually the first signal of a reversal. If price then breaks the 72,147 support, it would confirm the end of the current uptrend. A lower high and lower low afterward would confirm a new downtrend.
⭐ At this point, I can’t give you a new spot-buy trigger in this timeframe. The trigger was around the curved trendline. Since price has moved away, we need to wait for a new setup to form.
Let’s check lower timeframes for more detailed price action.
📅 Daily Timeframe
In the daily chart, after getting support at 76,087, price started moving up and with the breakouts of 87,700 and 91,953, the bullish phase began.
🔍 Currently, price is holding above 106,250 with increasing volume since the 91,953 breakout. Everything looks ready for Bitcoin to begin its main move and enter an extension leg up.
🚀 If this happens, price could target 129,000 and even 150,000. RSI will be key for confirmation—if it re-enters Overbought territory and holds above 77.81, higher targets become more likely.
🛒 The previous spot-buy triggers I gave were at 87,700 and 91,900. If you entered with those, I recommend holding for now and waiting for signs of a trend change before taking profits.
🔔 If you didn’t buy earlier, I can’t provide a new entry just yet—we need to wait for a new structure and trigger to form.
🔽 For now, I still see the trend as bullish. A bearish scenario would require a fakeout below 106,250—if price drops and forms a lower high and lower low, the uptrend would be over and a downtrend would begin.
⏳ 4-Hour Timeframe
After breaking 106,250, price rallied to 111,826 and is now pulling back to 106,250.
✔️ RSI is holding above its local support at 44.48, and as long as it stays above that level, market momentum remains bullish.
📈 You can consider entering a long on a pullback to 106,250. A breakout above 111,826 would be the main trigger for a new long.
🔑 Right now, there’s no valid reason to short, so it’s best to wait for a clear bearish structure before considering that.
👑 Bitcoin Dominance (BTC.D)
📅 Weekly Timeframe
After several green weekly candles, BTC.D printed a large red candle, pulling back toward the midline of its ascending channel and rejecting from 64.77. However, it’s now moving back up again.
💥 With this strong momentum, there’s a good chance BTC.D could break out of the channel. If 64.77 breaks, we could see a push toward 71.04.
⚡️ To confirm a bearish reversal in BTC.D, we’d need to see a breakdown below the lower trendline of the channel. That would likely signal the start of an altseason.
📅 Daily Timeframe
BTC.D has been in an uptrend and even broke above its channel briefly. But after hitting 65.31, it started a correction and dropped to the midline at 62.22.
🎲 It quickly bounced from 62.22 and is now moving upward again. Given the bullish structure, it could retest the 65.31 high.
📈 If it forms a lower high and breaks below 62.22, that would confirm a trend reversal. A breakout above 65.31 would confirm continuation of the uptrend.
⏳ 4-Hour Timeframe
BTC.D rallied to 64.31 and is now trying to retest that level. If it breaks above 64.31, the next target is 65.41.
🧲 If it forms a lower high and breaks 63.51, we’d get a confirmation that the bullish leg has ended, increasing the chances of a move to 62.17.
✔️ Total2 (Altcoin Market Cap Excluding BTC)
📅 Weekly Timeframe
After breaking the curved trendline, Total2 fell to around 816B before bouncing alongside Bitcoin.
⚡️ Currently, it’s ranging between 1.15T and 1.26T for the past three weeks.
🧩 If price breaks this range, it could rally toward 1.61T, which is the most important supply zone for Total2. A breakout here would likely trigger a strong altcoin rally.
🛒 If that breakout coincides with a drop in BTC.D, it would be an excellent spot-buy opportunity for altcoins.
📊 If the current rally fails to reach 1.61T and forms a lower high, another drop toward 816B is likely. This time, the chance of breaking that support would be high—confirming a trend reversal.
📅 Daily Timeframe
Price is stuck in a range between 1.15T and 1.26T.
🔼 A breakout from either side would likely lead to a strong move. A break below 1.15T could extend the decline toward 861B, while a break above 1.26T would target 1.62T.
⏳ 4-Hour Timeframe
Same structure as the daily chart. Long trigger = 1.26T breakout. Short trigger = 1.15T breakdown.
🔑 If price forms a higher low and starts moving back up, the likelihood of breaking 1.26T increases. The next target would be 1.33T.
✔️ USDT Dominance (USDT.D)
📅 Weekly Timeframe
USDT.D is ranging between 3.78 and 6.22.
📉 It recently formed a lower high below 6.22 and broke below 5.06, now heading toward 3.78.
🤔 If USDT.D drops to 3.78, we could see a major market rally—Bitcoin might move toward 130,000 or 160,000.
🚀 If 3.78 breaks, the next support is at 2.53, which would mark the start of a major bull run.
📅 Daily Timeframe
USDT.D has hit support at 4.40 and is now approaching a descending trendline that’s been holding since the 6.22 top.
📈 If that trendline breaks, the trigger is at 4.70. A breakout here could lead to a move to 5.02.
🔽 If price gets rejected again, the short trigger is at 4.40, and the next support is at 3.81.
⏳ 4-Hour Timeframe
Support at 4.38 has held, and price is now above 4.50 and approaching the trendline.
🎲 If 4.50 fails and price drops to 4.40, a break below 4.40 confirms a bearish continuation.
📊 If the trendline breaks, use 4.74 as your confirmation trigger.
❌ Disclaimer ❌
Trading futures is highly risky and dangerous. If you're not an expert, these triggers may not be suitable for you. You should first learn risk and capital management. You can also use the educational content from this channel.
Finally, these triggers reflect my personal opinions on price action, and the market may move completely against this analysis. So, do your own research before opening any position.

BItcoin; Heikin Ashi Trade IdeaCOINBASE:BTCUSD
Picture tells more than 1000 words!
Thank you for checking out!

Heikin Ashi VS Regular candlesticks - EducationalNASDAQ:AMZN
Everything is explained in the video.
I hope you will find it very educational and test it. Those who trade stocks will probably switch to Heikin Ashi :)
Thank you!

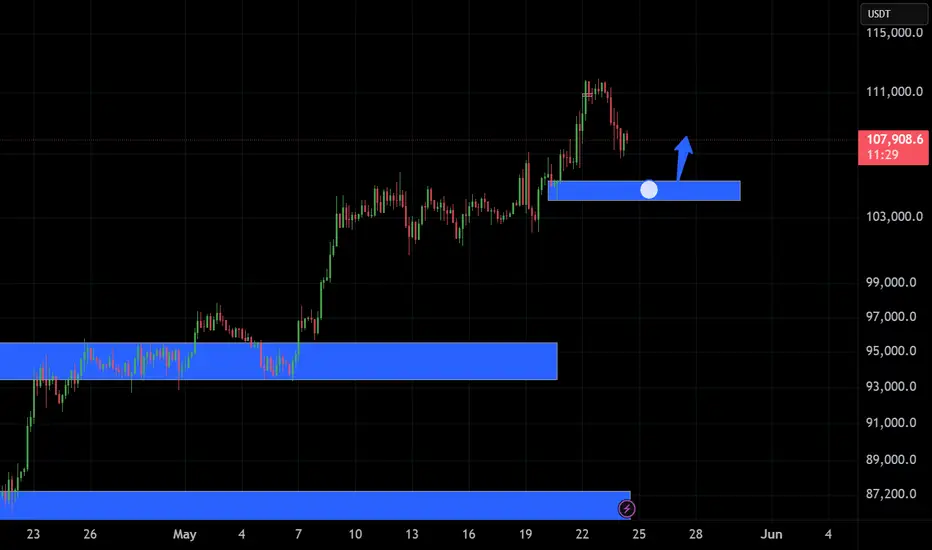
SOL macro plan3D chart looks very simple here. Simply act on the break on the current zone and take the position to target opposite liquidity area.

solusdt will go to towards 320$solusdt BINANCE:SOLUSDT will go towards $320
In the current area, a downward correction to $150.5 is possible, but ultimately the final destination is $320,
Market geometry doesn't lie.
$320 is an index for this symbol.

INJ/USD Bullish Heist: Crack the Vault & Grab the Loot!Ultimate INJ/USD Heist Plan: Snag Profits with the Thief Trading Strategy! 🚀💰
🌍 Greetings, Wealth Raiders! Ciao, Hello, Bonjour, Hola! 🌟
Fellow profit hunters, get ready to crack the INJ/USD "Injective vs U.S Dollar" Forex vault with our slick Thief Trading Strategy! 🤑💸 This plan blends razor-sharp technicals and fundamentals to loot the market. Follow the chart’s long-entry blueprint to strike at high-risk zones like the Yellow Moving Average Zone. It’s a wild ride—overbought conditions, consolidation, and potential trend reversals mean bears are lurking! 🐻 Stay sharp, grab your profits, and treat yourself—you’ve earned it! 🎉💪.
📈 Entry: Storm the Vault!
"The heist is on! Wait for the breakout (14.700) then make your move - Bullish profits await!"
The market’s ripe for a bullish grab! 💥 Place buy limit orders within the most recent 15 or 30-minute swing low/high levels. Set alerts on your chart to stay locked in. 🔔
🛑 Stop Loss: Guard Your Loot!
Set your Thief SL at the nearest swing low or candle wick. on the 8H timeframe for day/swing trades. Adjust based on your risk tolerance, lot size, and number of orders. Safety first! 🔒
🎯 Targets: Claim Your Prize!
🏴☠️ Short-Term Target: 15.700
👀 Scalpers, Listen Up!
Stick to long-side scalps. Got deep pockets? Jump in now! Otherwise, join swing traders for the heist. Use trailing stop-loss to lock in gains and protect your stash. 💰
🐂 Why INJ/USD is Hot!
The "Injective vs U.S Dollar" bullish surge is fueled by key fundamentals. Dive into Macro, COT Reports, On Chain Analysis, Sentiment outlook, Intermarket trends, and future targets via the linkss below for the full scoop. 👉🔗. Stay informed to stay ahead! 📰
⚠️ Trading Alert: News & Position Management
News releases can shake the market like a heist gone wrong! 🗞️ To protect your profits:
🚫 Avoid new trades during news events.
🛡️ Use trailing stops to secure running positions.
💥 Boost the Heist!
Hit the Boost Button to supercharge our Thief Trading Strategy! 💪 Every click strengthens our crew, making it easier to swipe profits daily. Join the squad, trade smart, and let’s make money rain! 🌧️💵

TradeCityPro | CORE: Watching Trendline and RSI for Next Move👋 Welcome to TradeCity Pro!
In this analysis, I’ll be reviewing the CORE token. This project is one of the DeFi infrastructure developers for Bitcoin and also runs its own Layer 1 blockchain.
💥 The token currently holds a market cap of $826 million and is ranked 86th on CoinMarketCap.
⏳ 4-Hour Timeframe
As seen on the 4-hour chart, CORE is in an uptrend supported by an ascending trendline, with price consistently moving higher along it.
✅ In the last bullish leg, price only managed to retest the previous high around 0.8727 and is now undergoing a pullback.
⚡️ This shows signs of weakness in the bullish momentum. If the price fails to close above 0.8727 and drops back to the trendline, the risk of a trendline breakdown increases.
🔍 There’s also the potential for price to form equal highs and higher lows, forming an ascending triangle, which would favor a bullish breakout scenario.
🔑 Watch the RSI oscillator closely. Historically, every time RSI reached the 70 zone during a bullish move, the trend topped out and reversed. So if RSI manages to break above 70 this time, it could trigger a much stronger bullish leg.
📈 For a long position, potential entries include a breakout above 0.8727 or a bullish bounce off the ascending trendline.
🔽 For a short position, the first trigger would be a break of the trendline and activation of the 0.7560 support zone.
📝 Final Thoughts
This analysis reflects our opinions and is not financial advice.
Share your thoughts in the comments, and don’t forget to share this analysis with your friends! ❤️

Bitcoin(BTC/USD) Daily Chart Analysis For Week of May 23, 2025Technical Analysis and Outlook:
In the course of this week's trading session, Bitcoin demonstrated significant upward movement, surpassing both Mean Resistance at 105000 and Key Resistance at 106100. This progression also facilitated the surpassing completed Inner Coin Rally at 108,000, and the highly anticipated Outer Coin Rally marked at 110000. As a result, the cryptocurrency experienced a substantial decline, currently aiming toward Mean Support at 105600, with a potential further decline toward an additional Mean Support target at 101500.
It is essential to acknowledge the possibility of an upward momentum emerging from the current level, which may enable a challenge to Key Resistance at 111700. Success in this regard could result in reaching the Inner Coin Rally at $114500 and, subsequently, the Outer Coin Rally at 122000.

BCH/USD Crypto Profit Raid: Steal Gains with This Blueprint!🔥 Chart Heist Blueprint: Snag Profits in BCH/USD "Bitcoin Cash vs U.S Dollar"! 🚀💰
Crafted for sharp traders ready to raid the BCH/USD "Bitcoin Cash vs U.S Dollar" market, this sleek strategy fuses razor-sharp technicals with savvy fundamentals to maximize your gains. 📊🕵️♂️ Surf the bullish surge, but watch for traps in the Overbought Resistance Zone where bears could strike! 🐻 Lock in your loot before the tide turns. 🌊
- 🎯 **Entry Tactics: Hit the Sweet Spot**
- Long on pullbacks near 440.00 (or) the Silent entry : Institutional Buy Zone at 380.00 (or) above price level. 🏹
- Set alerts for breakouts or pullbacks to strike in real-time. 🔔
- 🛡️ **Stop Loss Hacks: Guard Your Gains**
- Place stops below the nearest 4-hour swing low or candle wick. 🔧
- Tailor stops to your risk and lot size—precision over recklessness! ⚡
- 💸 **Profit Goals: Cash In Big**
- Bullish traders aim for 510.00 or exit early if momentum dips. 📈
- Scalpers focus on long-side quick wins, trailing stops behind big players. 🚀
- 📡 **Market Edge: Why This Plan Wins**
- BCH/USD "Bitcoin Cash vs U.S Dollar" is charging bullish, driven by COT data, macro shifts, sentiment outlook, and intermarket flows. 🔍
- Check the linkss for deeper insights. 🌐
- ⚠️ **News Alert: Dodge the Chaos**
- Skip new trades during major news releases. 📰
- Use trailing stops to secure profits on active trades. 🔒
- 🤝 **Join the Profit Crew**
- Boost this plan, share the vibe, and let’s raid the markets together! 🤑
- Stay sharp for the next big score in the XPD/Palladium heist! 💥
Happy trading, chart bandits! 🎭📉

$INJ on WeeklyThe asset bounced within the Demand zone on the Weekly, creating room for a possible rally up to the $20-25 area.
Volatility is still open but with steadily decreasing bearish pressure.
A Daily FVG overlaps with the Weekly FVG so as to create possible room for maneuver.
The widely used RSI has broken the barrier of a bearish trendline that has lasted since December 2023. Whether it maintains the trajectory will only be seen at the close of this week.
Funding rates positive.
Open Interests slightly up.
Detail not to be overlooked in the coming days: the market cap line is rising, but the price is lagging slightly. Positive sign.
Stable volume, with an improvement in the last two days. Very mild data.
With the whole crypto sector seemingly showing signs of life, I am confident of its uptrend.
Remember: until proven otherwise.

