Cryptomarket

BTC Double Top Patterns As we see BINANCE:BTCUSD made a new high that can be a double top formation on chart.
Also when we see the RSI chart it is seeing resistance above 60 and keep falling below 60.
So Looks like a bearish trend and if BINANCE:BTCUSD breaks its 3 months support around 91700 then we can see BINANCE:BTCUSD around 76000.
Lets see!
This post is just my perception and for study purpose only.
As crypto market has high risk of loosing money. Please invest your hard earned money carefully.
I will not be responsible for any loss in the crypto market.

Bitcoin Ready for new highAs we see BINANCE:BTCUSD break the previous high and made rounding bottom formation on chart.
So Looks like a bullish trend and if BINANCE:BTCUSD
sustain above 109000 then we can see BINANCE:BTCUSD
Up to around 133000.
Lets see!
This post is just my perception and for study purpose only.
As crypto market has high risk of loosing money. Please invest your hard earned money carefully.
I will not be responsible for any loss in the crypto market.

BTCUSD / BITCOIN | 4H | WAIT BREAKOUT Good morning, my friends
Bitcoin support level is $96,900.00, while the resistance level stands at $104,600.00.
Right now, I'm just waiting for an upward breakout. Once that happens, I'll provide a clear target.
Don't forget to hit the like button so you don't miss any updates on this analysis.
My dear friends, your likes are the biggest motivation for me to keep sharing my analyses. I truly appreciate everyone who supports my work with their likes—thank you so much!
With respect and love.

BTC - Will it break the ATH? BITCOIN is near its all-time high!
Mapped out possible BUY or SELL opportunities in DAILY timeframe.
BTC is currently inside a triangle that is about to burst. Create your alerts/notifications to catch this move :D

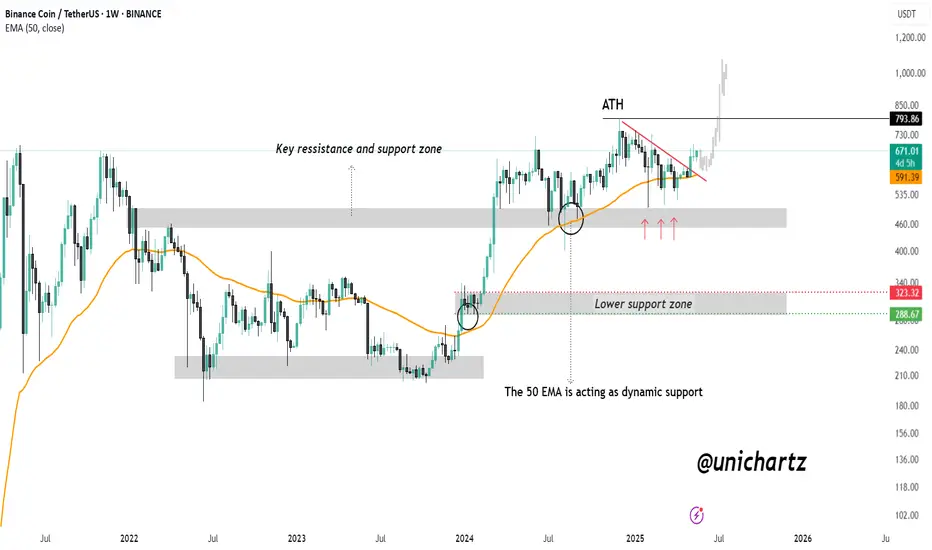
BNB Weekly Breakout: Road to $1,000?CRYPTOCAP:BNB is showing strong bullish momentum on the weekly chart. The 50 EMA is acting as a dynamic support, holding firm during multiple retests and providing a solid foundation for upward movement.
Recently, price action has broken above a key descending resistance line and successfully reclaimed a major support-resistance zone, turning it into a strong base. This area, which previously acted as a battleground for bulls and bears, is now supporting the current rally.
As long as BNB continues to hold above this zone and the 50 EMA, the structure remains bullish. With sustained momentum, a retest of the all-time high zone around $793 is likely, and a breakout above it could open the door for a move toward $1,000 and beyond.
DYOR, NFA
DUSKUSDTThis is a long-term analysis for the weekly time frame. Our guess is that the price will return from around 0.012 to 0.015 and even higher (completion of wave 4) and then complete its wave 5 at around 0.053 to 0.041.
If this happens, buying it spot is quite low-risk and we can even look at it for a long-term hold and an investment under one condition.
If this Elliott analysis is correct, the price could reclaim its new high within two years or more and even see numbers beyond it.
In terms of timing, late July and early August are a good time for the end of wave 4 and late 2025 and early 2026 are ideal times for the end of the hypothetical wave 5.

C98/USDT 15M ANALYSISHey Traders! 👋
I'm tracking a potential impulsive Elliott Wave structure on C98/USDT.
📈 Wave Count So Far:
- We completed a clean 5-wave impulsive move up — labeled i through v.
- This was followed by a classic zigzag (ABC) correction, forming what looks like a textbook
Wave 2.
- The corrective structure appears complete, and price is now holding above key support.
🔍 Current Expectation:
I'm now looking for Wave 3 to unfold, which typically brings the strongest momentum in the Elliott Wave sequence.
Trade Setup:
🟢 Entry Zone: 0.06 – 0.0615
🔴 Stop Loss: 0.05923
🎯 Target Price: 0.0652
💡 Note: Always manage your risk and confirm with your own analysis before entering any trade.

Bitcoin - Do Or DieThis is the spot where things either get spicy or go limp. If we see weakness here — same old chop, same range, nothing to see.
But if Bitcoin punches through this zone with conviction, we’re looking at some serious upside. Targets are mapped, and the path is clear if bulls step up.
No breakout? Don’t expect fireworks.
Breakout? Strap in.
This is a decisive moment

BTC USD UpdateWe’ve hit all of our targets on the BTC/USD pair, so it’s time to close today’s trades and let the markets work their magic. I hope you’ve found this trading plan helpful. With the summer trading season ahead, it will be interesting to see how both the dollar and crypto markets perform. I’ll keep you posted!

BTC- crash is coming? Most likely no)In its best traditions, bitcoin in one impulse reached the monthly target 95000, which I wrote about
The probability of a correction to set a higher low in the equilibrium area of the range is increasing.
Probably in May the crypto market will have to pass the last stability test, in case of success we will get excellent opportunities for spot and speculative positions before the next cyclical growth spiral.
For now have to wait for weekly open but there are 2 options:
pump till PWH and then move on correction
slow bleeding till 0.5 or mb till 83k in worst case and then pump to ATH

At this point market successfully taped into the!Gold Market Analysis – Bullish Momentum Building
Gold has recently broken through a significant call option (CE) resistance level, signaling heightened bullish aggression among market participants. This breakout suggests that buyers are currently in control, pushing prices decisively above the CE threshold.
At this point, the market has successfully tapped into the previous swing low liquidity and appears to be forming buy-side liquidity above the current price action. With this structure, we anticipate a potential move toward the Fair Value Gap (FVG) zone marked on the chart. A clean breakout above this FVG, followed by a retest and successful hold of that level, would serve as a strong confirmation of continued bullish intent.
Should this scenario play out, our next upside targets lie in the 3320–3330 range. Traders are advised to monitor price action closely and wait for confirmation signals before making entries. Strategic decision-making is key—avoid emotional trading and prioritize high-probability setups.
Disclaimer: This analysis is for educational and informational purposes only and does not constitute financial advice. Always conduct your own research (DYOR) before making any investment decisions.


Senate Advances Stablecoin Bill, JPMorgan Backs Bitcoin AccessFundamental approach
- The US Senate has cleared the GENIUS Act, its long-awaited stablecoin framework, after marathon talks. A final vote is expected after the Memorial Day break (26 May).
- JPMorgan Chase CEO Dimon says the bank will soon allow clients to trade bitcoin through third-party custody, adding fresh tailwinds to institutional demand.
- Spot-bitcoin ETFs are on track for a sixth straight week of net inflows, reinforcing the bid beneath prices.
Technical approach:
- Price is probing resistance at 106200 within a well-defined rising channel. The widening spread between both EMAs underscores building bullish momentum.
- A decisive close above 107000 opens the door to 113000.
- On the contrary, a drop through the support at 101400 would lead to a deeper correction to around the following support at 93000.
Analysis by: Dat Tong, Senior Financial Markets Strategist at Exness

THETAUSDT: Strong Fundamentals, Bullish Technicals: What’s Next?Hello Everyone!
In this idea, I’ll break down BINANCE:THETAUSDT from both a fundamental and technical perspective. The goal is to uncover whether THETA presents a real opportunity or if it’s just another altcoin market noise.
1. Fundamental Analysis
I’m bullish on THETA not only for its technical setup but also for its strong fundamentals:
- AI Integration Advantage: THETA is carving out a niche in the AI and decentralized video infrastructure space which is a sector currently enjoying massive global attention and investment. This AI focus gives THETA a competitive edge in a rapidly evolving industry.
- Tokenomics: THETA has a maximum and circulating supply of 1 billion tokens , which is relatively no inflationary token.
- Upcoming Catalyst : EdgeCloud Beta Launch : A major catalyst is scheduled for June 25 , with the beta launch of THETA’s EdgeCloud platform. This development could generate renewed investor interest and media attention.
- Active Transparent Team : THETA’s team is known for being highly active and continuously forming strategic partnerships, which reinforces long-term credibility and ecosystem growth.
2. Technical Analysis
On Weekly timeframe
- THETA has recently made an upward move from a strong demand zone , showing clear signs of buyer interest. Notably, it didn't break below its 2023 bottom , which reinforces a bullish structure and suggests that the long-term support is holding firm.
- Additionally, the MACD is on the verge of a bullish crossover, signaling a potential shift in momentum. If confirmed.
On 4D timeframe
- THETA also bounced off a PD Array, specifically a Fair Value Gap (FVG) , which often acts as a high-probability reaction zone in ICT . Adding to the bullish confluence, it closed a previous 4-day candle with strength , confirming bullish intent and showing institutional interest may be stepping in at this level.
- THETA is currently targeting the next PD Array — a swing point around $1.08 . If price sweeps this level with strength, the next potential target lies around $1.311 , aligning with the next major liquidity zone .
On 4H timeframe
- For bullish momentum to truly build, THETA must break above the key resistance zone at $0.93 . This level has acted as a supply barrier, and a clean breakout could trigger increased buying pressure.
- On the Cumulative Volume Delta (CVD) , there's a bullish divergence forming — a strong indication that buying interest.
In conclusion, THETA/USDT is showing promising signs both technically and fundamentally. The bounce from a key demand zone, bullish divergence on CVD, and a potential MACD crossover suggest momentum may be shifting in favor of bulls. If price breaks above the $0.93 resistance , we could see a move toward $1.311 .
On the fundamental side, THETA’s involvement in the booming AI sector, capped supply, upcoming EdgeCloud beta launch (June 25), and an active development team provide strong long-term potential.
As always, manage risk wisely and monitor key levels for confirmation.

Notcoin Inverted Head & Shoulders (PP: 250% Easy)This is a different view of the chart. The iH&S (inverted head and shoulders) pattern is a reversal pattern. The breakout above the neckline and retest as support fully confirms the bullish bias.
Notcoin is bullish confirmed. The bottom is in based on this pattern and the retrace after the initial bullish breakout with support holding. This means that a major advance is to happen next.
The target I am showing on this one is the main target, "back to baseline," but this is not the end. This would be the minimum on the first impulse up. This target should reach fast and it is very strong because it would yield from current price a nice ~250% profits. More down the road.
This is a pair that you cannot miss, or you can.
This is a pair that looks good and is sure to grow incredibly strong in this 2025 bull market, that is why I continue to share it everyday.
There are many options of course, many great Altcoins, but some are just certain to grow strong. I am showing you some of everything, the ones that are certain I post more often. You can do great in this bullish cycle, I know.
You can do this and thanks a lot for the support and follow.
I will shower you with hundreds of unique charts and great content, great profits if you decide to follow trade/buy and hold. Buy now when prices are low. Sell later when we hit resistance on the way up. It is very easy. Easy if you trust. Trust the Master of the charts.
Namaste.

BTC/USD Eyes Breakout Analysis On Weekly Time Frame.Bitcoin (BTC/USD) Weekly Chart Analysis
After facing a long term resistance at 70,000$ which was significant barrier for Bitcoin in the past, breakout occurred recently, indicating a strong bullish signal and a shift in market structure.
BTC is currently trading around $103,025, facing a new resistance zone.
as the fundamental shows that it may break the resistance again after scalping and we may see the bitcoin at the 120,000$.
But the technical analysis indicates that we may see a retest her to validating the zone now as support.
After the breakout, BTC faced selling pressure around the $105,000–$110,000 range, creating a new resistance zone.
If the resistance is not breached, there is the possibility of a rejection occurring which may result in a retracement down to $79,902, which would be a 28.72% drop.
And i think From there if the resistance isn’t broken out of, then it’s most likely a rejection comes and we can expect a fall back to $79,902 which is a 28.72% retracement.
A breakout above the current resistance could trigger a 46% rally towards the $120,409 target.
This would continue the bullish trend post-breakout, supported by momentum and volume.
we will stay focused here and wait for the breakout of the resistance.

Bitcoin - All time highs will come next!Bitcoin - CRYPTO:BTCUSD - prepares a significant move:
(click chart above to see the in depth analysis👆🏻)
Over the past couple of months, we basically only saw sideways price action on Bitcoin. However, this does not mean, that Bitcoin is now slowing down; actually the opposite is true and Bitcoin is setting up for a major move higher. New all time highs will come very soon.
Levels to watch: $100.000
Keep your long term vision!
Philip (BasicTrading)

PYTH 4H ANALYSIS – Bullish Setup in PlayAfter completing a 5-wave impulse to the downside, PYTH has shown signs of a trend reversal. The first upward impulse displayed a clear 5-wave Elliott structure, breaking out of the descending channel — a strong bullish signal.
Following this, a classic A-B-C zig-zag correction occurred, which acted as a retest of the broken channel resistance, now turned support. This confluence increases the probability of a bullish continuation.
With market structure aligning and correction likely complete, PYTH is showing potential for a 50%+ move to the upside.
🟢 Entry Zone: 0.1400 – 0.1500
🔴 Stop Loss: 0.1272 (Below wave C & structural support)
🎯 Target Price: 0.2235
💡 Note: Always manage your risk and confirm with your own analysis before entering any trade.

ADA (Cardano) – Long Swing Setup from Major Support ZoneADA is currently trading within a critical support area ($0.71–$0.73), offering a compelling higher low opportunity. With BTC holding strength, ADA may be gearing up for a rebound, particularly if it maintains structure above the support.
🔹 Entry Zone:
$0.71 – $0.73
🎯 Take Profit Targets:
🥇 $0.80 – $0.84
🥈 $0.98 – $1.02
🛑 Stop Loss:
Daily close below $0.66 (loss of higher low and structural invalidation)

Polkadot (DOT/USDT) Ready to Explode? Full Technical Breakdown Hello everyone!
In today’s idea, I’ll be breaking down the technical analysis of BINANCE:DOTUSDT . I hope you find this analysis valuable and insightful for your trading decisions.
On weekly TF
- There was a huge liquidity sweep on the bottom of 4 AUG 2024 on APRIL 2025
- As shown in the chart above, the MACD has started to cross bullishly on 1W timeframe. The last time this occurred, DOT rallied by approximately 200%.
- Two weekly candles have closed above the previous high that led to the last bottom (around $4.772), signaling a market structure shift from bearish to bullish.
On 4D TF
- On the OBV , a downtrend line was broken, and a retest is currently in progress.
- There is a very important Fair Value Gap (FVG) being retested right now.
- Note: The 4D candle closes today. Monitor closely to see if it closes above the FVG — respect the FVG.
- A good potential entry zone is between $4.44 – $4.241.
In conclusion, DOT/USDT is showing promising bullish signals across higher timeframes, with a potential entry zone between $4.44 – $4.241. As always, manage your risk and wait for confirmation before entering. I’ll be watching the 4D close closely — stay sharp!

TradeCityPro | Bitcoin Daily Analysis #97👋 Welcome to TradeCity Pro!
Let’s go over the Bitcoin analysis and key crypto indices. As usual, I’ll be reviewing the triggers for the New York futures session.
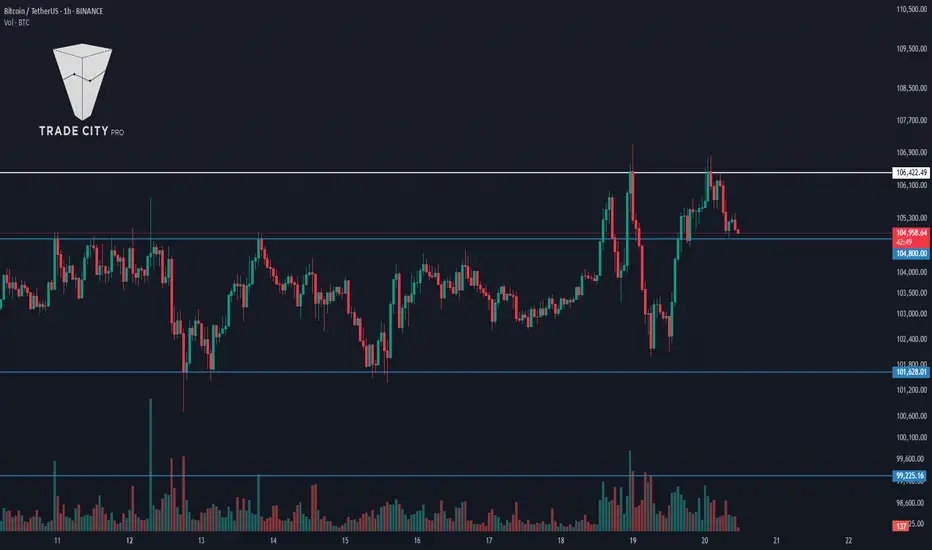
⏳ 1-Hour Timeframe
As you can see, a Double Bottom pattern activated yesterday, and the price has returned to the 106422 zone.
✔️ We previously had a support at 102882, but since the price wasn’t respecting it consistently, I’ve removed it. If price shows solid support there again, I’ll reintroduce the level.
🔍 Currently, the first trigger for a long position is 106422. This is a highly critical level and represents the main resistance for Bitcoin. If it breaks, there’s a strong chance for a sharp upward move.
✨ The first support in the way is 104800, which isn’t very strong. If a correction occurs, this level is likely to break. The main support remains at 101628.
📈 A break below 101628 would confirm a bearish reversal, and we could even consider opening a short position. The next support below that would be at 99225.
📊 Market volume has significantly increased over the past few days. This spike in volume suggests that a sharp move is likely. Using our trigger levels, we’ll be able to determine whether it’s an upward or downward breakout.
👑 BTC.D Analysis
Bitcoin dominance is still below the 64.04 zone and appears to be consolidating.
💥 The 64.04 level is highly sensitive. A breakout would signal a bullish shift in dominance, while a rejection would suggest the downtrend will resume.
⚡️ We’ll get confirmation of further downside if 63.71 breaks. Below that, the next support levels are at 63.30 and 62.65.
📅 Total2 Analysis
Yesterday, Total2 reacted to the 1.16 support and moved upward to 1.20.
💫 A break above 1.20 today would confirm bullish continuation. A drop below 1.16, however, would confirm the continuation of a broader correction.
📅 USDT.D Analysis
Yesterday, the 4.70 level was faked out, and the chart fell back into the range box.
🎲 I believe the chances of breaking below the range bottom have increased. Key bearish triggers are at 4.57 and 4.51. On the flip side, another break above 4.70 would confirm renewed bullish momentum for USDT dominance.
❌ Disclaimer ❌
Trading futures is highly risky and dangerous. If you're not an expert, these triggers may not be suitable for you. You should first learn risk and capital management. You can also use the educational content from this channel.
Finally, these triggers reflect my personal opinions on price action, and the market may move completely against this analysis. So, do your own research before opening any position.
TradeCityPro | S: Trendline Break Signals Key Support Retest👋 Welcome to TradeCity Pro!
In this analysis, I’m going to review the S coin—one of the Layer 1 coins for the Sonic network.
💥 This coin currently holds a market cap of $1.43 billion and ranks 58th on CoinMarketCap.
⏳ 1-Hour Timeframe
On the 4-hour chart, as you can see, there’s a large range box between the 0.3939 and 0.6147 levels where price has been moving sideways.
🔍 A key support zone also exists between 0.45 and 0.46, which has received strong bullish reactions, pushing the price upward toward the 0.6147 top via a trendline.
✔️ Currently, this trendline has been broken, and a new support level has formed at 0.4888, which has been tested several times.
✨ If this 0.4888 level breaks, a short position targeting the 0.45 zone and 0.3939 becomes viable.
📈 For a long position, the first trigger is the 0.5266 level. A breakout here would confirm support at 0.4888 and open the path toward the 0.6147 resistance.
🎲 The RSI oscillator is hovering near the 50 level. A sustained move above this could increase the likelihood of the bullish scenario playing out.
📝 Final Thoughts
This analysis reflects our opinions and is not financial advice.
Share your thoughts in the comments, and don’t forget to share this analysis with your friends! ❤️
