PEPE key levelsBINANCE:PEPEUSDT
The chart shows partial zones for buying this asset.
Further on there will be a good profit to risk ratio.
Cryptomarket

Bitcoin has recently touched its weekly Fair Value GapBitcoin (BTC) Market Update
Bitcoin has recently touched its weekly Fair Value Gap (FVG) and is now showing upward momentum. This price behavior is aligning with a potential transition from an Intermediate Reversion Level (IRL) to an Extended Reversion Level (ERL), suggesting the formation of a structured bullish model.
Given the current positive market sentiment surrounding BTC and the fact that the asset has already absorbed significant sell-side liquidity, the potential for further upward movement remains strong. There is a possibility that the market could aim for the 110K level in the near term if bullish conditions persist.
Investors and traders are advised to monitor the market closely as this structure develops, considering both technical indicators and macroeconomic influences to make informed decisions.
DYOR!

TOTAL3 Update: Potential Recovery on the Daily ChartLooking at TOTAL3 on the daily:
Yesterday, we saw a wick below the 200MA, but the price managed to close above it by the end of the day—a good sign for recovery. 🔄
Although the MLR < SMA < BB Center isn't ideal, we continue to monitor price action in relation to the 200MA. If we close above it again today, things might start to turn positive. 🌱
⚠️ Keep an eye on macro news and hope for no more downgrades from agencies like Moody’s.
Thanks for reading! Stay safe and manage your risk. 📊

Ethereum Name Service (ENS) Leaves Accumulation ZoneHere we have two accumulation zone. The "bottom" zone coming at the end of the 2022 bear market and in late 2023, between June and December. And the "higher low" zone which started after the early 2024 bullish breakout.
This latter zone was activated April-May 2024 (1), August-November 2024 (2) and March-April 2025 (3). With the last activation of this zone ENSUSDT ended its correction and is now bullish.
Last week was a consolidation week and within the next two weeks we can have a bullish continuation, the resumption of the bullish move that started with the 7-April low.
Good morning my fellow Cryptocurrency trader, how are you feeling in this wonderful week?
What is a good opportunity?
A project that has really good potential for growth and at the same time, high certainty, sure to grow and stable. This pair has those qualities.
We also want a good entry price and timing. Timing is good all across.
Entry prices could be better but that would be being greedy. If ENS can move beyond $100, easily, then anything below $25 can be a good entry. Of course, a price of $15 is many times better, but not everybody can buy at $15 at the same time. And being honest, it is not easy to catch the exact bottom. We can even see it happening but our finances might not be in the right place when this is happening or some other situation prevents us taking action, but it is never too late. The market always offers a second chance and this chance is now.
Ethereum Name Service has great potential for growth. My strategy is very simple, buy and hold. Set a sell order 300%-500% above my entry level, when it fills, look for a pair that is still trading at bottom prices and repeat.
If you are glued to your screen, you can track the market and sell higher. Or you can sell portions at each target, or you can hold long-term. There are many ways to approach the market, right now, it is not about selling but buying. Right now is the time to buy. Late 2025 is the time to sell.
Thank you for reading.
Namaste.

Ethena Short-Term Trade-Setup: Easy Profits 708%Ethena is now ready to produce a new advance, higher prices. The (1) shows a low before the last bullish jump. The (2) is a higher low which tends to lead to a higher high.
Looking at the Altcoins market, looking at Bitcoin and how strong it is; looking at the volume and candles, all is green.
ENAUSDT is ready to grow short-term, which means fast; the next advance is likely to start within days. The start will happen soon but the end is far away.
Look, the bottom has been forming for months. The bearish wave ended in March, then the market flush and now the recovery; prices are still low.
The thing is that once the action starts, there is no going back, it will happen so fast that by the time you look at the market, at the chart, everything will be 100% to 200% up. There will be more growth, but is better to get in early.
Thanks a lot for your continued support.
Buy and hold.
Namaste.

Solana driving to 176 ??? Or can we go Higher? Hi everyone
This is what I am seeing currently, let me know what you think ?
Kris/Mindbloome Exchange
Trader Smarter Live Better

SONIC gearing up for a strong move!No reason not to start picking some up here—just took out the previous swing high before forming new lows.
Now establishing a solid base after reclaiming a key pivot area.
Targeting 70c on this move. SET:SONIC

Altcoins: Bitcoin Daily Turns Bullish, New All-Time High But...New All-Time High but how high? How high is Bitcoin set to move in this breakout as a the new All-Time High? How high is Bitcoin set to continue in May that still has 12 days left and what about June and July 2025?
What happens after June-July 2025 and what happens in late 2025?
What's the map? How high comments section below—yes?!
Bitcoin is now challenging the "final resistance." This is truly the final resistance because we are in the 2025 bull market. There are many things happening around this final resistance. For example, the Altcoins market.
The Altcoins market goes bullish when Bitcoin grows above 100K yes? Yes it did/does and has been growing for an entire month many pairs are up 70% to 100% some are up 400% and this is only the start but, think of this... What happens when Bitcoin hits a new All-Time High?
For Bitcoin this isn't much, the ATH is at $109,588 and a new All-Time High is $110,000 but what about the Altcoin? Magic!
When Bitcoin hits a new ATH it goes on all media all screens and nobody can deny it is happening because it is happening and the market is full green. This creates boom, interest and many people trade only when resistance breaks. The Altcoins will boom growing 2-3 levels up within days. The bottom forever gone massive profits, lives changing and this is only the start.
The first level of importance as Bitcoin moves in price discovery eventuality and territory and market conditions—change, grow, win—sits around $120,000 and $130,000. This is the level to watch for.
Some people are saying a massive correction at this point more like a normal correction or maybe nothing for a few reasons that I will explain below.
The next range is $150,000 and $160,000 and here is the thing. If Bitcoin is going to $180,000-$220,000, then the correction cannot happen at 120/130K. It needs to happen on the second level around 150/160K, do you understand?
If the strong mid bull market correction happens at $120,000-$130,000 this is bad news because the final market cycle top gets lowered. If it happens later we have $180,000, $200,000, $220,000 or more. And this is the interesting part and what we want.
We are still in May month #5 and the minimum we can expect growth is until November month #11 which gives us 6 months. 6 months of straight up is a very long time. With a 2-3 months correction now it isn't that long.
These are the things that we need to consider but aim high because Bitcoin will always surprise.
Minimum, you can aim for $180,000 as the cycle top—minimum. Go higher leave a comment and with the excitement, euphoria and the first time since 2021 seeing so much growth, institutional adoption, Trump, Saylor, El Salvador think $220,000 can you see how that works? Comment below.
Things are bright for Cryptocurrency holders know why now think in this way. Your life can change forever if you take the right action following the right steps in the next 6 months. Imagine a lifetime of profits secured in this bull market bull run. The choice is yours.
It can happen of course, it has happened many times and will continue to happen but we have to be smart. It is happening now but we are early this time we have experience and we know exactly what will happen. It is not a question of if but when. When? In late 2025.
Thank you for reading.
Your comments show your continued support and helps activate the bots to do the same. Show them some love!
Namaste.

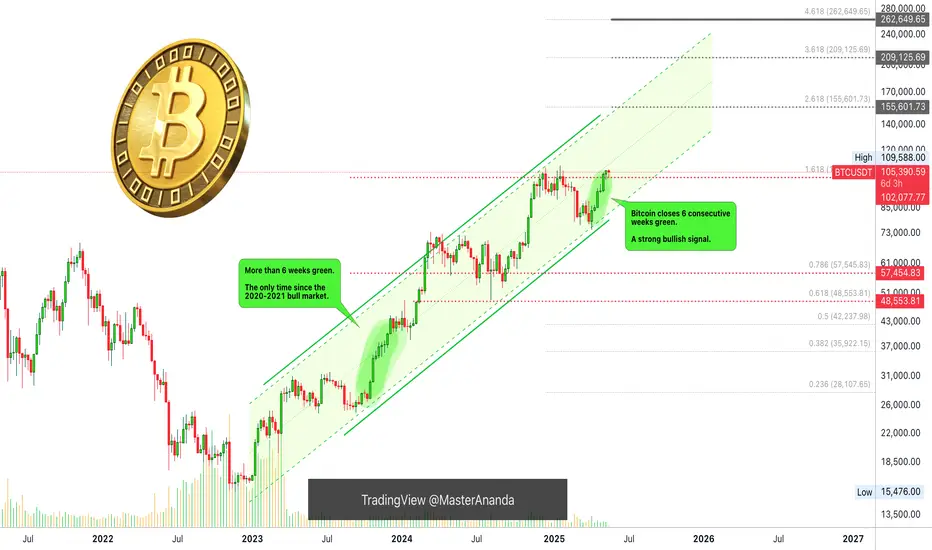
Bitcoin: Top Altcoins Choice —Your Pick (Session 7)We've identified Bitcoin's strongest support in this current cycle thanks to some long-term numbers I extracted when calculating the size of the 2021-2022 bear market.
These numbers have been working great on a long-term basis so we can continue to use them moving forward.
You could extract these numbers right on November 21 2022 and see how good they have been working:
— The August 2024 low matched perfectly the 0.618 Fib. on the chart.
— The new All-Time High, final resistance and now support matches perfectly the 1.618 Fib. level on this chart.
— Bitcoin's next strong resistance zone sits at 2.618 Fib. or $155,601.73. If you really need an intermediary level before 155K, you can consider $137,000. This is another relevant resistance.
— We know now for certain that the strongest support ever for this moment now is $102,000. As long as Bitcoin trades above this level, ultra-bullish confirmed. Wow, if it moves and closes below.
Top Altcoins Choice —Your Pick (S7)
This time, let's do it differently. I only need your choices to find some interesting pairs, to look at something different.
Go to the comments section and share ALL your favorite Altcoins. Can be the ones you like most, the ones you trade, the ones you hate, the ones you love, the ones you see with huge potential or the ones you want me to look at for any purpose.
I will pick and choose and publish in my profile those that look good. I will also reply in the comments with an analysis if I reach my publishing limit for the day.
I need your support. Which one is your TOP ALTCOIN CHOICE? (TAC!)...
Comment below!
Namaste.
Market Psychology 101Good day traders and investors,
There are benefits to being (AWAKE) or at least there should be.
This is where I stand at the moment with the Bitcoin & crypto market. I do believe Is in the final stages of the bull market marked with a circle. The final stage has biggest gains and it happens in 30 to 45 days.
Most of what I wan to say is in the chart. Please, feel free to add something you feel I have missed or why you may disagree.
Kind regards,
Demetrios

TradeCityPro | Bitcoin Daily Analysis #96👋 Welcome to TradeCity Pro!
Let’s move on to the Bitcoin and major crypto index analysis. As usual, I’m going to review the triggers for the New York futures session.
⏳ 1-Hour Timeframe
As you can see on the 1-hour chart, yesterday we had a bullish move that extended up to the 106247 level.
🔍 However, as I previously mentioned, this is a very sensitive zone for price action, and we might see sharp reactions from it. That’s exactly what happened—price faced a strong rejection after reaching this level and dropped down to 102882.
📊 Market volatility is currently very high, and the risk of getting stopped out in either direction is significant. So we need to be cautious and avoid getting caught in fake moves.
💥 Personally, I recommend avoiding trades right after such volatility and waiting for a new structure to form. But if you’re planning to take a position, keep the risk very low.
⚡️ For a short position, our first trigger is a break below 101628. Alternatively, we could also enter based on how the price reacts to 102882.
📈 For a long position, we currently have no clear setup until price structure forms. The only long triggers I can give for now are the breakouts of 104800 and 106247.
👑 BTC.D Analysis
Bitcoin dominance has started a new uptrend and has even closed above 63.71. Given the healthy structure of this trend, if 64.04 breaks, we can confirm a full bullish breakout for BTC.D.
💫 If BTC dominance continues rising while the market moves up, Bitcoin will likely outperform most altcoins.
📅 Total2 Analysis
Looking at Total2, the 1.17 support broke yesterday, and now this index is set up for further downside correction. For now, it seems the market is in a decision-making phase.
🧲 If we get a lower low and lower high below 1.17, the chance of a move toward 1.1 increases significantly.
📅 USDT.D Analysis
Now for USDT dominance—yesterday it faked out the 4.60 level twice and is currently holding above 4.70, heading toward 4.82.
🧩 If this move turns out to be a fake and price stabilizes below 4.70 again, it would give us a strong signal for a bullish market and a bearish turn for USDT dominance.
❌ Disclaimer ❌
Trading futures is highly risky and dangerous. If you're not an expert, these triggers may not be suitable for you. You should first learn risk and capital management. You can also use the educational content from this channel.
Finally, these triggers reflect my personal opinions on price action, and the market may move completely against this analysis. So, do your own research before opening any position.

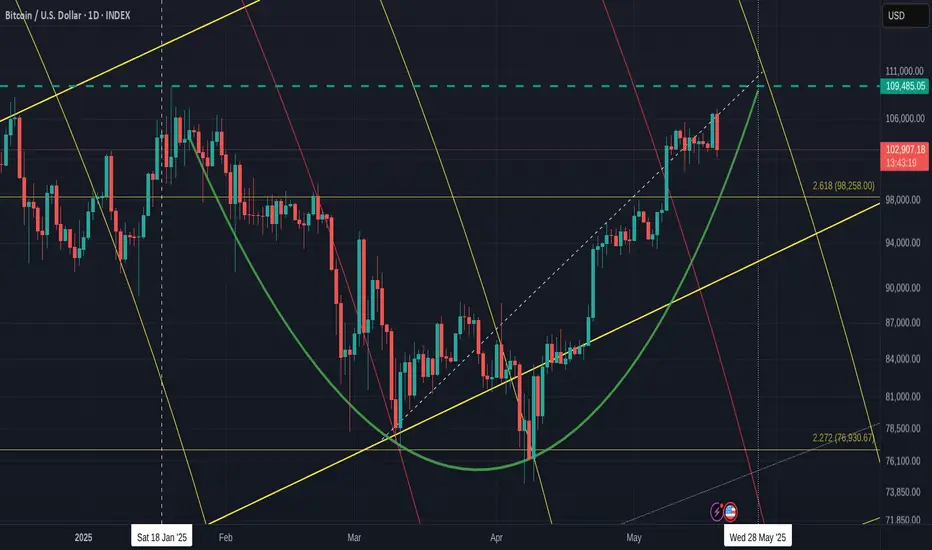
BITCOIN Daily Bullish / Bearish days ahaed with Big push after
Even though I have mentioned that we maybe in for some RED days this week, this chart shows how, ultimately, we are in a Bullish momentum still.
The CUP pattern that we have printed ( adjusted since I last posted this) , Goes from ATH line back to the ATH line.
We also see how there is this APEX that PA has fallen into that has its peak at the end of this month.
PA always reacts before the APEX
But before this, we may range across or drop down onto the CUP. This has Strong support and could possibly propel PA above thaT ATH line.
We do need to also understand, there is a 618 Fib circle at this intersection and that may not be easy to break through.
But PA has often searched out intersections of resistance to break through and so I am looking to this as the way forward.
The 2.618 Fib Ext on this chart may also offer support at around 98K if we loose support higher.
The RSI is already dropping from OverBought and so will probably continue to do so till we reach Neutral / Over Sold again.
And the Daily MACD, is also turning Bearish, But as mentioned before, this is possibly repeating what happened in Nv 2024
See the Arrow on the left...The Histogram is the one to take note of. Two Green peaks and then a red Dip
We have just begun the Red bit after the two Green peaks.
The scale is larger here and so we may have to wait longer till we return out of the green.
In 10 dayts, we will be near end of month
So, for me, this week will be possibly Red but towards the end of the month, things will begin to move higher.
All depends on PA following expected patterns and that does not always happen
We can only look, plan and react.
BTCUSDTHello Traders! 👋
What are your thoughts on BITCOIN?
As expected, Bitcoin entered a corrective phase after reaching a key resistance zone. This move was accompanied by a bearish divergence, indicating weakening bullish momentum.
We expect the correction to extend toward the identified support zones, where price may find demand.
If Bitcoin holds at one of these key support levels, a bullish reversal could follow, potentially leading to a new upward leg and fresh all-time highs.
Is this correction setting the stage for the next big move? Share your thoughts below!
Don’t forget to like and share your thoughts in the comments! ❤️

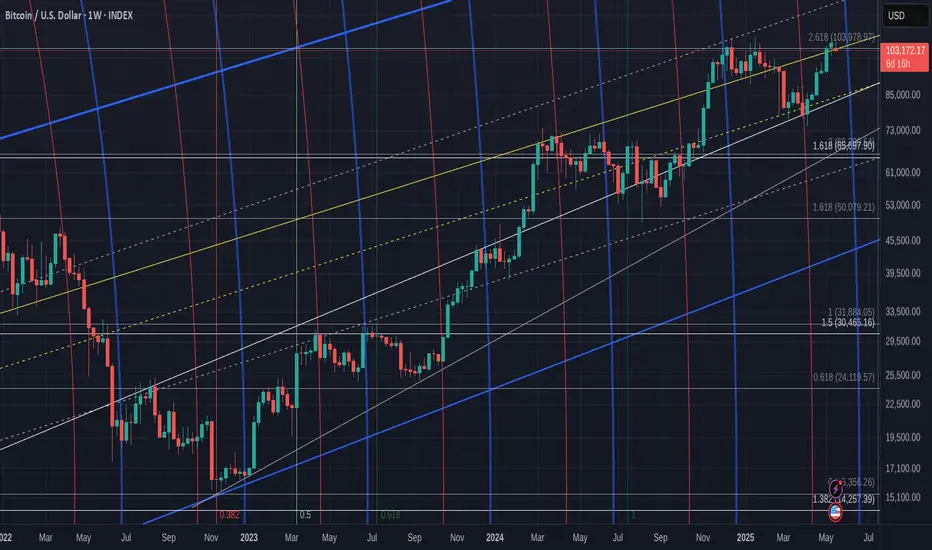
Bitcoin Weekly Closed GREEN -opens RED. Whats next ? After 6 consecutive Green Weeks, Bitcoin maybe about to Turn around and Cool for a bit.
BUT DO NOT PANIC
We have opened the week with a sharp drop back below the 2.618 Fib Extension. This in itself is a major move if unsurprising
Last week, we talked about this possibility by looking at the Daily MACD.
MACD Rising above the Signal line is a Bullish indication and Visa Versa
See the Arrow on the left, how MACD had 2 slight pullbacks and then went higher. This was in Nov 2024, just as the Ranging was finishing and PA was getting ready to push up to its Current ATH line
What I was looking at mostly though, was the Histogram. The Histogram shows us the distance between the MACD line ( yellow ) and its Signal line ( Red ) . The Bigger the bar, the bigger the difference between them.
See how it rose twice and then, went red for 2 days, recovered for a day and then , OFF WE WENT
And I am suggesting this is what may happen again.
So far, that pattern is repeating and the Histogram just went Red.
We may need to understand the difference in scale of this histogram though.
This could point towards a Week of unsettled PA, maybe Longer.
Notice how the MACD ( yellow) has now dropped below the Signal line ( red) as it did in Nov 2024.
During this period of MACD dropping and going red in 2024, we had 6 days of Red PA candles before the Bigger push higher. This may take longer this time but we have to wait and see.
We need to watch this close as the lines of support are in different place now.
If We zoom in on the Weekly PA chart, we see things a little more clearly
PA has fallen back below a line that was required as support. If you Look back to Nov 2024 area, we can also see a very Big difference in how PA is on the lines of support.
In 2024, we bounced off support.
We are currently being Rejected.
This Daily chart offers some more detail
The Circled area is the Nov 2024 area I been talking about.
Todays pull back is sharper but as we saw with the Histograms, we are in a bigger scale anyway
We could also see a similarity if we look back before the Circled area, see the W shape? A Double Bottom that appeared just before the push up.
Well, we just did that too.......If you back from where we are now, to the Low..There were 2 Dips down and then we pushed higher.
And, again, It is the scale that is Bigger.....
So, for me, this week maybe a bit bloody, but over all, Still Highly BULLISH
We need to regain that 2.618 Fib ext on this chart as support but that may not happen just yet.
There are "Local" lines of support near by and the LOG Daily chart I will post later gives some hope that Big Drops may not happen
The line of resistance just over head is strong and untill we break 112K and Hold it, we are likely to remain being bounced around.
But I do believe we Will do this and that we do seem to be repeating a pattern that led to a Goodpush higher.
We just have to wait and see
Bitcoin (BTC/USDT) - Support Trendline & Zone Price Test - DailyBitcoin (BTC/USDT) price recently rejected down from $107000 on May 19th, 2025.
The yellow Support Trendline below is currently being tested ($103000 price level).
Several candle body closes below the Support Trendline could signal weakness in the daily price trend (potential rising wedge pattern).
The April inverse head-and-shoulders price pattern and targets have been completed (+12% and +24%).
note: Breaking news, government law changes, corporate announcements, and crypto crime could affect the Bitcoin price and charts.

TradeCityPro | IOTA: Testing Key Resistance in RWA-DePIN Rally👋 Welcome to TradeCity Pro!
In this analysis, I’m going to review the IOTA coin for you. This project is one of the RWA and DePIN-based initiatives and is among the older projects in this category.
✔️ The coin has a market cap of $822 million and ranks 85th on CoinMarketCap.
📅 Daily Timeframe
As you can see on the daily timeframe, after finding support at 0.1547, the price initiated a bullish leg and moved up to the resistance zone I’ve marked.
💥 This area is a very significant resistance zone, and in this bullish leg, the price has reached it for the first time and got rejected.
🔍 In my view, as long as the price hasn’t confirmed a breakout above 0.1960, the chance of starting a downtrend is higher than continuing the current uptrend. If this resistance zone is broken, we can consider it strong confirmation of buyer strength.
📈 For a long position, we can enter on the breakout of this same zone. For spot buying, this trigger can also be used, but the main long-term triggers are 0.3774 and 0.4918.
⚡️ On the RSI oscillator, there's an important zone at the 50 level. If this level is broken, the probability of breaking 0.1960 increases. If that happens, the next support zone will be 0.1547.
📊 Make sure to pay close attention to volume. If any of our triggers are activated without volume confirmation, the likelihood of a fake breakout increases.
❌ Disclaimer ❌
Trading futures is highly risky and dangerous. If you're not an expert, these triggers may not be suitable for you. You should first learn risk and capital management. You can also use the educational content from this channel.
Finally, these triggers reflect my personal opinions on price action, and the market may move completely against this analysis. So, do your own research before opening any position.
