Short-term BITCOIN analysisShor-term
In my opinion, Bitcoin could make a move towards $113,000-115,000 and then start moving upwards. In any case, according to previous analysis and apart from short-term fluctuations, it could touch the target of $140,000-150,000.
Good luck
NEoWave Chart
Cryptomarket

Bitcoin Dominance – Critical Breakdown on the Horizon
Bitcoin dominance is currently testing a major long-term resistance zone formed by the upper boundary of a multi-year wedge. After months of steady climb, the structure is now showing the first signs of exhaustion
If dominance loses the key 60% support zone, that would mark a major structural shift — historically followed by downtrends in dominance and strong capital rotation into altcoins.
Until dominance reclaims the upper trendline or regains bullish momentum, the risk-reward now favors altcoins. Momentum is shifting. Altseason might just be around the corner.

ETH on the 1H
After rejecting the 0.236 Fib level, price found support at the 200MA.
RSI cooled off slightly, giving room for another move before hitting overbought.
MACD just flipped bullish, pushing price higher.
MLR > SMA > BB Center — structure confirms upward momentum.
Now price is back at the Fib level.
It looks fresher than yesterday, but needs clean closes above to build traction for a real breakout.
We’ll be here watching.
Always take profits and manage risk.
Interaction is welcome.

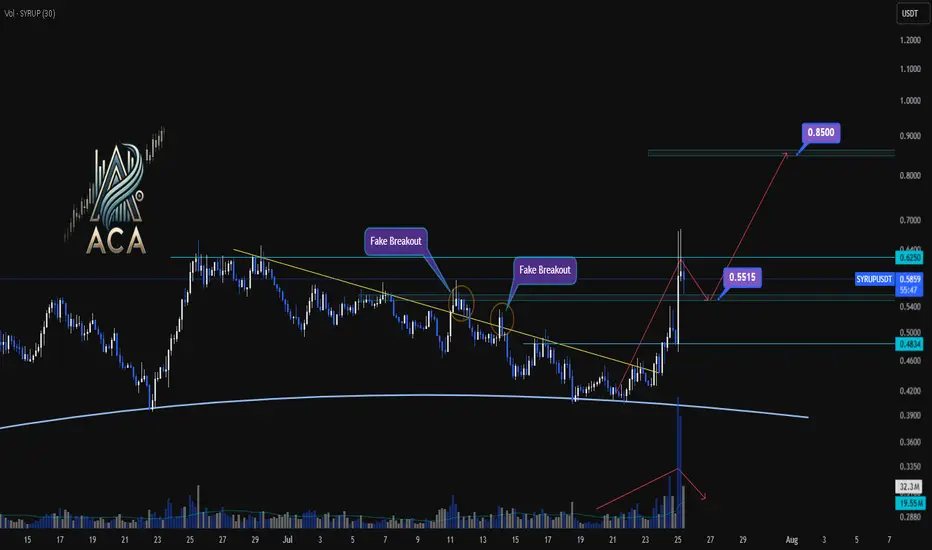
SYRUPUSDT 4H Chart Analysis | Trendline Breakout & Next MovesSYRUPUSDT 4H Chart Analysis | Trendline Breakout & Next Moves
🔍 Let’s break down the latest action on the SYRUP/USDT 4H chart and pinpoint what comes next as trend and momentum cues line up for traders.
⏳ 4-Hour Overview
- The recent breakout above the key trendline was backed by a surge in volume, providing clear momentum confirmation and pushing price toward resistance.
- Price has already reached 1.5R of the initial breakout target, a strong sign the trend is in motion.
- Upon touching the $0.6250 resistance, momentum cooled, with volatility decreasing — a classic consolidation phase after a high-energy move.
🔻 Correction & Structure
- With volume subsiding and momentum slowing post-$0.6250, we’re now expecting a corrective move down toward $0.5515.
- This retracement zone will be critical to watch for higher low formation – a bullish structural signal if supported by volume confirmation.
🔺 Long Setup:
- Should SYRUP reclaim and break above $0.6250 after setting a higher low at $0.5515, and with renewed volume, we could see another strong leg higher.
- The next major resistance sits around $0.85 — this aligns as a logical upside target based on the range extension.
📊 Key Highlights:
- Trendline breakout with sharp volume spike = momentum confirmation.
- 1.5R reached before first deep pullback; structure remains bullish above $0.5515.
- Watch for a higher low and subsequent break of $0.6250 with volume to confirm the next move to $0.85.
🚨 Conclusion:
SYRUP’s chart is at a pivotal juncture: a constructive pullback to $0.5515 could set up the next wave higher if supported by volume. A confirmed breakout above $0.6250 targets $0.85 — stay patient and wait for volume signals at key levels.
Bitcoin & 150k TOPBitcoin has been trading within a rising channel for a long time, with resistance at $150,000. The middle support/resistance line also indicates $150,000, suggesting a potential significant rejection at this level.

BTCUSD 4HOUR TIME FRAME ANALYSISCurrently bearish on the 4-hour chart with lower highs and lower lows forming consistently.
Price Action: BTCUSD recently broke below a key support zone around 116,000, turning it into a fresh resistance. The market shows bearish momentum as price fails to reclaim above that zone.
Candlestick Patterns: Multiple bearish engulfing candles confirm selling pressure near the 115,500–116,000 area.

ARUSDT: Crypto Summer Game PlanBINANCE:ARUSDT
RWA + AI coin, two narratives that will be hot
Not inflationary, 99% supply circulating
People really use it for permanent storage
Main CEX liquidity is very thin in AR -> possible God candles like in previous history
Possible supply shock at late stage
Main risk is community governance and hacks. Otherwise in case of altseason this should meet the marked targets. Preferable accumulation zone is <5 USD, most probably not available anymore.

Bitcoin’s Epic Run from 80K to 120K: What’s Next for BTC?Yo traders, it’s Skeptic from Skeptic Lab! 🩵 Diving into Bitcoin’s wild ride from 80K to 120K—breaking down the key supports, resistances, and what’s next for BTC.
From the $76k bounce to smashing $110K, we’re eyeing the $120K PRZ. Will it correct or keep soaring? Check the video for the full scoop! Drop your thoughts or coin requests in the comments, boost if it vibes & Let’s grow together!

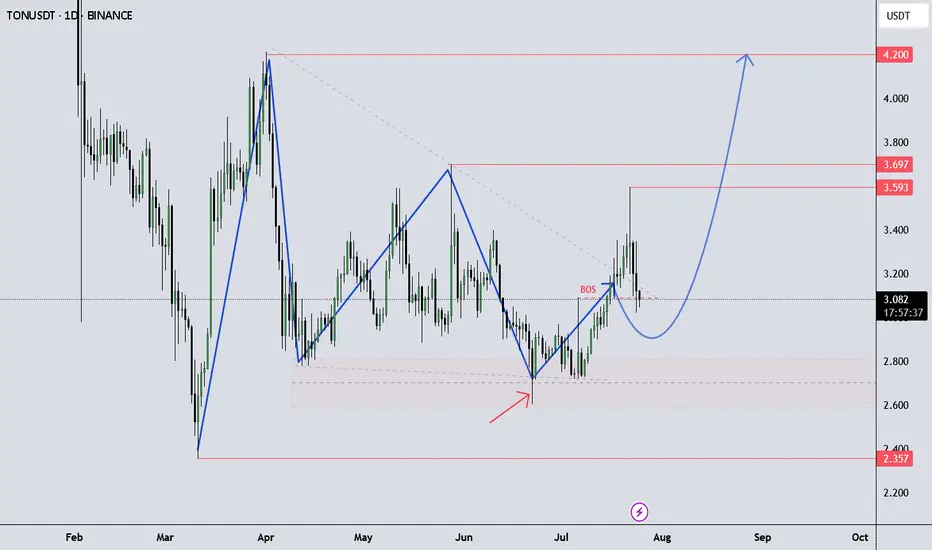
TONUSDT continue up!Looking for an Impulse Up – TONUSDT Outlook
TONUSDT is showing momentum to the upside as it continues its current structure, possibly developing another impulsive leg.
It’s important to follow your own trading plan and maintain proper risk-reward (RR) discipline.
This idea is shared for educational purposes only to support your learning.
Got questions? Feel free to drop them in the comments!
BTC / USDT : Broke down and now going for retestBitcoin Analysis:
Bitcoin has broken down and is now retesting the support zone. As mentioned earlier, a shakeout can happen at any time, and this looks like the potential retest phase.
Bullish Scenario:
Reclaims Resistance: If BTC manages to break through the resistance after the retest, it will stabilize for the short term. This could lead to a move towards higher levels.
Bearish Scenario:
Failure to Break Resistance: If the retest fails and BTC can't reclaim the resistance, further downside could be expected.
Targets: Keep an eye on the CME gap at $114,000 and 92K as key levels to watch for potential price action.
Note:
Manage your risk carefully. The market is volatile, and a shakeout could happen anytime. If BTC fails to break resistance after retest, more pain may be ahead.

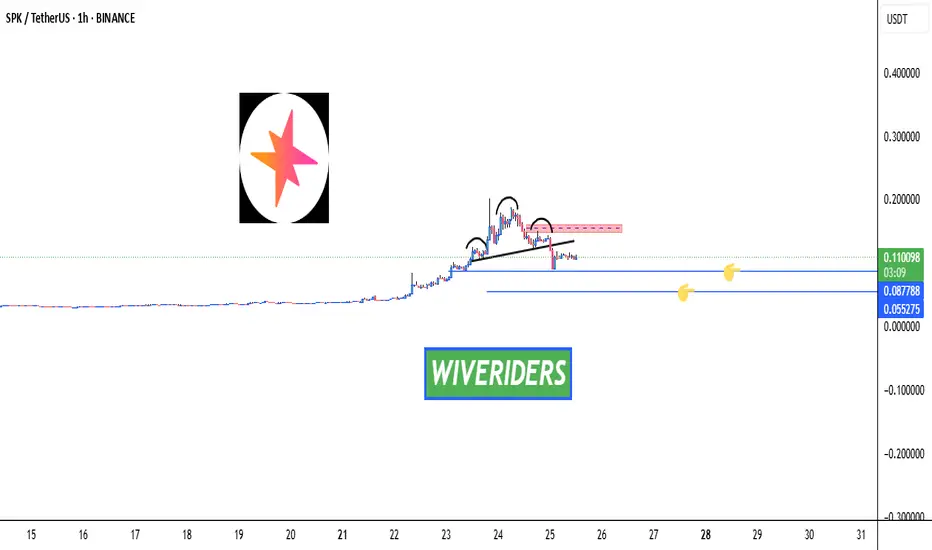
SPK Market Update – Key Levels Ahead 🚨 SPK Market Update – Key Levels Ahead 🔄📉📈
SPK previously formed a bearish Head and Shoulders pattern, which was confirmed by a breakdown. So, what’s next?
🔹 Option 1:
Price could move down to the two blue support levels — these zones may offer potential long entries, as buyers were active here before. Watch for confirmation! 👀
🔺 Option 2:
We also have a red resistance zone, located around the right shoulder of the H&S.
If INDEX:SPK breaks above this zone, it may signal the return of buyers and a potential bullish reversal.
“BNBUSD Educational Breakdown – Support Rejection “BNBUSD Educational Breakdown – Support Rejection with $846 Target in Sight”
Market Structure Overview:
BNBUSD is exhibiting a bullish market structure after forming a textbook higher low at the major demand zone near $740–$750. This zone has been historically significant, offering strong rejections and triggering aggressive bullish rallies.
A new bullish wave appears to be forming after price respected the ascending trendline and reclaimed the supertrend level, now acting as dynamic support around $782.2.
⸻
🔧 Technical Confluences:
• Support Zone: Highlighted between $738–$750, serving as a demand base. Recent price rejection here confirms buyers’ dominance.
• Trendline Support: Price has respected an ascending trendline, signaling short-term trend continuation.
• Supertrend Confirmation: Trend flip has occurred—price is now trading above the Supertrend line, indicating a fresh bullish momentum phase.
• Break of Structure (BoS): Minor resistance around $784–$790 was breached, suggesting bullish continuation.
⸻
🎯 Target Projection:
Using recent swing highs and market symmetry, the next logical resistance lies at $846.9, aligning with the previous supply zone. This target also fits within the measured move from the support base to previous highs.
⸻
📈 Trade Plan (Educational Only):
• Long Bias Zone: Between $770–$780
• Invalidation Level: Below $738 (loss of support structure)
• Target: $846.9
• Risk-Reward: Roughly 1:2.5 – favorable for swing traders
⸻
📚 Educational Note:
This chart is an excellent example of:
• Structure trading (support/resistance)
• Trend confirmation using a dynamic indicator (Supertrend)
• Risk-managed entries with clearly defined stop-loss and take-profit zones.

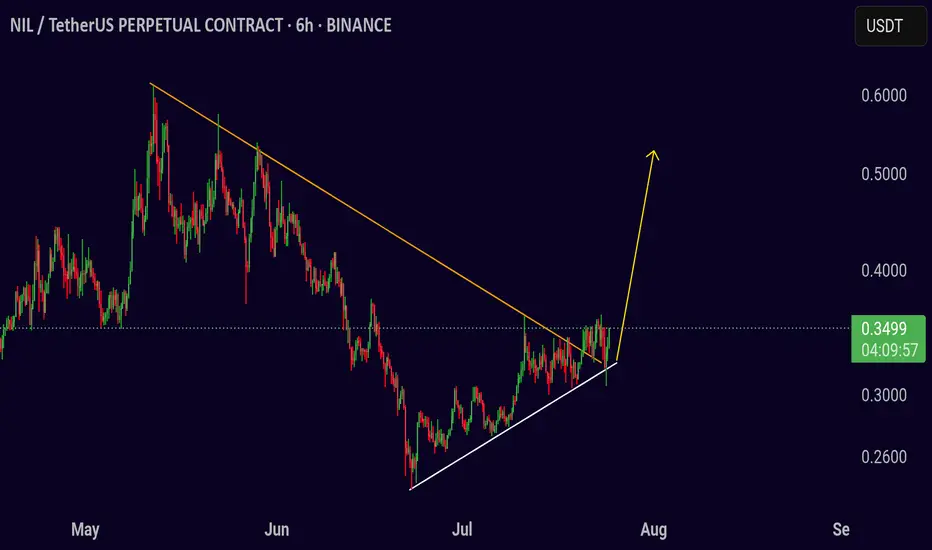
Trading Setup NILUSDT
Trading Setup:
A breakout is seen in the NIL/USDT pair (6h).
Price can move towards the following targets.
⬆️ Buy now or Buy on 0.3500
🛑 SL @ 0.3200
🔵 TP1 @ 0.3800
🔵 TP2 @ 0.4100
🔵 TP3 @ 0.4500
Risk Warning
Trading crypto, futures, and CFDs involves risk. Only trade with margin you can afford to lose. Past performance does not guarantee future results.
If you like this setup, support with a 👍 and share your thoughts.
Smart Money Trap Identified! FVG + Liquidity Grab“Smart Money Trap Identified! FVG + Liquidity Grab Before Super USD Skyrockets to Target Zone ”
⸻
🧠 Technical Breakdown:
1. Liquidity Sweep (Manipulation Phase):
We see price aggressively sweep local liquidity around July 23, likely triggering stop-losses of early longs or breakout traders. This is a classic Smart Money trap, where big players induce volatility to grab liquidity before a move in the real direction.
2. Fair Value Gap (FVG):
A clear bullish FVG (imbalance) has formed post-liquidity grab, suggesting a potential institutional entry zone. This imbalance typically acts as a magnet for price and an entry point for Smart Money after manipulation.
3. Demand Zone & Target Projection:
• Price is now reacting from a well-defined Demand Zone, with clear rejection wicks indicating aggressive buying interest.
• The target zone (0.88334882) sits just below a previous supply zone, aligning with a potential distribution area where Smart Money may begin profit-taking.
4. Supertrend Indicator:
The supertrend has flipped bullish, confirming potential momentum shift, supporting the bullish bias as long as the FVG holds.
5. Confluence Factors:
✅ Liquidity Grab
✅ FVG Reaction
✅ Demand Zone Bounce
✅ Supertrend Confirmation
✅ High-Risk/High-Reward Entry Before Smart Money Run
⸻
🎯 Trade Idea (For Educational Purpose Only):
• Entry: On pullback into the FVG zone
• Stop Loss: Below the recent swing low or Demand Zone
• Target: 0.8833 (inside the upper supply/demand imbalance)
⸻
🧠 Educational Note:
This chart beautifully showcases how market makers operate — manipulate liquidity, fill imbalances, and target inefficiencies. Always think like Smart Money, not retail traders.

BTC 4H – Dance with the 200MA
Bitcoin continues its strong relationship with the 200MA.
Each time price dips below it, fear spikes — but bounces off key Fib levels have followed, with price then riding higher alongside the 200MA.
Right now, price is caught between the 200MA and a nearby Fib level.
Here’s what could happen next:
– Price flips the Fib into support, ideally with help from a rising 200MA.
– Price waits for the 200MA to catch up, and they break the Fib together.
– Or, we get another panic dip, and the bounce comes after another test from below.
Whichever path it takes, we’ll be here watching it unfold.
Always take profits and manage risk.
Interaction is welcome.

Huge Bear Trap next in line??Ethereum Exit Queue: 518,180 ETH
Half a million ETH is currently queued for unstaking on Ethereum...
Keep in mind, August 1st, Trump's Reciprocal Tariffs get in effect
Everyone's talking about BTC's new ATH, ETH's rally, XRP new ATH, but no one is talking about August 1st...
Manipulation is taking place. Stay safe, because a huge bear trap might be next in line (BTC back to 90K)
*NOT INVESTMENT ADVICE*
#crypto #ethereum #eth #btc #bitcoin #trading #xrp #trump #tariff #finance #economy

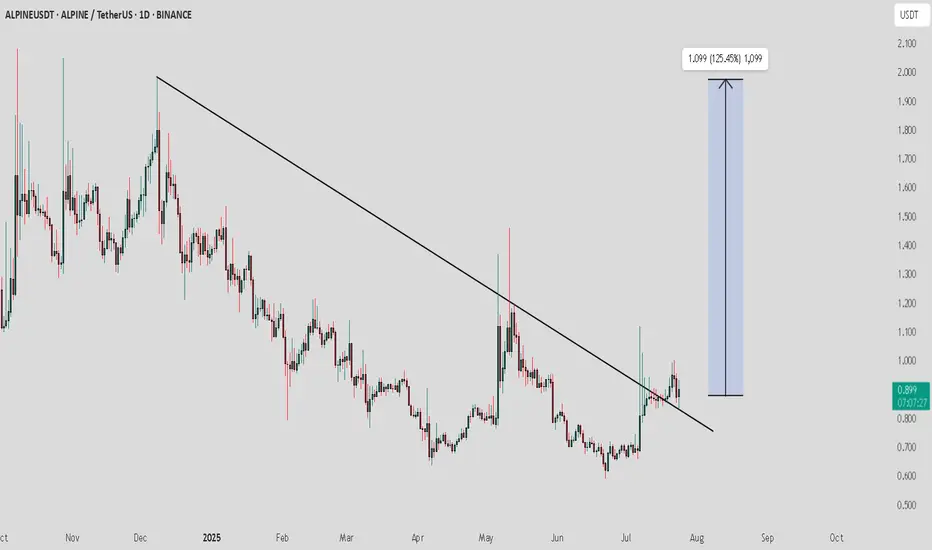
ALPINE / USDT : looking bullish ALPINEUSDT Analysis:
The price is currently retesting the downward trendline. This is a crucial point where the price may either bounce off or fail to hold the trendline, signaling the next major move.
Bullish Scenario:
Trendline Retest and Bounce: If the price holds above the trendline and shows bullish momentum, we could see a rise towards 1.099 (125.45% potential upside).
Confirmation: Look for strong buying volume during the retest to confirm the bounce.
Bearish Scenario:
Trendline Breakdown: If the price fails to hold the trendline and breaks below it, this could trigger a downward move.
Target: Watch for the next support levels to gauge the potential downside.
ETH 1H — Decision Point Ahead
ETH just confirmed a bullish RSI divergence, with price finding support at the 200MA.
MACD supports the move, and the trend structure is clean: MLR > SMA > BB Center.
Now, price is hovering at the 0.236 Fib level.
A few strong closes above it could open the door for more upside.
If rejected, we might revisit the 200MA for another test.
Either way — we’ll find out soon.
Always take profits and manage risk.
Interaction is welcome.

Ether is About to Break the FlagETH is making an attept to break flag formation. 3860 top could be the short term target for upward moves. Over the medium term, 4100 could be the main target. Our bull cycle top target is 6830 for the moment. This was a quick update,please check our earlier post for details.

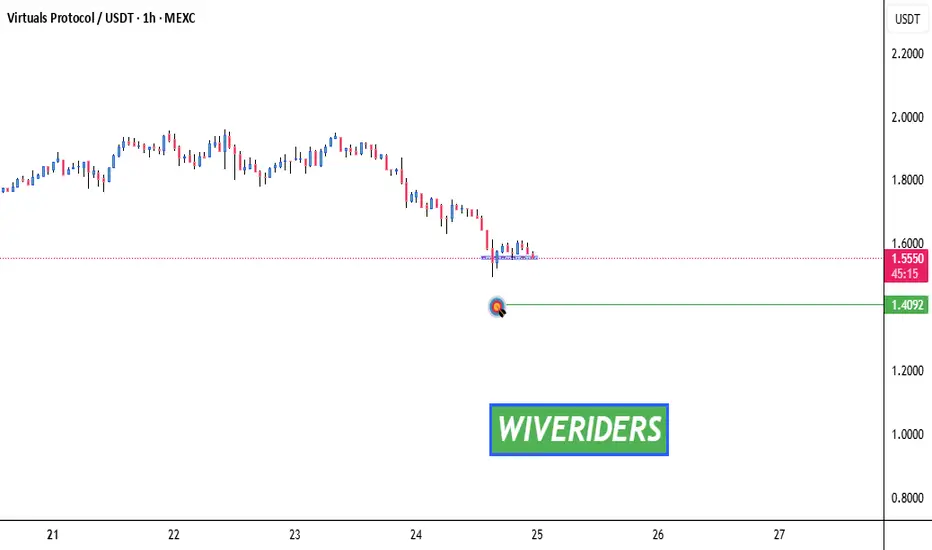
Testing Blue Support – Key Level Ahead!🚨 SPARKS:VIRTUAL Testing Blue Support – Key Level Ahead! 📉🔵
SPARKS:VIRTUAL is currently testing the blue support zone.
📊 If a breakdown occurs, we could see a move toward the green line level as the next target.
🛑 Watch for confirmation — this could signal further downside if sellers take control.
ETH Dominance – Golden Cross, New Era?This is ETH Dominance on the Daily chart.
A golden cross just printed, and the last time we saw this, at similar levels, was February 2020. Back then, dominance climbed steadily, bouncing off the 200MA repeatedly.
Today, price is approaching the 0.236 Fib level, which could act as short-term resistance and send us back to retest the 200MA as support.
But unlike 2020, everything has changed:
– ETH is getting institutional support via ETF flows
– The SEC confirmed ETH is not a security
– The RWA narrative is gaining serious traction
That’s why this golden cross could mean more than just a signal, it may be the start of a much stronger structural uptrend.
My humble guess?
ETH Dominance continues climbing with the 200MA as support.
It won’t be a smooth ride, but the direction might be set.
Always take profits and manage risk.
Interaction is welcome.

BTCUSDTHello Traders! 👋
What are your thoughts on BITCOIN?
After setting a new all-time high, Bitcoin remains in a corrective phase, marked by sideways price action and choppy movements.
There's a notable gap around the $114,000 level, which may act as a magnet for price during this correction.
The ongoing pullback is likely to extend toward the key support zone, which aligns with the previous breakout level and the bottom of the ascending channel.
Once this support holds, we could see a bullish reversal, targeting the upper boundary of the channel once again.
As long as Bitcoin remains above the marked support zone, the overall structure stays bullish and this correction may present a buy-the-dip opportunity.
Will Bitcoin fill the gap and bounce back toward new highs? Let us know your thoughts! 🤔👇
Don’t forget to like and share your thoughts in the comments! ❤️

TradeCityPro | Bitcoin Daily Analysis #136👋 Welcome to TradeCity Pro!
Let’s get into the analysis of Bitcoin and major crypto indices. As usual in this analysis, I’m going to review the futures triggers for the New York session.
⏳ 1-Hour Timeframe
On the 1-hour timeframe, price is still ranging inside the box, and none of its triggers were activated yesterday.
✔️ The support floor is at 117,342, and another key support zone is around 116,000.
✨ If these zones break, Bitcoin may begin a deep correction. In that case, we can open short positions or close long-term long positions that we’re already holding.
⭐ For long positions, we still have the 119,395 and 120,594 triggers. A breakout of either zone could provide a very good entry point for the next bullish leg of Bitcoin.
👑 BTC.D Analysis
Let’s move on to Bitcoin Dominance. Yesterday, dominance stabilized above the 61.20 zone, and as I mentioned before, breaking this zone led to a bullish leg, which continued up to 62.41, and currently, it has more bullish momentum.
💥 If 62.41 breaks, the bullish momentum will intensify. However, I still believe the overall trend is bearish, and if 60.46 breaks to the downside, the decline could continue.
📅 Total2 Analysis
Let’s go over Total2. This index has continued to correct and has now dropped to the 1.41 zone, which corresponds to the 0.5 Fibonacci level. It has now created a trigger around 1.47.
⚡️ If 1.47 breaks, we can open a long position. Our next trigger will be 1.53.
A breakout of 1.53 would signal the start of the next bullish wave.
📅 USDT.D Analysis
Now to Tether Dominance. This index has finally exited its range box and has broken the 4.25 level.
The current resistance stopping price is 4.36.
🔔 If dominance drops back below 4.25, strong bearish momentum could hit, increasing the likelihood of a breakdown of 4.13.
❌ Disclaimer ❌
Trading futures is highly risky and dangerous. If you're not an expert, these triggers may not be suitable for you. You should first learn risk and capital management. You can also use the educational content from this channel.
Finally, these triggers reflect my personal opinions on price action, and the market may move completely against this analysis. So, do your own research before opening any position.
