What’s Next? 🚨 $FARTCOIN Cup & Handle Pattern Forming – What’s Next? 📈
$FARTCOIN has formed a bullish Cup & Handle pattern — but is it over?
❌ Not yet. $FARTCOIN hasn’t shown any strong bearish signals for now.
🔍 We’re watching two key green line levels below.
📉 If the price drops toward these zones, we may see buyers step back in — creating a potential entry, but only with confirmation.
✅ Stay patient — no rush to jump in without a setup. Let the chart guide us.
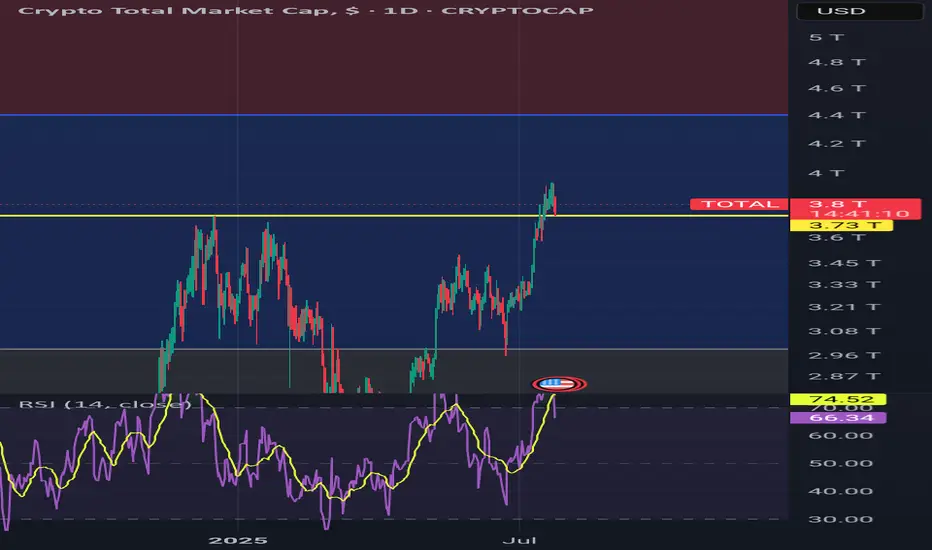
Cryptomarket

BackTest should be COMPLETEDLet's see what comes next , rally to new ATH ? maybe some other corections along the way , or another wick close to bottom to scare thenpaper hands ? 🤔
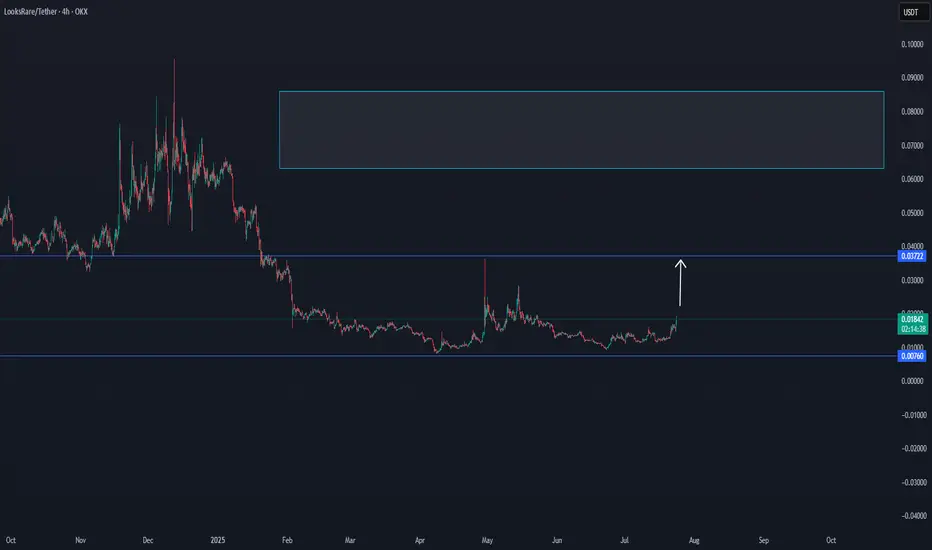
LOOKS/USDT NEW INCREASE VOLUMELooks seems to have trending on a low time frame new increase trending, following to see if this coin is able to get confirmed in the next hours.
BTC market update Bitcoin Market Update:
Bitcoin is currently consolidating, and the market is indecisive. It's better to watch closely for a breakout or breakdown before making any trades.
Bullish Scenario:
Breakout above resistance could lead to a strong bullish rally. Target: Next resistance level.
Pro Tip: Confirm with high volume for a valid breakout.
Bearish Scenario:
Breakdown below support could trigger strong selling. Target: Next support level.
Pro Tip: Watch for confirmation with increased selling volume to avoid fakeouts
Conclusion:
Wait for clear breakout or breakdown to trade. Avoid entering blindly.
XRP Bear flag confirmed. Looking for support in the decline.XRP bear flag identified on Monday 22nd has now confirmed with a nice 12% short sell.
This signals do not always confirm but when they do it is satisfying that the analysis and patience has paid off.
Trading is all about controlling emotions and being patient. Wait for the confirmation before executing.

Bitcoin · $137,000 Next Target Followed by $155,000There won't be a correction for Bitcoin. Not now, not yet. The reasons why I already explained in several earlier publications that predicted the current scenario. The bullish breakout that is from the long-term consolidation range. That's the reason, that's the reason why Bitcoin will not go lower without first going higher.
Since Bitcoin consolidated for 7 months below $110,000, it will continue climbing until it reaches higher.
The next target is $137,000. At this point a correction can develop and if it does, we don't expect this correction to last long. The correction can be strong, deep, surprising, but it cannot be long in duration. That is because Bitcoin is headed toward $155,000 and that's the main level for this bullish wave. Until this target is achieved, nothing can stop the future of finance, Bitcoin is moving ahead.
The proof is in the altcoins market. "The altcoins follow Bitcoin." In the current situation, Bitcoin is consolidating while the altcoins grow. If Bitcoin were to crash, the altcoins wouldn't move one dollar higher. In fact, they would be crashing even stronger and faster.
Bitcoin would need to just falter for one day for the altcoins to crash to new lows. What is happening now? Bitcoin can shake; Bitcoin drops; Bitcoin consolidates, and the altcoins continue to grow. That's the proof that the next main—major—move is an advance for Bitcoin. Never SHORT Bitcoin when the market is bullish and strong.
Bitcoin is a growing phenomenon, it is very young. Just think of the US Dollar or Gold. How old are these instruments? How old are market securities and stocks? Some corporations are hundreds of years old. Countries? Thousands of years and still living... Bitcoin can have a life span of 80 years, 140 years, 200 years, 500... who knows. It is a question market. But there is no doubt that it is young. When you are young, you cannot stop your own growth. Bitcoin is already growing and will continue to do so. I will not be surprised when I see Bitcoin trading at $1,000,000+. It might take several years, but several years back Bitcoin was trading at $5k. What's the price now?
$120,000. Trading near resistance is bullish. No corrections. No drops. No retrace.
Thank you for reading.
Namaste.

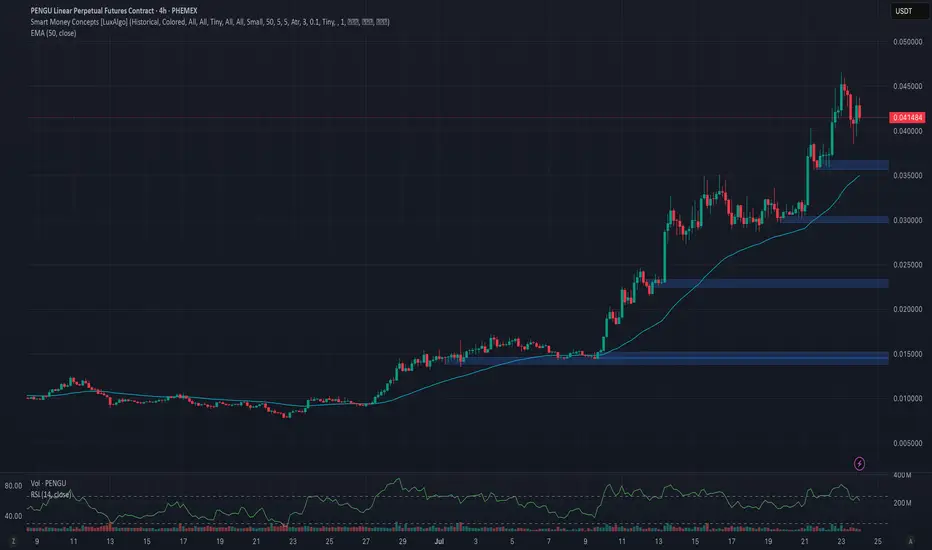
Phemex Analysis #99: PENGU Explodes 480%!Will the Hype Continue?Pudgy Penguins (PENGU), a playful and increasingly popular meme coin, has recently made waves in the crypto market due to its rapid price movements and strong community support. Originally inspired by the beloved Pudgy Penguins NFT collection, PENGU has rapidly transitioned from niche interest to broader market phenomenon.
In recent trading, PENGU surged impressively by nearly 480%, primarily fueled by major exchange listings and growing influencer endorsements. Currently trading around $0.041, PENGU has caught the attention of both meme-coin enthusiasts and seasoned crypto traders, sparking debates over its next big move.
With significant market attention and notable volatility, traders now face an essential question: Is PENGU poised for further explosive growth, or should traders brace for a potential pullback? Let's carefully evaluate several likely scenarios.
Possible Scenarios
1. Bullish Breakout (Continuing the Hype!)
PENGU’s recent price action suggests bullish momentum may persist, especially if the community-driven hype continues. A decisive breakout above recent resistance at $0.046—particularly if supported by increasing trading volumes—could accelerate the bullish trend, targeting next levels at $0.05 and possibly the psychological level of $0.08.
Pro Tips:
Entry Strategy: Consider entering positions only after confirmation of a high-volume breakout above $0.046.
Profit-Taking Targets: Plan partial profit-taking around next key resistance zones at $0.05 and $0.08 to manage risk effectively.
Risk Management: Set tight stop-losses just below recent support levels around $0.035.
2. Short-Term Correction (Healthy Retracement)
Given PENGU’s recent rapid rise, a short-term retracement to retest support levels around $0.035 or lower ($0.03) is likely. If this pullback happens on low volume, it could indicate a healthy consolidation rather than a full trend reversal.
Pro Tips:
Buying the Dip: Closely watch support at $0.035 and $0.03; a low-volume test of these levels might provide excellent entry points for traders who missed earlier rallies.
Volume Monitoring: Ensure low-volume retracements—high volume during declines might signal deeper bearish pressure.
3. Bearish Reversal (The Hype Fades)
As is typical with volatile meme coins, sudden reversals can occur if market sentiment swiftly changes. A high-volume drop below critical support around $0.035 could trigger more significant bearish sentiment, potentially targeting deeper support around $0.022 or even $0.0135.
Pro Tips:
Caution on Reversal Signals: Consider exiting or reducing positions if PENGU decisively breaks below key support levels with strong selling volume.
Accumulation Opportunities: Long-term believers might use significant pullbacks toward $0.022 or $0.0135 as strategic accumulation opportunities after price stabilization occurs.
Conclusion
Pudgy Penguins (PENGU) currently sits at an intriguing juncture, offering traders both opportunities and risks. Traders should carefully watch the outlined scenarios, particularly breakout signals above $0.046 and support levels around $0.035 and $0.03. Through disciplined entry and exit strategies, attentive volume analysis, and vigilant risk management, traders can navigate PENGU’s volatility and potentially profit from its next big move.
🔥 Tips:
Armed Your Trading Arsenal with advanced tools like multiple watchlists, basket orders, and real-time strategy adjustments at Phemex. Our USDT-based scaled orders give you precise control over your risk, while iceberg orders provide stealthy execution.
Disclaimer: This is NOT financial or investment advice. Please conduct your own research (DYOR). Phemex is not responsible, directly or indirectly, for any damage or loss incurred or claimed to be caused by or in association with the use of or reliance on any content, goods, or services mentioned in this article.
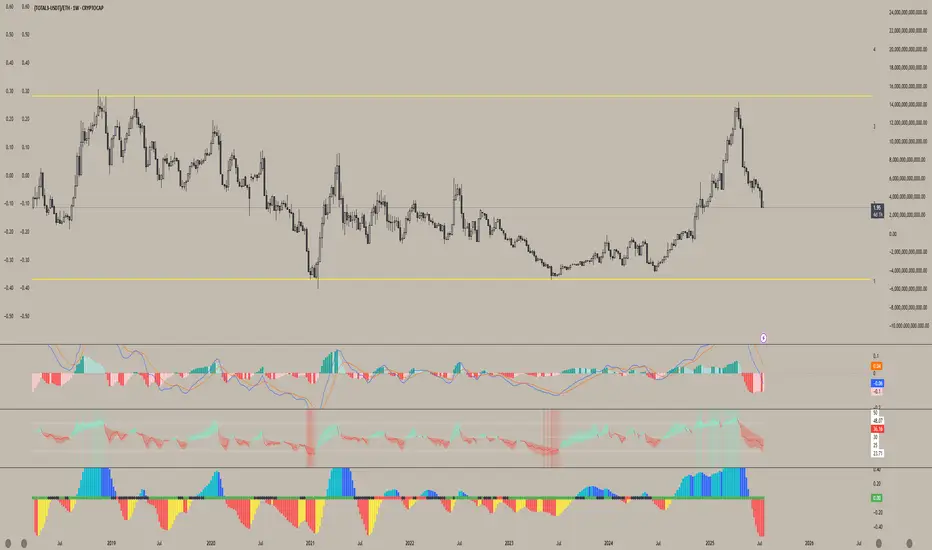
Altcoins are getting absolutely decimated relative to ETHWhile Ethereum has been on a massive run from its lows this year — pulling altcoins up with it — most alts are still lagging far behind.
This chart clearly shows how poorly altcoins are performing against ETH, reinforcing why, at least for now, ETH remains the better hold.
It also fits the classic money flow rotation: BTC → ETH → Large Caps → Small Caps — and right now, we're still in the ETH phase. Until we see strength return in these ETH pairs, chasing altcoins may just lead to more underperformance.
XRP/USD H1 Educational Market Analysis – Support-Based XRP/USD H1 Educational Market Analysis – Support-Based Long Opportunity
🔍 Structure Overview:
• Support Zone: $3.21 – $3.23
This level has acted as a strong liquidity pool and base for past bullish moves. Price has tapped into it, showing signs of potential demand returning.
• Resistance Zone: $3.65 – $3.70
Acts as a key supply zone, where previous bullish attempts failed. Targeting this area after a rebound is technically sound if structure confirms.
⸻
🔄 Price Action Insights (H1):
• Price broke down through EMAs (20/50/100/200), confirming short-term bearish pressure.
• A rejection wick from support hints at possible absorption of selling pressure.
• If price forms a higher low structure above $3.25 and reclaims EMAs, a potential bullish reversal may unfold.
⸻
🧠 Educational Note:
• H1 charts are ideal for intraday strategies, and this structure provides a clear example of:
• Support-resistance dynamics
• The use of EMAs as trend confirmation tools
• Reversal vs. continuation setups
⸻
🎯 Intraday Bullish Scenario:
• If price holds above $3.21 and breaks above the $3.40 (EMA cluster), bulls may push toward the $3.55290 target.
• This level aligns with the mid-range of the resistance zone, offering scalp-to-swing potential.
⸻
🚫 Bearish Risk:
• Failure to hold $3.21 could lead to a deeper correction toward $3.10 or even $3.00.
• Confirmation of bearish continuation would be a lower high rejection from EMAs without reclaiming them.
⸻
📌 Summary:
On the H1 chart, XRP is at a critical support. Watch for a clean bounce and break above EMAs for a move toward $3.55. However, losing $3.21 could attract further downside. Use price action confirmation before entries.

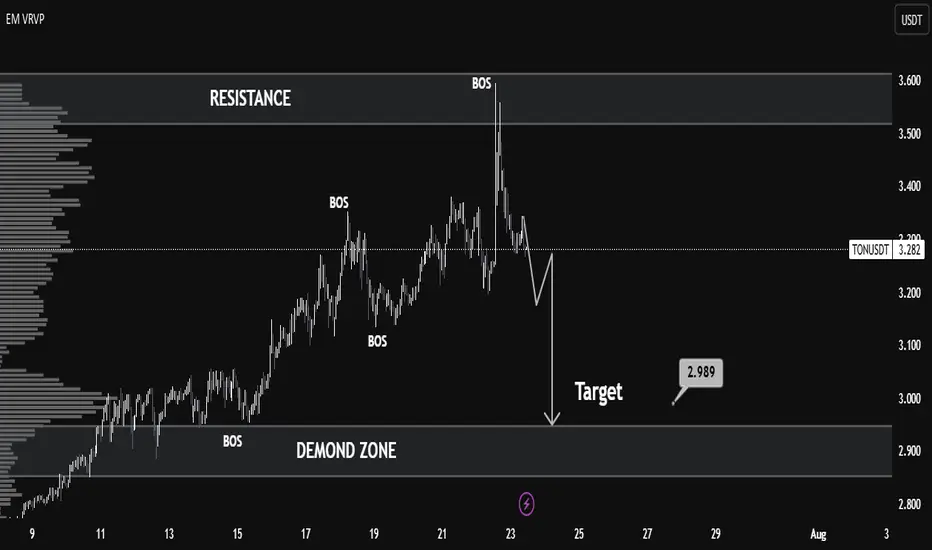
TONUSDT Technical Analysis – Bearish Shift with Clean TargetMarket Context:
TONUSDT recently showed strong bullish momentum, breaking multiple structure levels (noted as BOS – Break of Structure), indicating a clear uptrend. However, the most recent price action reveals a sharp rejection from the resistance zone around 3.55–3.60, marking a significant trend reversal.
Key Levels:
Resistance: 3.55 – 3.60
Price tested this zone and was strongly rejected, forming a potential top.
Demand Zone: 2.88 – 2.99
This zone provided previous accumulation and serves as a probable liquidity area and downside target.
Target: 2.989
The chart marks this as the near-term bearish objective, aligning with the volume node and prior demand.
Technical Signals:
Multiple BOS (Break of Structure):
Confirmed bullish structure earlier, but the latest BOS downward indicates a possible trend reversal.
Volume Profile (VRVP):
Shows high volume nodes around 3.00, suggesting strong market interest at lower levels — acting as a magnet for price.
Bearish Market Structure:
After the peak, the lower highs and lower lows pattern reflects short-term bearish dominance.
Liquidity Grab & Selloff:
The spike above resistance likely induced liquidity before a rapid selloff — classic distribution behavior.
Outlook:
If the market fails to reclaim levels above 3.35, a bearish continuation toward 2.989 remains likely.
The demand zone (2.88–2.99) is a critical area where buyers may re-enter — look for reversal signals here.
Conclusion:
TONUSDT has shifted from bullish to bearish in the short term. A clean rejection from resistance and strong structural breaks suggest a move toward the 2.989 demand zone. Traders should watch for confirmation of support or continuation upon reaching this level.
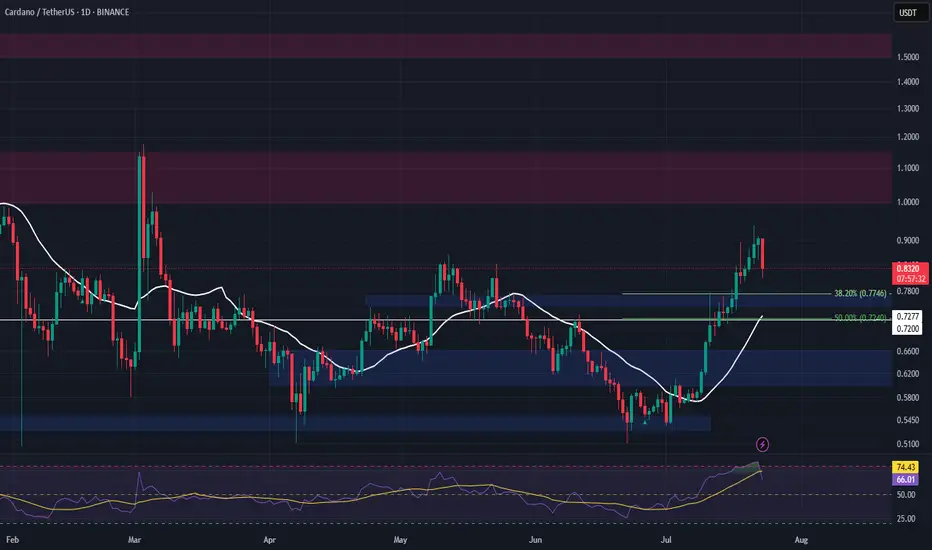
ADA Spot Entry – Pullback Opportunity AheadADA has reached a major resistance zone, and with the broader market appearing overbought, a healthy pullback looks likely. We’re watching for a dip into the next key support area to accumulate for spot holdings.
📌 Trade Setup:
• Entry Zone: $0.75 – $0.77
• Take Profit Targets:
o 🥇 $1.00 – $1.15
o 🥈 $1.50 – $1.60
• Stop Loss: Just below $0.72
ETH - Altseason ??ETH has rallied sharply and is now entering the major resistance zone between $3,725 and $4,081, which has repeatedly acted as a local top during previous cycles.
This red zone represents a high-supply area, and historically ETH has struggled to break and hold above it without a significant catalyst.
Rejection here could lead to a pullback toward the $2,300–$2,000 range.
A clean breakout and weekly close above $4,081 would flip this resistance into support and open the path toward the all-time high (ATH) at $4,868.
If ETH reclaims this red zone and flips it to support, it will act as a major trigger for a broad Altseason.
Historically, such ETH strength is a key confirmation that capital is rotating from BTC into the altcoin market.
Currently, momentum is favoring bulls unless this red supply zone causes a strong rejection.

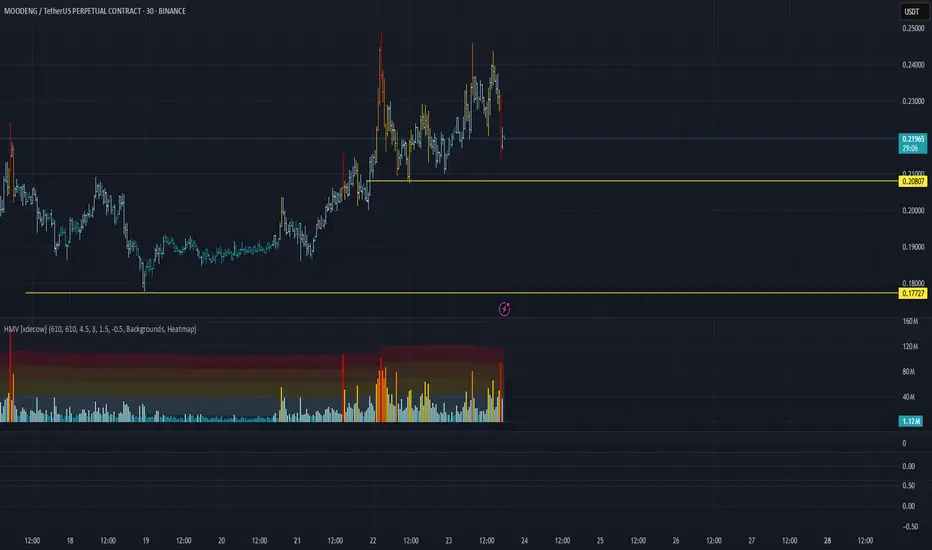
MOODENG/USDT Analysis: Looking for Long Opportunities
At the moment, we’ve been in an accumulation phase since yesterday. Within the current range, we’ve observed strong absorption of market selling based on cumulative delta (delta is falling while price remains stable). Additionally, earlier activity from a large player was noted near the lower boundary.
The safest long entry appears to be a false breakout below the $0.208 level.
This publication is not financial advice.
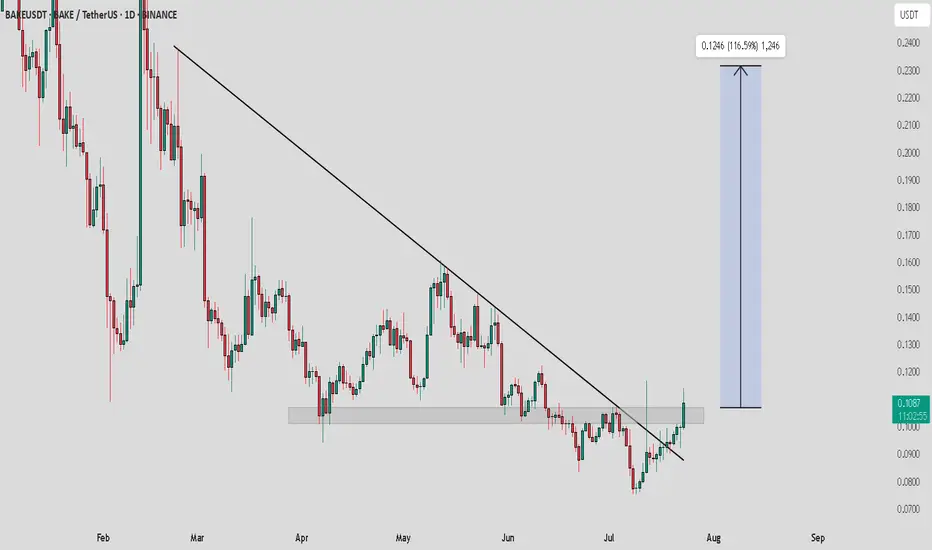
BAKE / USDT : Breakout PotentialBAKE/USDT - Breakout Potential
BAKE/USDT has recently broken above a key resistance zone and is attempting a trend reversal. With the trendline resistance already broken, we are expecting a bullish move towards the $0.124 target, which represents a potential gain of 116.5% from the current price.
Bullish Scenario:
Breakout above the resistance zone confirms the trend reversal, targeting $0.124 with a +116.5% upside.
Pro Tip:
Look for strong volume confirmation during the breakout. Set stop losses just below the breakout level for risk management.
TradeCityPro | Bitcoin Daily Analysis #135👋 Welcome to TradeCity Pro!
Let’s move on to the analysis of Bitcoin and major crypto indices. In this analysis, as usual, I’m going to review the futures triggers for the New York session.
⏳ 1-Hour Timeframe
Yesterday, Bitcoin broke the 119,395 level but couldn’t hold above it and has now returned below this level, currently sitting on its previous trendline.
✔️ Today, the market will probably try to form more structure, and I think Bitcoin will range.
⭐ However, if it wants to move, we can enter a long position with the trigger at 120,594.
🔽 For a short position, we can enter if the 116,000 support area breaks.
👑 BTC.D Analysis
Let’s move on to Bitcoin Dominance. Yesterday, dominance had a bullish move, and finally, a support floor managed to prevent further drop in dominance.
🧩 A retracement to 61.20 has occurred. If this retracement continues, the upper levels are 61.53 and 62.
A break of 60.46 will start the next bearish leg.
📅 Total2 Analysis
Let’s go to Total2. This index has formed a range box between 1.48 and 1.55 and is still oscillating within it.
🎲 If 1.55 breaks, we can open a long position, and on the other hand, if 1.48 breaks, the price could correct to lower support levels.
📅 USDT.D Analysis
Let’s move on to Tether Dominance. This index also has a range box and is still moving inside it.
🔑 Breaking 4.13 is very important for the future market trend and could lead to a drop in dominance.

BERT Approaching Green Support Zone 🚨 BERT Approaching Green Support Zone 🟢📉
BERT is now approaching a key support level in green.
This area has shown buyer interest in the past, and the price could potentially bounce from this zone.
📌 Wait for confirmation before entering long.
If confirmed, it could offer a strong risk/reward opportunity.

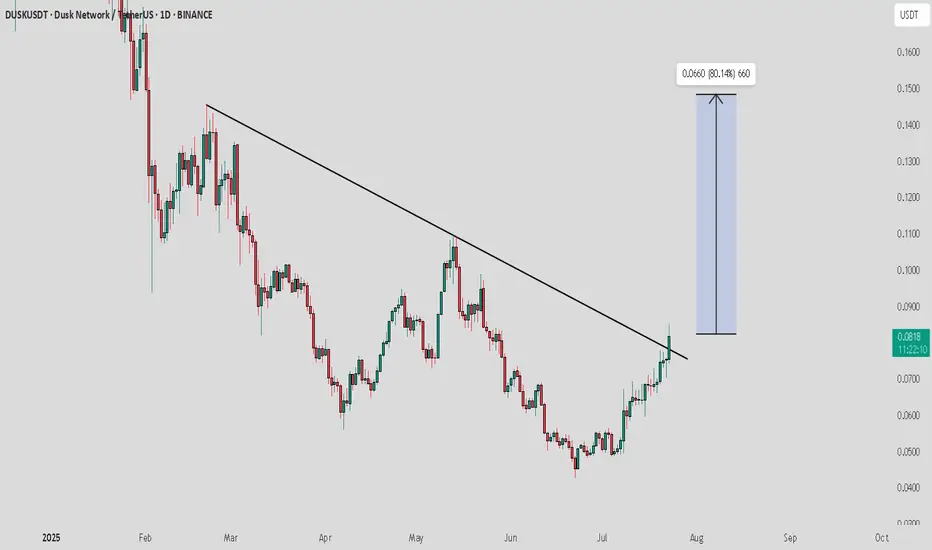
DUSK / USDT : Trend reversal in progressDUSK/USDT - Trend Reversal in Progress
DUSK/USDT has recently broken above a significant downtrend resistance line, signaling a potential trend reversal. With a successful breakout, we’re expecting a strong move towards the $0.0660 target, representing an 80% potential upside from the current price.
Bullish Scenario:
Break above the downtrend resistance confirmed, setting the stage for a significant move toward $0.0660.
A sustained uptrend could lead to further gains in the medium term.
Pro Tip:
Watch for confirmation with increased volume during the breakout. Manage risk by setting stop losses below the breakout level.
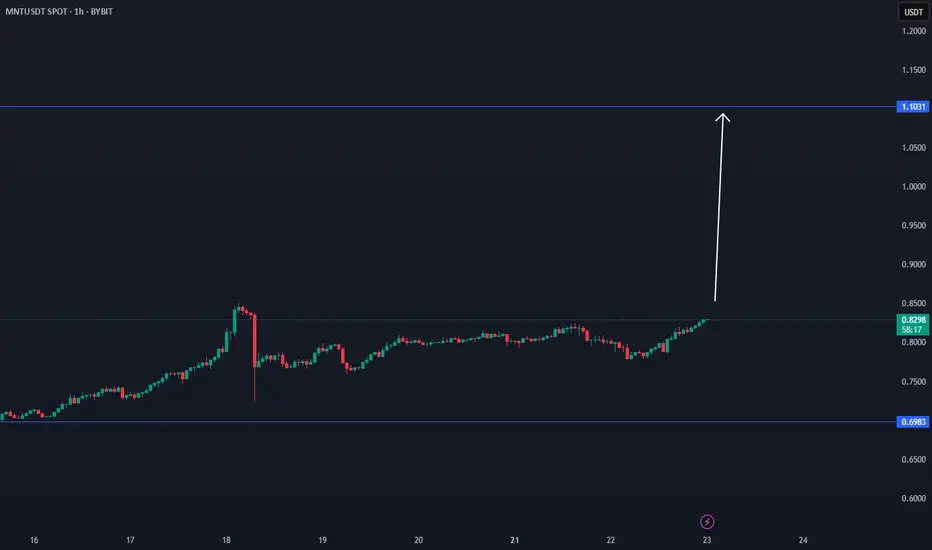
MNT TIME FRAME BREAKMNT has a good chance to break in the coming hours, depending last data.
$1.10 is an important target. 32% increase possibility.
Coin has acctive volume.
BTC correction august/septemberBTC has reached overbought territory, there is also bearisch divergence. It also didnt go above 123k anymore. i expect a correction in august/september.
dont chase FOMO, be prepared. Nothing goes in a straight line. there are always corrections.
CRYPTO:BTCUSD BINANCE:BTCUSD CME:BTC1! BINANCE:BTCUSDU2025

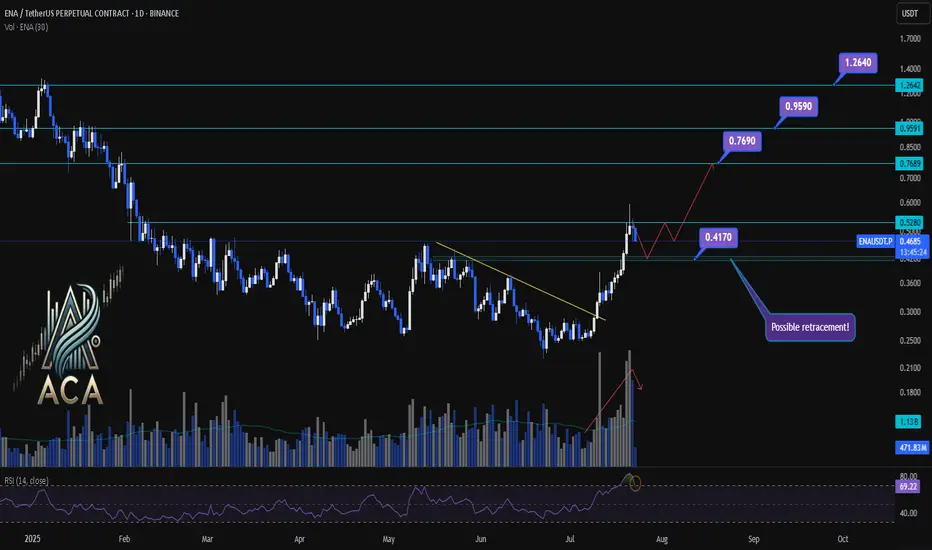
ENA/USDT Chart Analysis | Volatility Signals & Bullish TriggersENA/USDT Chart Analysis | Volatility Signals & Bullish Triggers
🔍 Let’s dive into the ENA/USDT perpetual contract and analyze recent price action, focusing on momentum shifts and key breakout scenarios.
⏳ Daily Overview
The daily chart shows that ENA recently reentered the overbought zone on the RSI, which can serve as a potential trigger for traders watching momentum shifts. Earlier, price action broke decisively above a long-standing descending trendline, resulting in a rapid, nearly 100% surge, a classic RR2 move off the trendline. This breakout coincided with a visible uptick in trading volume, confirming strong demand behind the move.
Now, during the ensuing rest or correction phase, trading volume is decreasing—often a constructive sign suggesting either profit-taking or a healthy pullback rather than panic selling.
🔺 Bullish Trigger & Setup:
- RSI Signal: Reentry into the RSI overbought zone is a potential long trigger, especially if confirmed by price action.
- Confirmation Level: A daily close with strong volume above $0.528 would add conviction to a bullish setup.
- Trendline Reference: The break above the recent trendline fueled the rapid advance, showing the importance of watching such key resistance levels.
📊 Key Targets (on further bullish confirmation):
- $0.769 — First upside resistance.
- $0.959 — Next bullish target.
- $1.264 — Extension target if momentum continues and broader market sentiment remains supportive.
🚨 Conclusion:
Eyes are on the $0.528 level—closing above it with volume, especially while RSI holds in the overbought zone, could provide the next strong entry signal. Current declining volume during pullbacks suggests this is likely a profit-taking phase or standard correction, not bearish capitulation. Keep monitoring RSI, volume profile, and price closes for the next actionable opportunity.
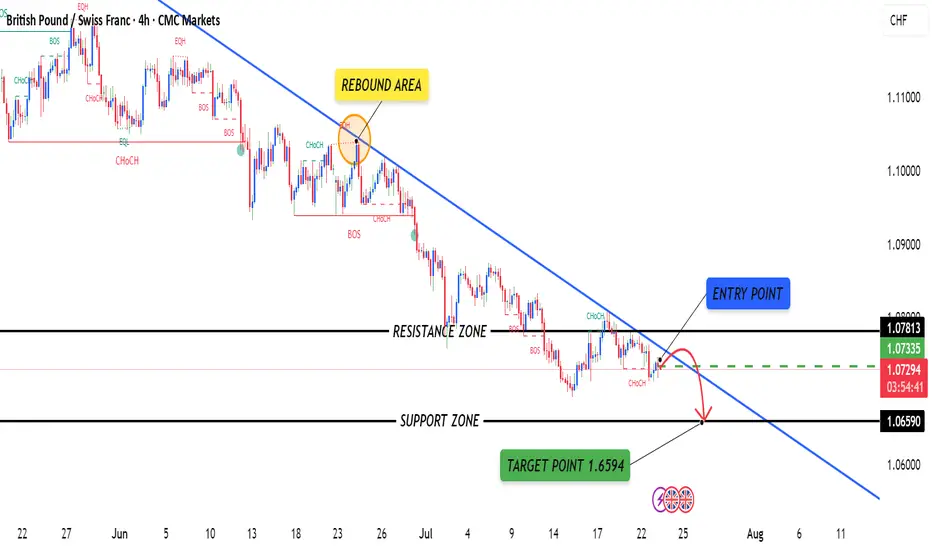
GBPCHFGBPCHF is currently in a downtrend, confirmed by a series of lower highs and lower lows.
The pair has recently formed a bearish engulfing candle below the minor resistance zone near 1.07400, signaling renewed bearish pressure.
Price rejection from the 50 EMA suggests sellers are still in control.
RSI is trending downward, staying below 50, indicating bearish momentum without being oversold.
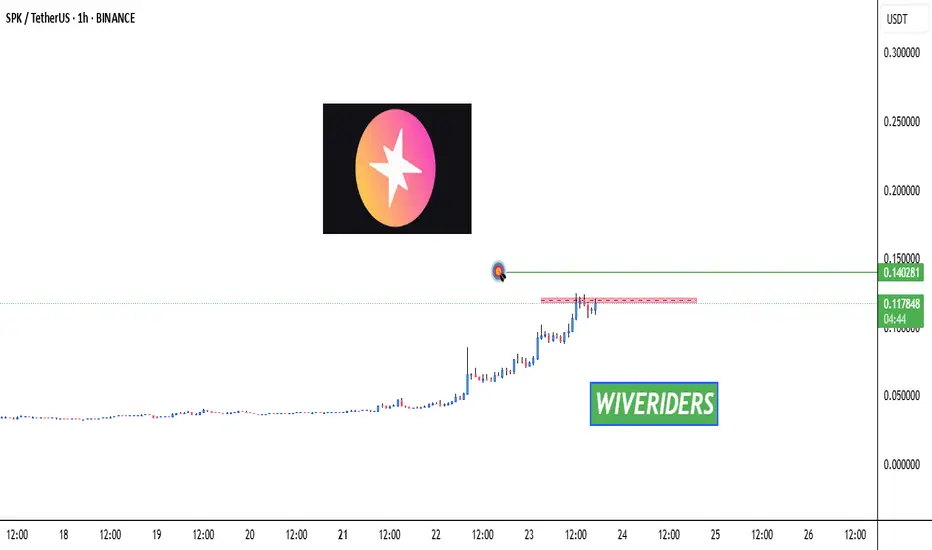
SPK Testing Red Resistance Zone 🚨 INDEX:SPK Testing Red Resistance Zone 🔴📈
INDEX:SPK is now testing the red resistance zone.
📊 Watch for breakout confirmation — if successful:
🎯 First Target → Green line level
This could signal the beginning of a new move up if buyers push through the resistance.
Let’s track it closely for a potential entry! 💼📈
GBPJPY 4HOUR TIME FRAME ANALYISOn the 4-hour chart, GBP/JPY has been tracing out a clear up-trend over the past several weeks, marked by a sequence of higher highs and higher lows. Your proposed long entry at 198.632 neatly coincides with two layers of support:
Trendline support: A rising trendline drawn off the last two significant swing lows intercepts right around 198.6, suggesting the pair is catching a bid as it back-tests that line.
