TradeCityPro | AAVE Holds Gains as Altseason Optimism Builds👋 Welcome to TradeCity Pro!
In this analysis, I’m going to review the AAVE coin for you. It’s one of the major DeFi coins active in the lending sector and currently ranks number 1 in terms of TVL.
✔️ The token itself has a market cap of $4.58 billion and is ranked 29 on CoinMarketCap.
📅 Daily Timeframe
On the daily timeframe, since our last analysis, the price has increased by over 100%, and the trigger for long or buy positions was activated.
🔄 There was a descending trendline on this coin, and the trigger for its breakout was 148.17. After breaking that level, we could open a long position.
🚀 However, the main trigger was 194.97, and the primary uptrend started with the break of that level, continuing up to a high of 328.9.
📊 The issue with this current uptrend is that, as you can see in the second leg, there is clear weakness, which is not a good sign for the continuation of this trend.
📈 The current top at 328.9 is not far from the previous high, forming a double top-like structure, leading to a strong bearish divergence in the RSI.
💥 If RSI confirms a breakdown below 50, this divergence will become active and a correction toward 222.10 may occur. A break of that level would be the first signal of a potential trend reversal for AAVE.
⭐ On the other hand, if price wants to continue upward, we have a very important resistance at 383.59.
🔍 Breaking this resistance would initiate an uptrend in higher cycles and could even lead to a new ATH for this coin.
💼 I plan to open a long position if the 328.9 resistance is broken, and for spot purchases, I will wait for a breakout of 383.59.As long as the price remains above 279.45, I am not considering any short positions.
📝 Final Thoughts
This analysis reflects our opinions and is not financial advice.
Share your thoughts in the comments, and don’t forget to share this analysis with your friends! ❤️
Cryptomarket

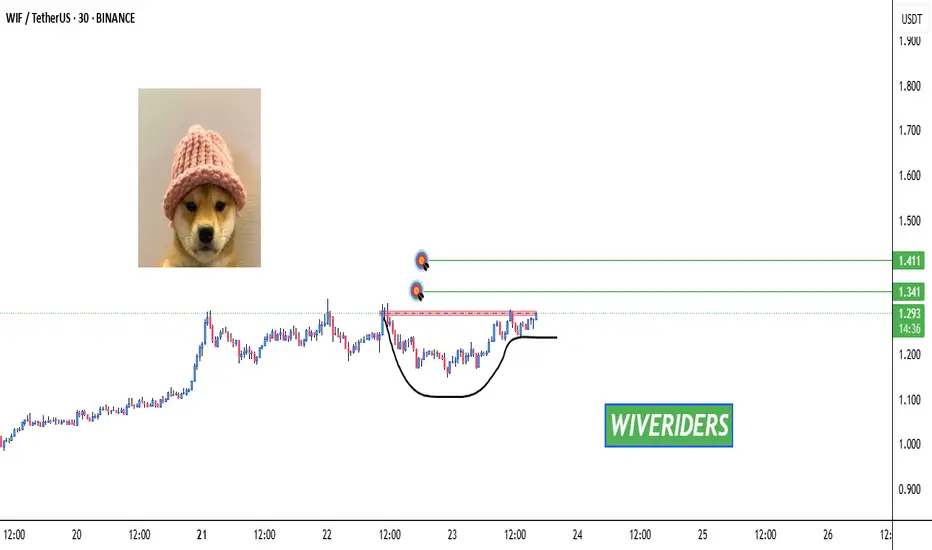
Bullish Cup & Handle Pattern Formed 🚨 SEED_WANDERIN_JIMZIP900:WIF Testing Red Resistance – Bullish Cup & Handle Pattern Formed 📈
SEED_WANDERIN_JIMZIP900:WIF is currently testing the red resistance zone and has formed a bullish cup and handle pattern on the chart.
If a breakout occurs, potential upside toward:
✅ First Target: Green line level
✅ Second Target: Green line level
Wait for breakout confirmation before entering long. 📊
Patience is key—watch this closely! 💼💸
$CUSDT Breakout Targeting $0.47BITGET:CUSDT just broke out of and is now retesting the $0.34–$0.35 resistance zone.
If this level holds, we could see a strong move toward $0.47, nearly a 47% upside.
Momentum looks solid, but confirmation will come with a clean bounce.
DYOR, NFA

When Altseason? Clues in other chart Ex) #1Hi guys.
So Its no secret bitcoin has been ripping.
We are at new all time highs, and in full on price discovery mode.
I recently posted an ongoing macro analysis on ADA (Cardano) supporting my theory that it is one of the better alts to be investing in for alt explosion.
I want to look elsewhere to see if i can find supporting evidence that its time to invest or trade altcoins.
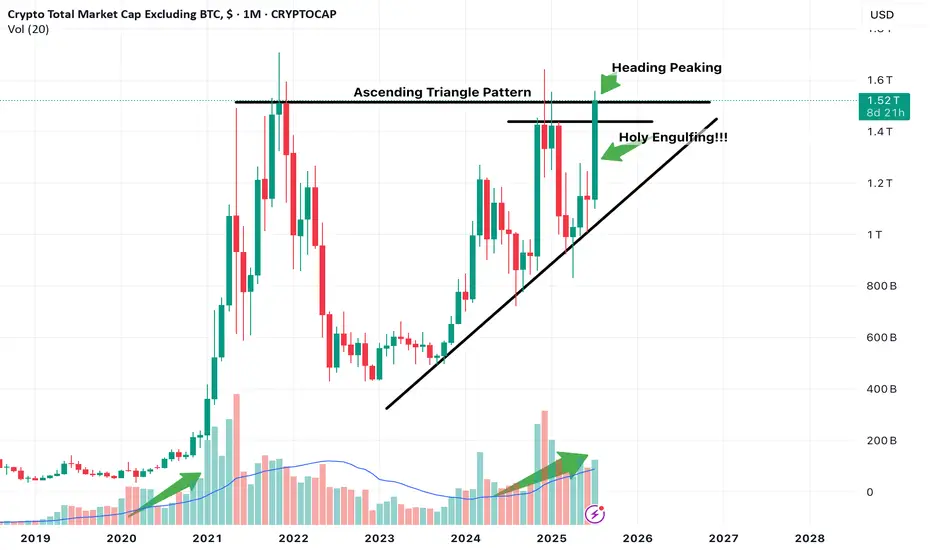
One chart that can be used is the Total Market Cap of Crypto excluding Bitcoin.
This chart showcases total altcoin market capitalization and its movements.
I believe certain Technical developments can really help us gauge at whats to come.
NOte this is on the 1 Month timeframe aka looking into Macro developments.
Just focusing on Candlestick action.
Notice we have been in this ascending channel trend, along with a potential Ascending triangle pattern development which if breakout occurs with confirmation can push Altcoin market cap higher indicating that liquidity is entering altcoins which indicates potential Uptrend.
The month of July so far is in position to print a massive engulfing Bullish candle, which is a great sign.
The upper part is also peaking its head above the Horizontal resistance line. Need to observe confirmation of this breakout. Look for it in smaller timeframes, ill look for it in the 3 day or 5 day.
We are also in position to print a higher high first time in a while.
Notice also Volume. We are seeing currently similar increasing volume as previous alt coin market cap expansion.
Keep an eye out on more posts to add to evidence that supports we are in the verge of potential altcoin season.
Eclipse Wakes Up After Bleed – Bounce Incoming?ES/USDT just broke above the short-term downtrend line after a long bleed.
Volume is still low, but this could be the first sign of a shift.
As long as it holds above $0.2188, there’s a good chance of a relief bounce toward $0.33.
Early, risky, but worth watching closely.
DYOR

Cardano (ADA) a solid play in crypto, a Macro lookHi guys, so with Bitcoin in price discovery mode. It hints at the final phase of Crypto bull in action. With that comes altseason and in my opinion explosive growth in altcoins.
1 particular coin i've been looking at is Cardano (ADA).
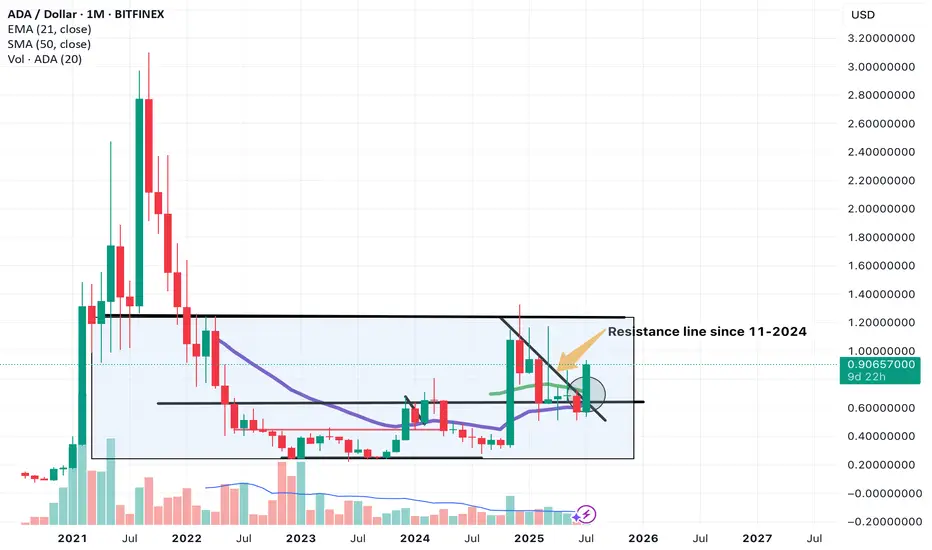
This is a macro technical analysis of ADA on the 1 month timeframe. So each candle is 1 month of price action. This is very powerful on its own. And can give signs into where an asset will trend.
If you compare this to majority of other alts, its looking alot more bullish and is ahead of the game.
SO jumping right in.
Lets look at price action. Notice we are in a macro rectangle or sideways pattern.
Upper limit at $1.24
Lower limit at around $0.25.
This indicates a consolidation phase.
Real action is seen above that upper limit. Where we see explosive price action to the upside. Previously in Sept 2021 seeing highs of up to $3.07.
I believe we are making our way up to this $1.24 level.
Which in the short term will be a solid area to take profit due to it being a major supply zone in my opinion or sell zone. With a potential pull back. This is because if you look previously in price history, cardano price movement heavily involves this level with most of price history being either above or below $1.24.
A key sign but not yet confirmation is a breakout above this slanted resistance line we were being pushed down from that was created in 11-2024.
We have an engulfing candle break out currently. But still awaiting confirmation which will require august monthly candle to stay above this line and present a bullish candle print.
We will be on the look out for this.
There are other signs and signals appearing in Cardano (ADA) that support my theory and Price action developments. To take trades i always look for multiple signs that overlap.
Stay tune for more of that where ill go over many different indicators and other aspects that point to ADA being above other alts as a solid trade or investment for the next altseason.
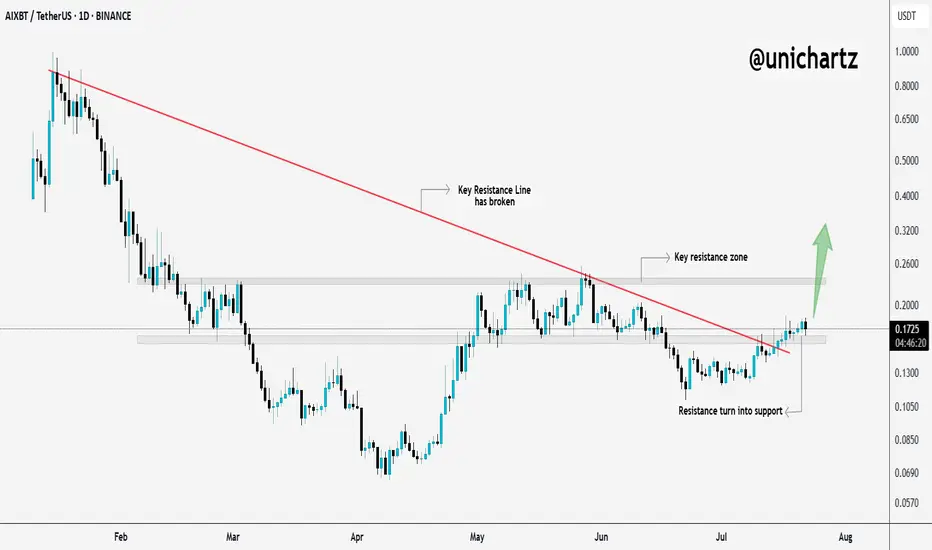
$AIXBT Breaks Trendline – Sharp Move Ahead?$AIXBT just broke out of its downtrend and flipped resistance into support, classic breakout behavior.
It’s now pushing toward a key resistance zone, and if it clears that level, we could see a sharp move up.
Momentum is shifting, this chart deserves your attention.
DYOR, NFA
gold vs ethIf we follow this fractal, we should top around $4k and then a pullback to $3k followed by news highs in Q4

NEAR Swing Long Idea - Altseason 2025📌 Fundamental Sentiment:
The entire crypto market is rallying, alongside other risk assets. This is mainly driven by U.S. policy expectations — Trump is pressuring Powell to resign and aggressively pushing for rate cuts from the Federal Reserve.
📌 Technical Analysis:
NEAR has recently broken and closed above a significant HTF support/resistance level.
Additionally, we’re now trading inside the 0.75 Fibonacci retracement level of the HTF bullish trend — which I define as the maximum discounted zone.
For this setup, I’ll apply my Deep Range Theory (DRT):
If price dips below the 0.75 zone and accumulates there,
Then breaks above 0.75 after a period of consolidation,
→ It signals that price aims for the 0.5 level of the range and will likely run HTF liquidity for either reversal or re-accumulation before continuation.
📌 Gameplan:
✅ Break and close above HTF S/R
⏳ Waiting for break and daily close above 0.75
🔄 Retest to LTF demand (4H–1H)
📈 A bounce on LTF demand will trigger the long setup
📌 Trade Management:
This is a mid-term swing trade, as I’m following the HTF bullish trend.
🎯 Target: $5 — which is approximately a +70% move from current price.
❗Risk Management:
If price makes a daily close back below 0.75 after breaking and closing above, I will exit the trade to preserve capital.
I’ll also monitor macro sentiment closely. If there's a sharp bearish shift, I may consider an early exit before reaching the HTF target.
—
🔔 Follow the channel for daily trade ideas & weekly macro recaps.
💬 Drop a comment below if you have any questions or insights!

THETA Long Swing Setup – Accumulation Phase Near BreakoutTHETA is still consolidating in a range, but momentum is quietly building. A break above $1.07 followed by a higher low would confirm structural reversal. We’re eyeing the $0.95–$1.00 zone for a clean entry on retest, offering solid risk-reward if support holds.
📌 Trade Setup:
• Entry Zone: $0.95 – $1.00
• Take Profit Targets:
o 🥇 $1.60 – $1.70
o 🥈 $2.10 – $2.20
• Stop Loss: Daily close below $0.90

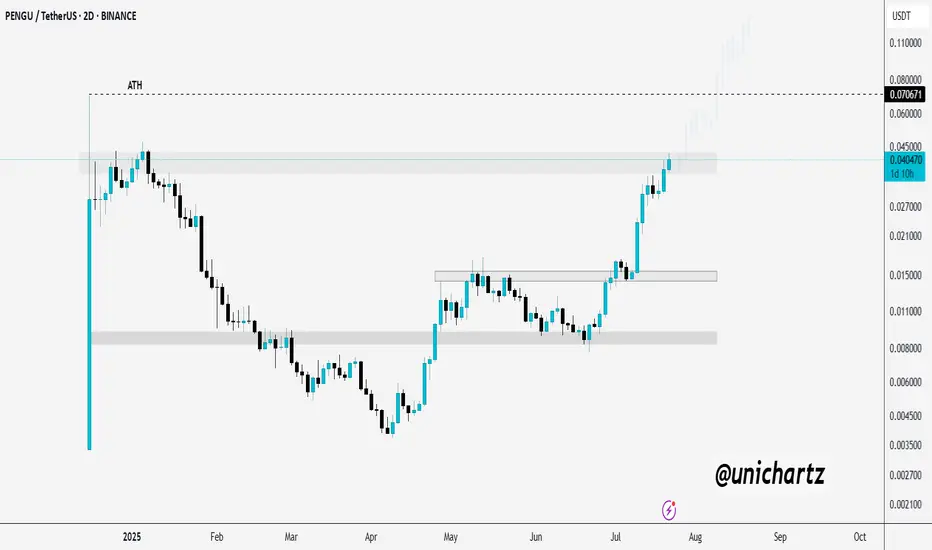
PENGU Approaching Key Breakout Zone – Eyes on ATHCSECY:PENGU is testing a major resistance zone — and it’s heating up! 🔥
If it manages to break and close above this level, we could see a strong rally toward the ATH and beyond.
Keep it on your radar, this move could get explosive.
DYOR, NFA
What to expect in the crypto market until 2026 ?!📈 Today, we will look at the graph of the total capitalization of the cryptocurrency market, as well as the implementation of our ideas from 2022 to 2025.
At that time, the cryptocurrency market was in a total depression, there was no talk of BlackRock or MicroStrategy buying cryptocurrencies, and we stubbornly wrote that this was the bottom... and then a miracle happened)
During this time, the total capitalization of the crypto market grew 5 times from $800 million to $4 billion.
ℹ️ You can find all posts in the channel by searching by date:
1️⃣ 18.11.22 - “How much can the crypto market capitalization grow by the end of 2025?”
The growth momentum is slowing down, but the following ideas give hope.
2️⃣ December 30, 2022 - “Plans for 2023-25”
If we are to believe this fractal, which has been working for over 2.5 years, then all the most interesting things are still ahead.
3️⃣ 29.02.2024 - “What to expect from the crypto market in 2024-26”
At the beginning of 2024, the previously published fractal was slightly adjusted to the market situation.
4️⃣ 04.03.2025 - “The total capitalization of the crypto market is on the verge of a foul.”
Then, despite the market depression and a lot of negative news, the total capitalization still managed to stay above the blue trend line.
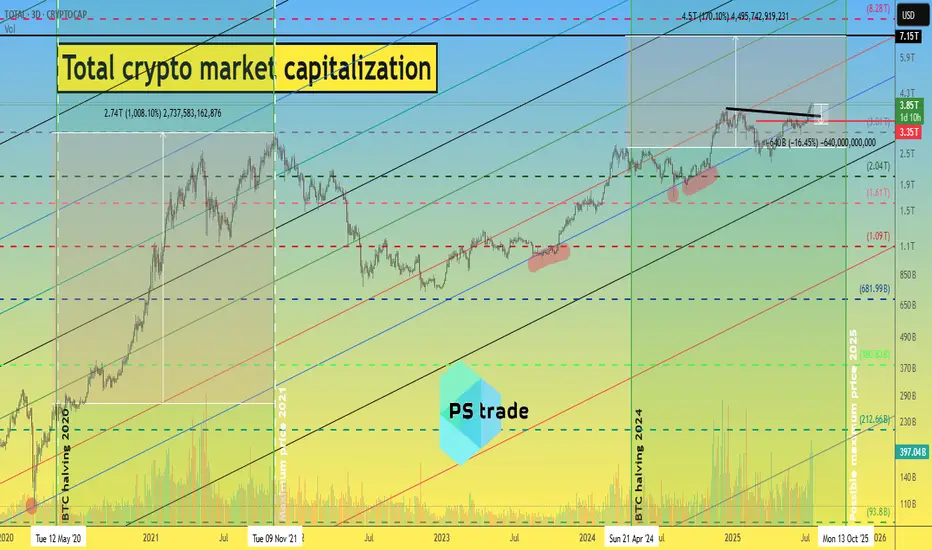
📊 Cryptocurrency market capitalization as of 22.07.25:
◆ Bitcoin - $2.36 trillion
◆ Ethereum - $442 million
◆ Ripple - $206 billion
◆ SOL and BNB - $110 billion each
◆ USDT and USDC - $162 billion and $65 billion, respectively.
In total, this is $3.45 trillion out of $3.89 trillion of the total crypto market capitalization.
♎️ Too much capital is concentrated in the top 7 projects; we need a process of capital flow and the launch of exponential growth. Especially since all of the above fractals “suggest” that the time has come and anything is possible.
🔃 The total capitalization of the crypto market must continue to remain above the blue trend line, i.e., it cannot be adjusted by more than -13-16% to $3.25-3.35 trillion.
Roughly speaking, the price of CRYPTOCAP:BTC cannot be adjusted by more than -10% due to its high dominance at the moment. (Such an adjustment of the #BTCUSDT price fits into the scenario we published a few days ago.)
_____________________
Did you like our analysis? Leave a comment, like, and follow to get more
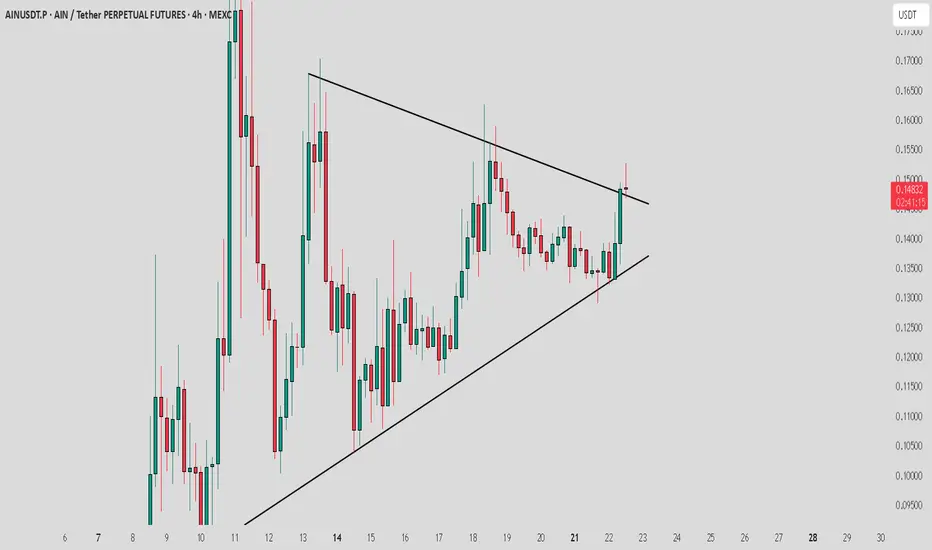
AIN / USDT retesting Trendline..Should enter now ? details belowAIN/USDT broke out from trendline resistance and is now retesting the breakout zone. For a safer entry, wait for a clear bullish candle on the 1H timeframe with strong volume. Without confirmation, there's a high chance the retest could fail.
Pro Tips:
– Always wait for confirmation before entering on retests
– Use tight stop-loss below the breakout zone
– Avoid chasing entries if volume is weak
TradeCityPro | Bitcoin Daily Analysis #134👋 Welcome to TradeCity Pro!
Let’s dive into the Bitcoin analysis and key crypto indices. As usual, in this analysis I will review the New York futures session triggers for you.
⏳ 1-Hour Timeframe
On the 1-hour timeframe, Bitcoin has formed a range box between 116829 and 119395. Yesterday, after getting supported at 116829, it climbed back to the top at 119395.
📊 As you can see, buying volume has increased, which indicates strong buyer momentum.
📈 If 119395 is broken, the price could move toward higher targets like 120594 and 122733.
🧩 This 119395 area is also the breakout trigger of the descending triangle. The bottom at 116829 has supported the price multiple times, and now with the descending trendline being broken, price could aim for higher resistance levels.
👑 BTC.D Analysis
Let’s move on to Bitcoin Dominance. BTC Dominance has been supported at 60.46, which is why Bitcoin is moving upward, while altcoins are dropping.
🎲 The dominance trend is still clearly bearish, and if 60.46 breaks, the next downward leg may begin.
📅 Total2 Analysis
Let’s look at Total2. This index has also formed a range between 1.48 and 1.55, and it is currently sitting at the bottom of the box.
🔔 If we get confirmation of support at 1.48, we can consider entering a long position. The main long trigger would be the break of 1.55.
📅 USDT.D Analysis
This index has also formed a range box. The previous support level was 4.08, which has now shifted to 4.13.
💥 The top of the box is 4.25. Given the bearish momentum in dominance, the probability of 4.13 breaking is higher.
🎲 So keep a close eye on altcoins in the coming days, because a lot of capital is flowing into them and they could see significant pumps.
❌ Disclaimer ❌
Trading futures is highly risky and dangerous. If you're not an expert, these triggers may not be suitable for you. You should first learn risk and capital management. You can also use the educational content from this channel.
Finally, these triggers reflect my personal opinions on price action, and the market may move completely against this analysis. So, do your own research before opening any position.

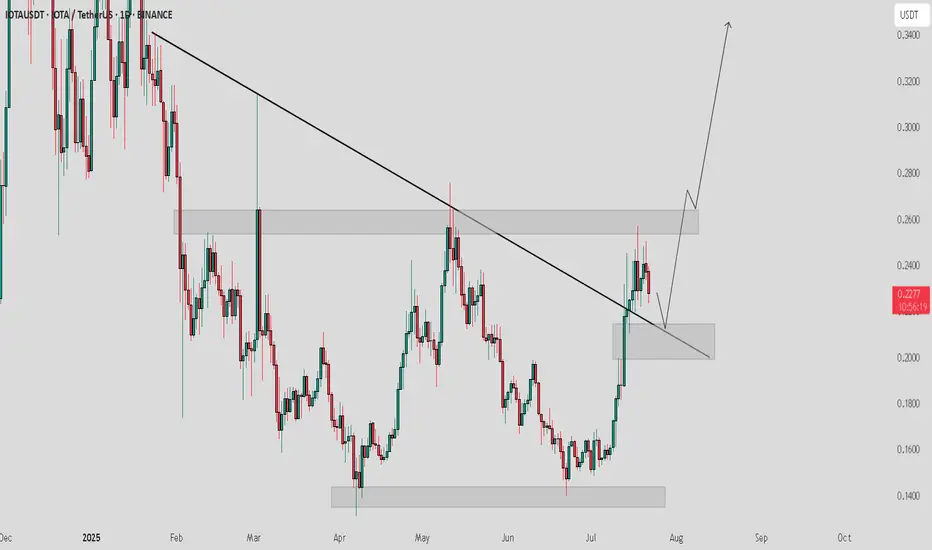
IOTA / USDT looking good to buy at the price of $0.2100IOTA/USDT faced rejection from local horizontal resistance and is now heading for a retest of the lower support zone. If market conditions remain stable, the $0.2100 area looks like a solid buy zone. The structure suggests a healthy pullback before a potential strong bounce.
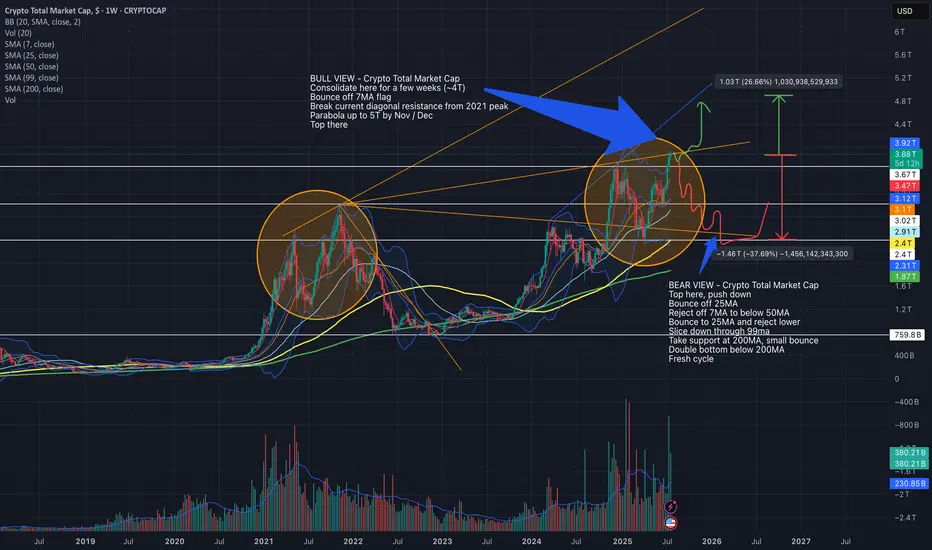
Bull and Bear Cases for Crypto Total Market Cap as of July 2025This chart outlines my views of where Total might go in the next few months - considering both Bull and Bear possibilities.
We are in a similar spot to 2021 peak at the moment, but still not as euphoric so it's a toss up as to which direction Total may move.
Current Total Market Cap - ~4T
Bull Case - Crypto Total Market Cap:
Consolidate here for a few weeks (~4T)
Bounce off 7MA flag
Break current diagonal resistance from 2021 peak
Parabola up to 5T by Nov / Dec
Top there
Bear Case - Crypto Total Market Cap:
Top here, push down
Bounce off 25MA
Reject off 7MA to below 50MA
Bounce to 25MA and reject lower
Slice down through 99ma
Take support at 200MA, small bounce
Double bottom below 200MA
Fresh cycle
These are just ideas. The future doesn't mimic the past but it does move in a mathematically sound manner. TA accuracy in forecasting can be affected by several real-world events, specially considering how volatile the world is at the moment.
BITCOIN current and past FAIR VALUE GAPS -Watch for the future ?An explanation of what a FAIR VALUE GAP ( FVG) is at the end of this post.
The stand out for me here is simply how almost EVERY Fair Value Gap ( FVG) gets filled in every cycle. There are very few FVG from the 2017 to 2021 ctcle and only one from 2013 to 2017.
The question I now pose to myself is what will happen this time ? Because things are very different.
The potential for a return to the 50K area is Very real should we go back into a BEAR.
But to enter a Bear, we need the corporations to sell up..
Will they ?
We have to wait and see
Fair Value Gap
A fair value gap (FVG) is a price range on a chart where an imbalance exists between buyers and sellers, often resulting from sudden and strong price movements that leave a void where little or no trading took place.
These gaps occur when there is a significant difference between buy and sell orders, indicating an imbalance that can influence market prices.
Traders use FVGs to identify market imbalances and inefficiencies, which can present potential trading opportunities.
Definition: A fair value gap is a price range on a chart where an imbalance exists between buyers and sellers, often resulting from sudden and strong price movements that leave a void where little or no trading took place.
Formation: FVGs occur when buying or selling pressure leads to significant price movements, leaving behind gaps on price charts. These gaps can be identified through technical analysis involving the analysis of candlestick patterns and price chart patterns.
Types: Traders can categorize FVGs into two types: Undervalued FVGs, where prices are lower than fair value, and Overrated FVGs, where prices are higher.
Identification: FVGs are typically identified through a three-candle pattern on a price chart. The first and third candles serve as barriers, while the middle candle is the largest, creating a gap between the wicks of the first and third candles.
Trading Strategy: The fair value gap trading strategy involves identifying price gaps, waiting for the price to return to the gap, and executing trades based on the expectation that the price will resume its original trend. This approach requires a disciplined risk management plan.

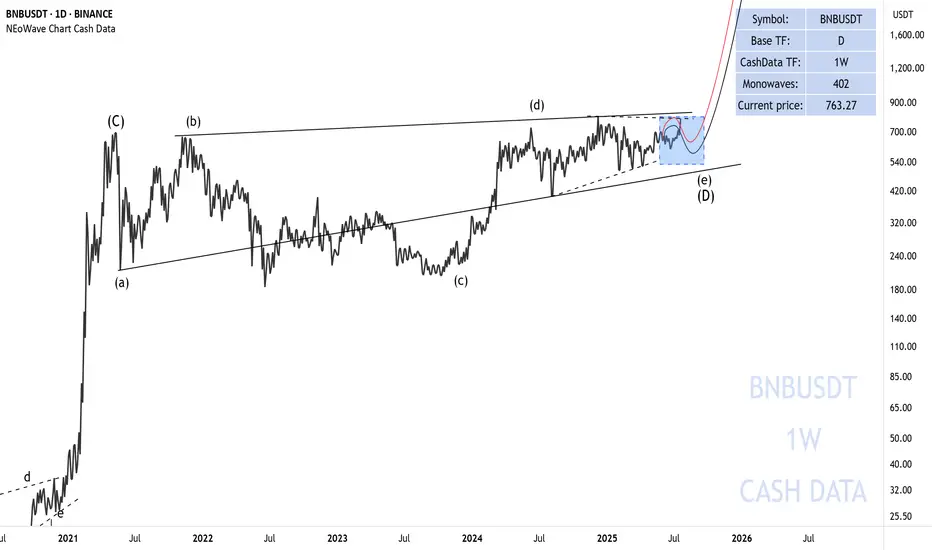
BNB is getting ready to riseThe first bullish move I was expecting for BNB has taken place and it looks like we should be waiting for the formation of wave-e of (e).
After the completion of wave-(e), we expect a big rise for BNB.
Good luck
NEoWave Chart
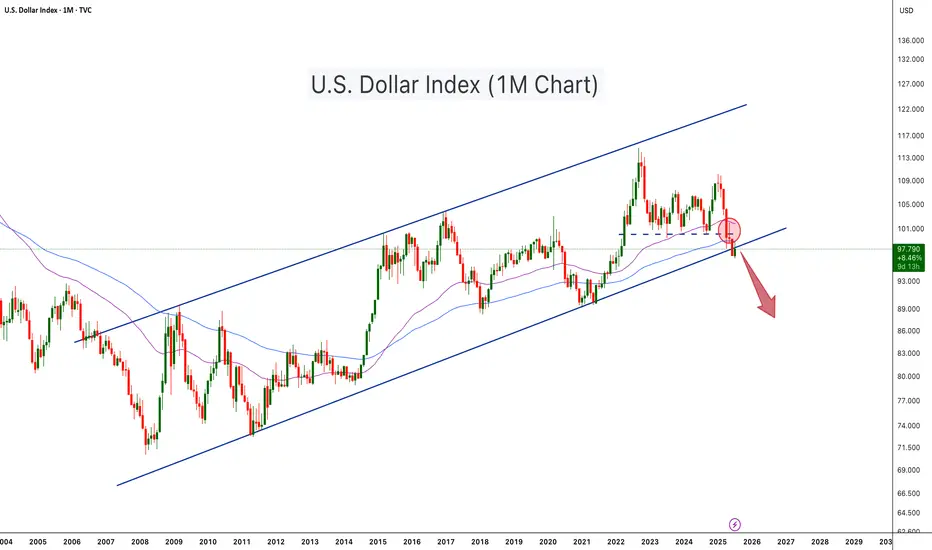
U.S. Dollar Index Loses Key Support – Crypto Bull Run Loading?The U.S. Dollar Index (DXY) has just broken below a long-term ascending channel, which has held since 2008. After losing the key horizontal support (~100 level), DXY retested and rejected from it (red circle), confirming a potential trend reversal. The move is technically significant and hints at further downside, possibly toward the 88–90 zone or lower.
This breakdown aligns with classic macro cycles, where a weaker dollar often fuels bullish momentum in risk assets, especially crypto. Historically:
-DXY downtrends in 2017 and 2020–2021 coincided with major Bitcoin and altcoin bull runs.
-DXY strength during 2018 and 2022 contributed to crypto bear markets.
With DXY now below both horizontal and diagonal support, Bitcoin and the broader crypto market may be entering the next expansion phase, especially if the dollar continues its downward trajectory
-DXY has broken below a 17 year rising channel – a macro bearish signal.
-Rejection from former support turned resistance confirms breakdown.
-A falling DXY historically corresponds with Bitcoin rallies and altseason expansions.
-Declining dollar strength could be the fuel that propels Bitcoin past $140K and Ethereum above $6K.
-A dollar bear trend may fuel total crypto market cap breakout beyond $4T+.
As DXY weakens, liquidity tends to rotate into risk-on assets like crypto. This setup mirrors pre-bull run environments seen in 2017 and 2020. A structural breakdown in the dollar could act as a catalyst for Bitcoin’s next major leg up.
Cheers
Hexa
$WLD Breakout: 200% Move Ahead?MIL:WLD just broke out of a long-term triangle pattern, which could be the start of a big move.
If it stays above the $1.085 zone, we might see it climb toward $3.30, which is over 200% upside.
A clean retest would make this breakout even stronger.
DYOR, NFA

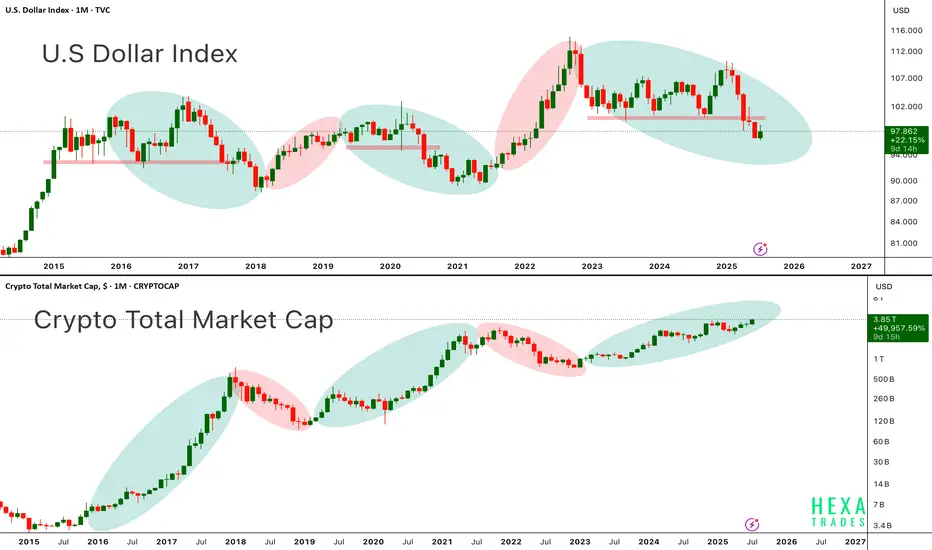
DXY vs. CryptoAbove chart highlights the long standing inverse correlation between the U.S. Dollar Index and the Crypto Total Market Cap a relationship that has guided the macro trend for Bitcoin and altcoins since 2015.
in the first chart, When the dollar weakens (green ovals), crypto tends to rally. When the dollar strengthens (red ovals), crypto markets usually experience corrections or prolonged bear markets.
In the second chart, each period of dollar weakness aligns almost perfectly with explosive crypto upside seen in 2017, 2020–2021, and now potentially again in late 2024 through 2025. Conversely, periods of DXY strength (2018, 2022) coincide with crypto market downturns.
Currently, DXY is entering a downward phase, while the crypto total market cap is pushing higher, now above $3.8 trillion suggesting that a new leg in the crypto bull cycle may be underway. Bitcoin and Ethereum have historically performed best when DXY trends lower, as liquidity shifts into risk-on assets.
Key Points:
-DXY and crypto market cap show a strong inverse macro relationship.
-DXY in a clear downtrend from 2024 highs supportive of further crypto upside.
-Crypto Total Market Cap approaching all-time highs suggesting broad market strength.
-Potential for BTC > $150K and ETH > $6K+ if this macro divergence continues.
-This setup resembles early 2020, right before the massive crypto bull run.
If the dollar continues to weaken structurally, crypto markets led by Bitcoin and Ethereum could see accelerated momentum, pushing into parabolic territory by late 2025.
Cheers
Hexa🧘♀️
Investing in Cryptocurrencies in the current environmentDear Investors,
The cryptocurrency market has experienced significant activity over the past week, with major cryptocurrencies such as Bitcoin and Ethereum reaching all-time highs. However, many alternative coins (altcoins) have yet to follow suit, presenting potential opportunities for strategic investors. This divergence is partly attributed to recent developments in U.S. regulatory efforts, particularly discussions around stablecoin legislation. The signed regulatory framework (Genius act) for stablecoins is viewed as a positive step for the broader crypto industry, as it could foster greater institutional adoption and market stability. Notably, President Trump’s administration has signaled a crypto-friendly stance, which has bolstered market sentiment and contributed to the bullish momentum.
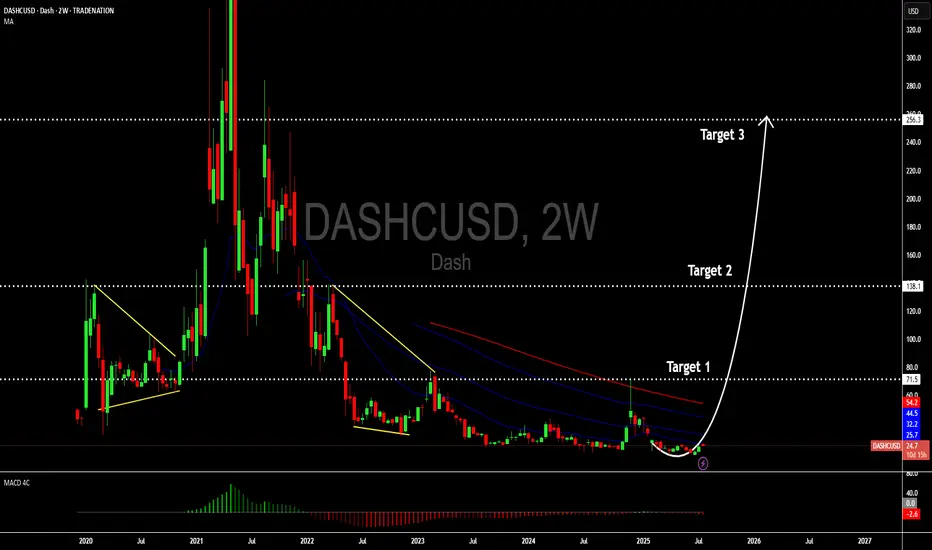
While the surge in top-tier cryptocurrencies is exciting, we caution investors against succumbing to FOMO (Fear of Missing Out) by chasing assets that have already seen significant price increases. Instead, consider reallocating capital toward undervalued altcoins with strong fundamentals, such as Dashcoin, which may offer attractive risk-reward profiles in the current market cycle.
Disclosure: I am part of Trade Nation's Influencer program and receive a monthly fee for using their TradingView charts in my analysis.
Bitcoin Breakout Bonanza - Ride the Wave, BroYo, check this Bitcoin chart, fam! We’re sittin’ at 107,725, and it’s lookin’ like a wild ride. That break above 127,725 is screamin’ bullish—time to ride the blue arrow up! But watch out, a drop below could send us crashin’ to 107,475 with that red arrow vibe. Stay sharp, dude!
