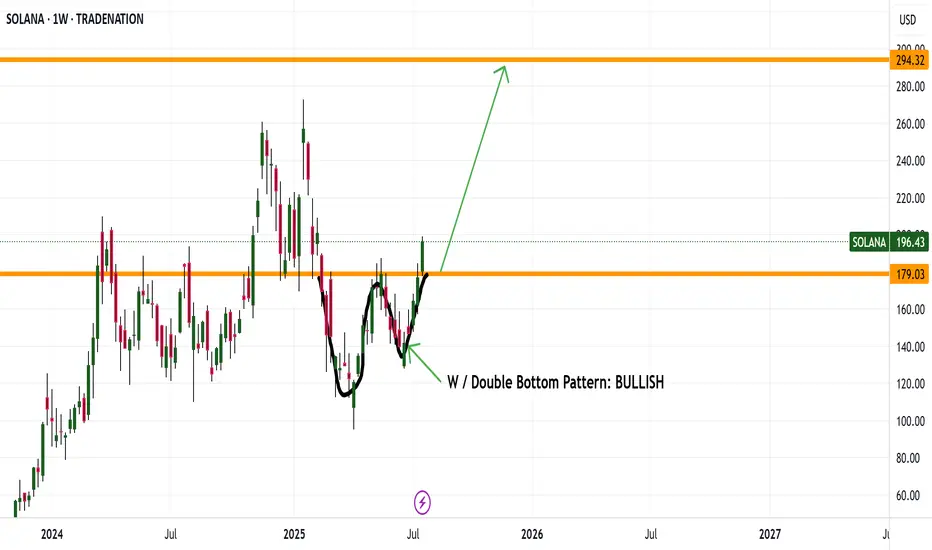
SOLANA DRIVING UP TO 294 Good evening everyone
It looks like SOL made a nice W pattern and now breaking its weekly high is driving up to 294
Enjoy happy trading this bull run
Kris/ Mindbloome Exchange
Trader Smarter Live Better
Cryptomarket
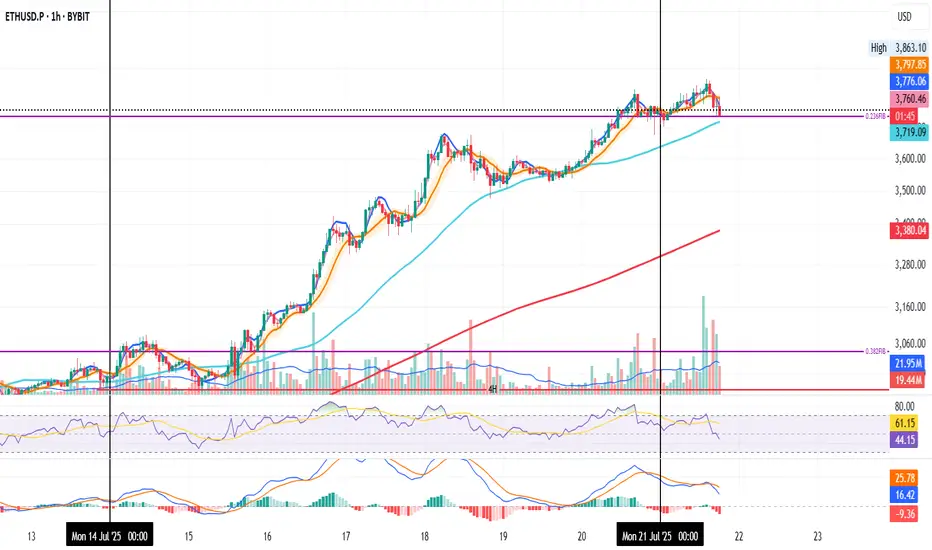
ETH on the 1H and the 0.236 Fib level
Could be a retest. Could be a fakeout. Could be the start of a move down.
RSI and MACD are both dropping.
SMA < MLR < BB Center confirms a downtrend.
50MA is sitting below the Fib level.
200MA is far below at $3,400, but rising quickly.
If tonight’s candles start closing under the Fib level, the warning gets louder.
If not, more upside remains likely.
Always take profits and manage risk.
Interaction is welcome.
BTC Update – Short-Term Pressure Building
Bitcoin is still being pushed down below the BB center.
RSI is trending lower, and MACD is nearing a bearish crossover.
PSAR is hovering close to price, a warning sign.
This could still be a pause before the next leg up — but don’t ignore the signs.
And just a thought: Trump Media buying $2B in BTC might’ve marked a local top.
Prepare in advance.
Always take profits and manage risk.
Interaction is welcome.

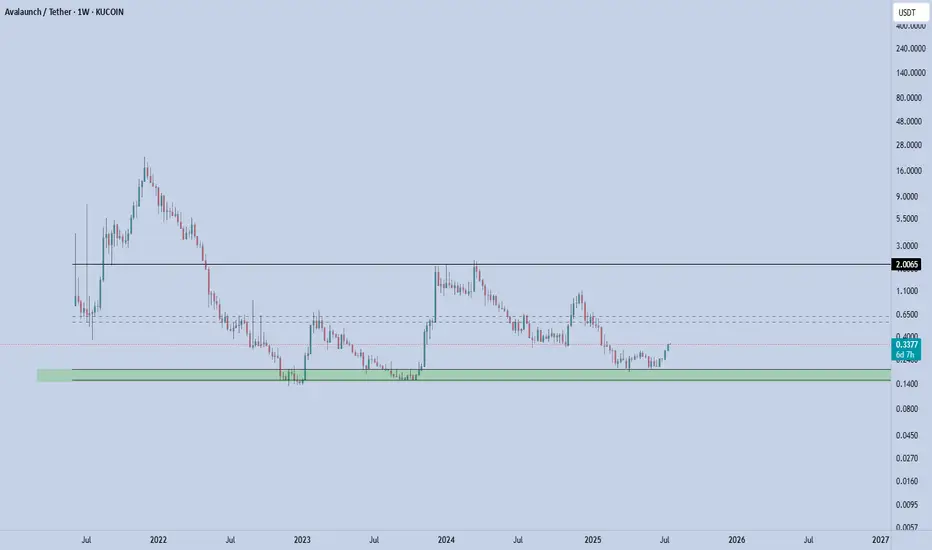
XAVA - Rebound in Play XAVA coin is currently stabilizing in a key support zone — the bottom of the defined channel, which has proven to be a strong and reliable support area. Price recently bounced from this level, confirming buyer interest.
From here, the next immediate target is the mid-range of the channel. If price manages to break above and hold the mid-channel, the next upside objective becomes the top of the channel.
Key Levels
Support (Channel Low): 0.15(invalidation below this level)
First Target (Mid-Channel): 0.56-0.62
Second Target (Channel High): 2
📌 Risk Management: A clean break below 0.15 invalidates this setup. As long as this level holds, the structure remains constructive and favors rotation toward higher levels within the channel.
TradeCityPro | Bitcoin Daily Analysis #133👋 Welcome to TradeCity Pro!
Let's dive into the Bitcoin analysis and key crypto indexes. As usual, in this analysis, I’m going to review the triggers for the New York futures session.
⏳ 1-Hour timeframe
On the 1-hour timeframe, Bitcoin has once again dropped to the support area at 116829 and reacted to it. Currently, it is fluctuating above this level.
✨ If 119395 is broken, the price could move toward the highs at 120594 and 122733.
📈 So for a long position, we can enter on the breakout of 119395. Pay attention to Bitcoin dominance, because if it’s in a downtrend, Bitcoin setups might not be ideal, and altcoins may offer better opportunities.
✔️ If the price stabilizes below 117647, it will enter the box between 116829 and 117647, and this time the likelihood of breaking the 116829 bottom and heading toward lower supports for deeper corrections becomes very high.
👑 BTC.D Analysis
Now let’s look at Bitcoin Dominance. BTC.D is still falling and after breaking the 61.45 level, it has reached 60.46.
⭐ If this level breaks, the next bearish leg may begin. The trend is strongly bearish with no visible weakness, and we’ll have to see how long this continues.
📅 Total2 Analysis
Let’s move to Total2. This index has broken the 1.5 resistance and is moving toward 1.62.
💫 At the moment, I don’t have a trigger for it, and we need to wait until its structure gives us the next setup.
📅 USDT.D Analysis
Now let’s look at Tether Dominance. This index has stabilized below the 4.22 level and is now moving downward after a pullback to this area.
🧩 The next support is at 4.08, and the index has room to fall to that level. I still see the USDT Dominance trend as bearish for now.

ETH: Huge Reversal or Correction Still in the Horizon?The recent price action in Ethereum (ETH) has left market participants questioning its next major move. With volatility high and sentiment shifting, is ETH headed for a massive reversal, or is a correction still looming on the horizon?
Key Points to Consider
Macro Environment: Global markets are facing uncertainty from shifting interest rates and regulatory developments in crypto. These factors may spark continued volatility for ETH in the near term.
Technical Analysis: ETH has many analysts watching key support and resistance areas. A clean break above resistance could signal a reversal, while a failure to hold recent gains may suggest a correction is not over yet.
On-Chain Data: Activity on the Ethereum network, including DeFi usage and staking patterns, can offer clues as to whether accumulation or distribution is taking place.
Market Sentiment: Traders remain divided, with some calling the recent bounce a bull trap, and others anticipating renewed upside momentum.
My Take
While the case for a reversal is gaining strength, the possibility of a broader correction can’t be dismissed. It’s crucial for investors to stay alert, watch the charts, and position size accordingly. I'm not longing any crypto in the short run...As for the long run, extremely BULLISH!
*not investment advice*
#Ethereum #Crypto #Investing #MarketAnalysis #Web3 #crypto #bitcoin #trading

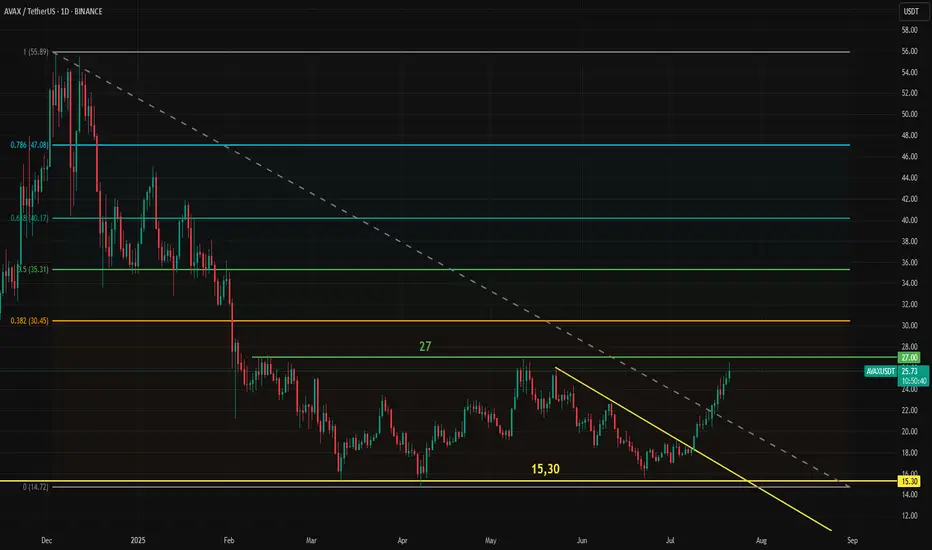
Avax Tests Key Resistance at 27 for the Third TimeAvax is once again testing the 27 resistance level. The first attempt lasted over a week, and the second one held for a couple of days, but in both cases, Avax failed to break through. This time, however, it has stronger support from market-wide momentum.
Bitcoin has reached 120,000, Ethereum is posting sharp gains, and most notably, Chainlink (LINK) has already broken through its own resistance. Avax and LINK have shown a high degree of correlation, nearly 89% over the past two months. This strong relationship, while occasionally fluctuating, has been in place for several years.
A breakout for Avax may take time, but it now has more momentum and supportive conditions behind it. Still, as long as the 27 resistance holds, bulls should approach with caution before entering long positions.
WARNING Bitcoin Dominance is about to reach support -ALTS
All the Cries of "ALT SEASON AT LAST" could be about to stumble if BTC.D finds support on the line of support shown in the chart , that has provided support previously.
There is no way of knowing if it will bounce or not but CAUTION IS A VERY GOOD IDEA
We will know soon enough

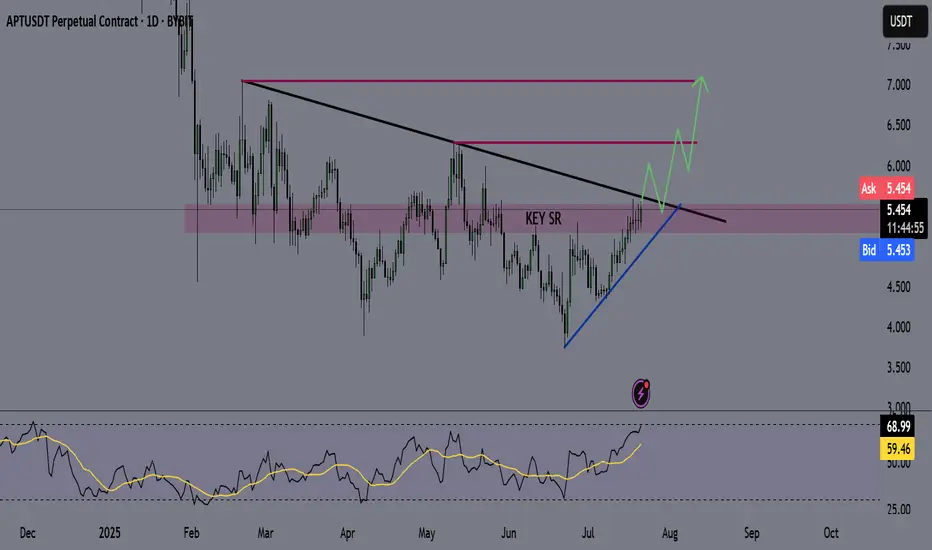
APT - APTOS Coin - Swing Long Idea📌 Fundamental Sentiment:
The entire crypto market is rallying, alongside other risk assets. This momentum is largely driven by U.S. policy expectations — specifically, Trump’s increasing pressure on Powell to resign and aggressively push for rate cuts from the Federal Reserve.
📌 Technical Analysis:
Price is currently testing the HTF supply zone with strong momentum. Additionally, it’s approaching a long-term bearish trendline that has dictated the downtrend since February 2025.
📌 Gameplan:
I want to see:
A clean breakout above the HTF supply zone with daily candle closure.
A confirmed break and close above the HTF bearish trendline on the daily timeframe.
If both confirmations align, I’ll start preparing for swing long setups, potentially riding into the early stages of a 2025 altseason.
—
🔔 Like & Follow for more daily updates. Feel free to drop your thoughts in the comments!
BNB LongI see a buy zone around 735 just after a significant FVG, and moreover, given the overall bullish strength of BNB, the pullback to happen next won't be a deep pullback but rather a light one. Confirming with the Fib retracement tool that zone sits well at the 38% pull back level, which is a good sign of a light bull back to continue the bullish move

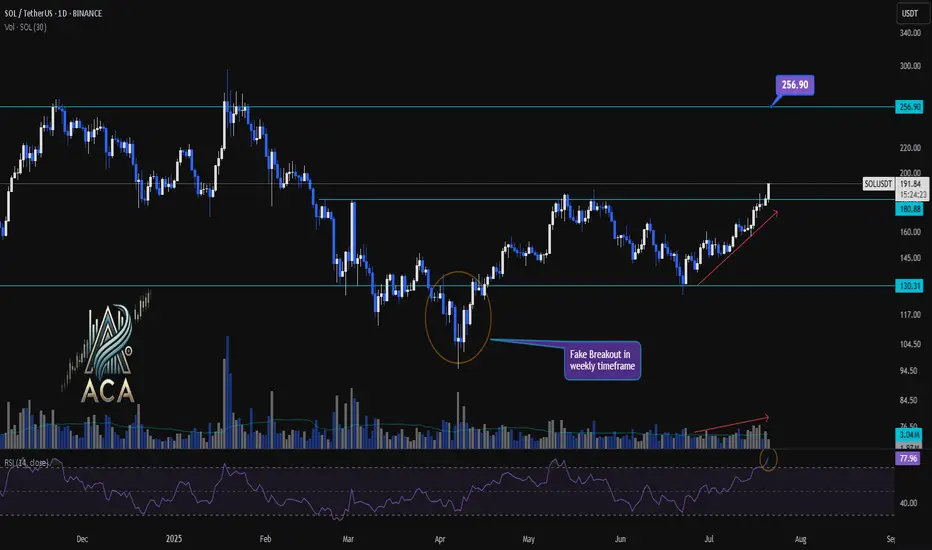
SOLUSDT 1D Chart Analysis | Accumulation Breakout Signals....SOLUSDT 1D Chart Analysis | Accumulation Breakout Signals Fresh Momentum
🔍 Let’s drill into the SOL/USDT daily chart, focusing on the recent breakout above the accumulation range, key support and resistance levels, RSI momentum, and volume confirmation for a robust bullish scenario.
⏳ Daily Overview
SOLUSDT has decisively broken out above a prolonged accumulation box, marking a significant shift in market structure. A daily close beyond this range now serves as a strong indicator for renewed bullish momentum. RSI is currently above 77, signaling that buyers are commanding momentum. Notably, volume has surged in tandem with price, confirming trader participation behind this breakout move.
📈 Technical Convergence and Trend Structure
- Accumulation Zone Break: After consolidating within a clear box for weeks, SOLUSDT closed above the upper boundary (around $180.88–$191.05), signaling a possible trend reversal or continuation.
- Daily Close Signal: A daily close outside the accumulation box offers high conviction for bullish continuation. This close acts as a potential entry signal for trend-followers.
- RSI Momentum: The RSI sits above 77—deep in the overbought territory. A close here not only confirms buyer strength but often precedes sustained uptrends when accompanied by price breakouts.
- Volume Surge: Volume has increased with the breakout, providing confirmation the move isn’t a false start, but likely fueled by real demand.
- Weekly Fake Breakout: There was a notable false breakout in the weekly timeframe, quickly reclaimed by bulls. This flip suggests buyers fended off downside attempts and now drive higher prices.
🔺 Bullish Setup & Targets
- First Target: $256.90 — marking the next major resistance on the chart and a logical upside objective for traders.
- Key Trigger: A confirmed daily (or weekly) close above the accumulation range with strong volume is essential for validating the upward trajectory.
📊 Key Highlights
- The breakdown of the accumulation box—now turned support—marks a pivotal structural change.
- RSI and price are making new local highs, solidifying the case for continued bullish momentum.
- Volume is climbing in sync with the move, offering real confirmation versus a potential fakeout.
- Recent fake breakout on the weekly chart, immediately negated, emphasizes that buyers are regaining—and likely maintaining—control.
🚨 Conclusion
SOLUSDT appears set for higher prices following the confirmed breakout above the accumulation range. Signs of trend health include an overbought RSI, volume confirmation, and the swift invalidation of a recent weekly fake breakout. As long as daily closes stay above the breakout level, the path remains clear for a rally toward $256.90. A strong daily close and continued volume will be your best signals for bullish continuation.
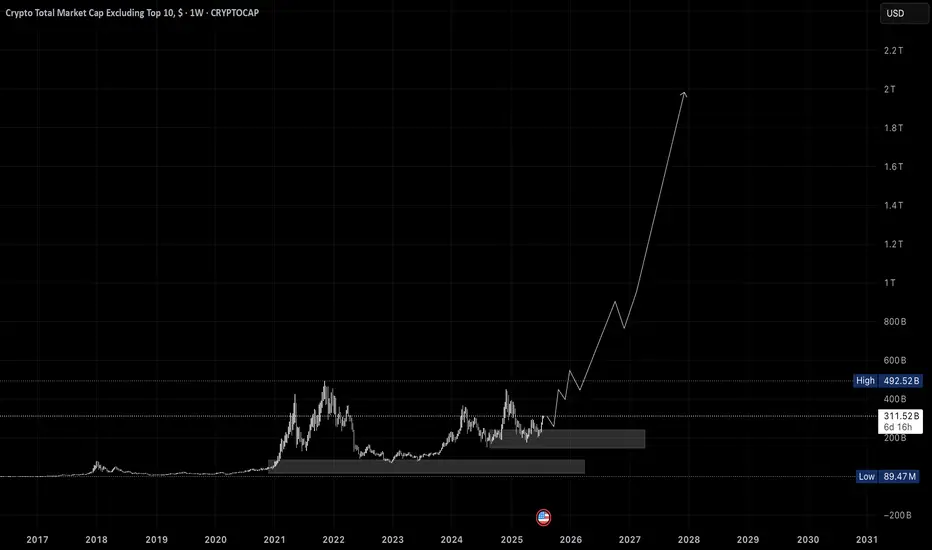
ALTSEAON CHART UPDATE OF CRYPTOCURRECIESthis is altcoins chart , braking through a bulling orderblock ,
its high prbable this gonna break ATH and the move to the new wealth making moves ,
investment is high risk and high rewarding
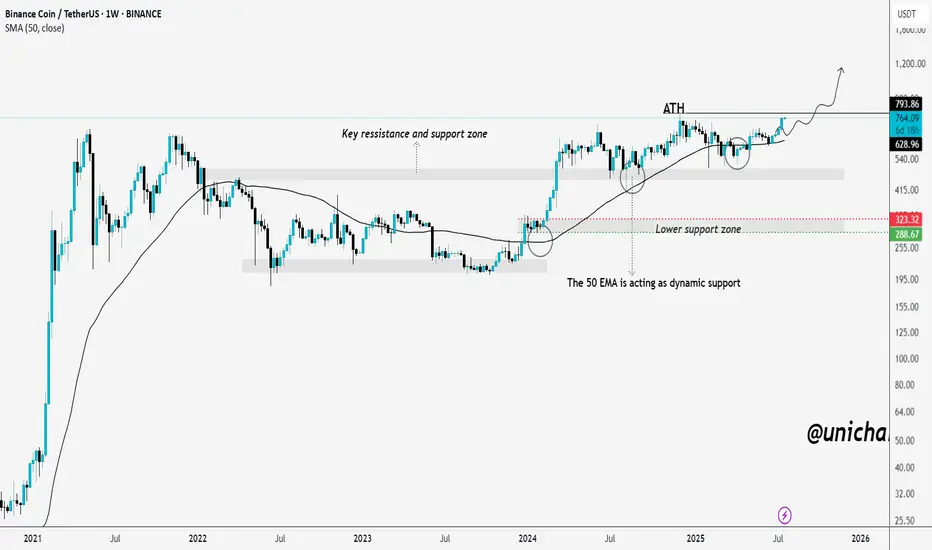
BNB on the Brink of a Breakout – ATH in Sight!We told you earlier — mark our words. BNB is now on the verge of breaking into a new all-time high, and the chart has been signaling this move for months.
The price has consistently respected the key support-resistance zone around $500–$540, and the 50-week EMA has acted as dynamic support throughout the uptrend.
Each dip into the lower support zone between $290–$320 was quickly bought up, showing strong buyer interest and demand. After several healthy consolidations and retests, BNB is once again approaching the previous ATH around $793.
If it breaks above with strong volume, we could enter price discovery mode. All the signs are aligning — and if you caught the early setups, you’re already in a great position. If not, it’s time to stay sharp and watch this breakout zone closely.
The momentum is real, and the fireworks might just be getting started.
THANKS
ETH/USD Breaking Higher, Can Fill The Gap? Hey traders,
Some of the altcoins are recovering very nicely today, with Ethereum being no exception. In fact, we’ve seen a pretty nice consolidation on ETH over the last three weeks, and it looks like it’s breaking to the upside right now. I wouldn’t be surprised to see more gains unfolding into wave five of a five-wave advance away from the April lows.
Targets around 3000 and even 3300 could be quite interesting, especially if we consider the big gap that dates back to February.
GH

Bullish bounce?The Bitcoin (BTC/USD) is falling toward the pivot and could bounce to the 1st resistance.
Pivot: 111,241.55
1st Support: 98,383.98
1st Resistance: 127,752.45
Risk Warning:
Trading Forex and CFDs carries a high level of risk to your capital and you should only trade with money you can afford to lose. Trading Forex and CFDs may not be suitable for all investors, so please ensure that you fully understand the risks involved and seek independent advice if necessary.
Disclaimer:
The above opinions given constitute general market commentary, and do not constitute the opinion or advice of IC Markets or any form of personal or investment advice.
Any opinions, news, research, analyses, prices, other information, or links to third-party sites contained on this website are provided on an "as-is" basis, are intended only to be informative, is not an advice nor a recommendation, nor research, or a record of our trading prices, or an offer of, or solicitation for a transaction in any financial instrument and thus should not be treated as such. The information provided does not involve any specific investment objectives, financial situation and needs of any specific person who may receive it. Please be aware, that past performance is not a reliable indicator of future performance and/or results. Past Performance or Forward-looking scenarios based upon the reasonable beliefs of the third-party provider are not a guarantee of future performance. Actual results may differ materially from those anticipated in forward-looking or past performance statements. IC Markets makes no representation or warranty and assumes no liability as to the accuracy or completeness of the information provided, nor any loss arising from any investment based on a recommendation, forecast or any information supplied by any third-party.

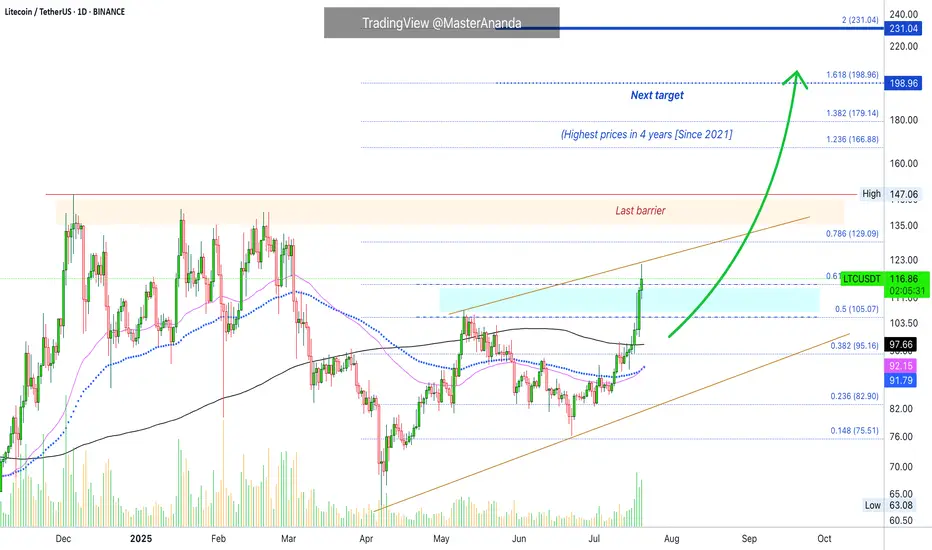
Litecoin's Path Beyond $200 Revealed · Daily TimeframeWe looked at Litecoin on the weekly timeframe which is the long-term picture, but we also need to consider the daily to see what is happening up-close.
As soon as we open this chart we have three signals that stand out:
1) Litecoin is now trading above MA200 safely and rising. This is a very strong bullish development and supports additional growth.
2) Trading volume has been rising significantly being now the highest since February 2025. The difference is that in February we were in distribution, resistance being confirmed with prices set to move lower. In this case, the action is rising from support and volume is rising rather than dropping.
3) May's peak has been broken. Many pairs are still trading below their high in May. Those that broke this level are the ones moving first and this signal exudes strength. Litecoin is now one of the top performers specially in the group with a big market capitalization.
The next barrier is the December 2024 high at $147. Short-term the next target is $129. As soon as the former breaks, we are going to be looking at the highest price since 2021.
Litecoin is fighting resistance today, 0.618 Fib. extension at $115. It is trading above this level but the confirmation only happens at the daily close. If it closes above, bullish confirmed. It if closes below, it means that there will need to be some struggling before higher prices. This struggling can last a few days just as it can extend. Seeing Ethereum and how it is moving straight up, Litecoin is likely to do the same.
Overall, conditions are good for Litecoin on the daily timeframe.
Thank you for reading.
Namaste.
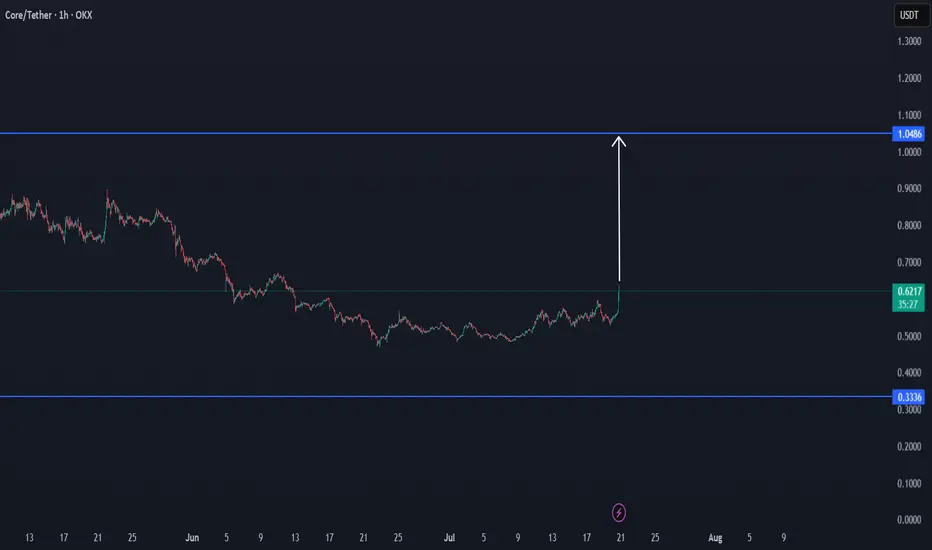
CORE/USDT NEW CYCLE STARTING TO $1CORE looks to enter a new cycle trend, which can confirm an important area, and can be also the reason to enter a new target to $1 with time.
Following this coin, with the upcoming confirmations.
More data?
Check this update for new confirmations.
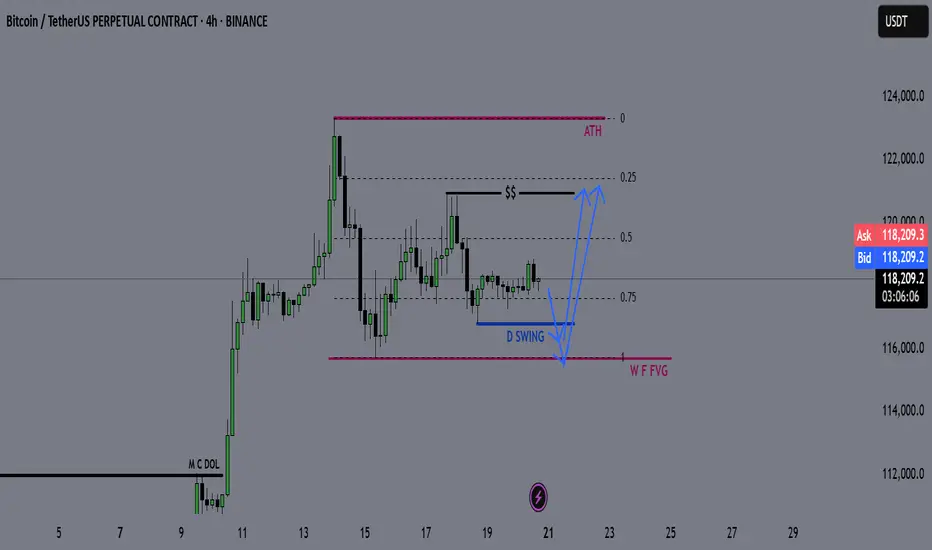
BTC Weekly Recap & Outlook 20/07/2025📈 BTC Weekly Recap & Outlook
Market Context:
Price continued its bullish momentum, fueled by institutional demand and supportive U.S. policy outlook.
We captured solid profits by following the game plan I shared earlier (see linked chart below).
🔍 Technical Analysis
✅ BTC made a strong bullish move, breaking into new all-time highs.
📊 The daily RSI entered overbought territory, which signaled the potential for a short-term retracement or consolidation.
Currently, price is ranging, and RSI is cooling off. That tells me the market is likely building energy for the next leg up — but not before a significant liquidity run.
🎯 Game Plan
I'm watching for one of two potential setups:
1️⃣ Liquidity Sweep to the Downside
- A run of the daily swing low
- Into the most discounted range (0.75 Fib zone)
OR
2️⃣ Tap into the Weekly FVG Zone (marked with the purple line)
Either move would create the liquidity and energy needed to fuel a breakout above the equal highs (EQHs) marked by the black line.
🚀 Target
First Target: EQHs (Black Line)
Second Target: Price Discovery (new ATHs)
💬 Let me know your thoughts or drop your own chart ideas below!
📌 Follow for Weekly Recaps & Game Plans
If you found this useful, make sure to follow for weekly BTC updates, market outlooks, and detailed trade plans based on structure and liquidity.
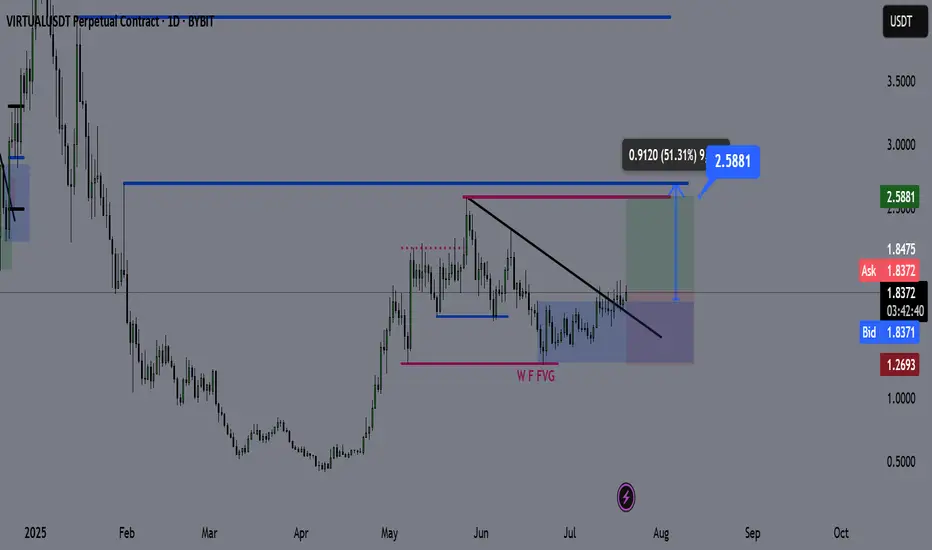
Virtual Coin – Technical Outlook & Trade Plan🔍 Technical Analysis
✅ Price has broken and closed above the bearish trendline, indicating a shift in market structure.
✅ It’s currently consolidating above the trendline, and each retest is showing strong bullish reactions.
✅ The bullish daily demand zone is holding aggressively, reinforcing upward momentum.
I do not expect a significant retracement from here until we reach the purple line (2.59). The current structure suggests price wants to seek higher liquidity.
📌 Trade Plan
Entry: Current market (above trendline + demand zone reaction)
Take Profit (TP): 2.59 (Purple Line)
Stop Loss (SL): 1.26 (Daily Close Below)
📊 Bias: Bullish
🕰️ Timeframe: Daily
📍 Invalidation: Daily close below the demand zone and trendline support
💬 Feel free to share your thoughts or ask questions below!
BTC Daily Outlook
In my opinion, Bitcoin looks like it might need a short pause here.
📉 It's sitting just below a key Fib level and may require some time to consolidate before making another attempt.
📌 Price is printing a possible second close below the BB center.
📉 SMA is below the BB center — not ideal.
📊 Volume saw a strong red spike on July 15
📉 OBV formed a lower high while price remains elevated (granted, it’s the weekend and volume tends to dip).
📉 RSI is below 70 and under its moving average.
Too early for a strong conclusion — but this is a caution signal.
Let’s stay alert and watch it unfold together.
Always take profits and manage risk.
Interaction is welcome.

ETH 1H – Breakout or Bull Trap ?
ETH just broke above the 0.236 Fib with a strong push.
✅ Trend structure remains bullish:
MLR > SMA > BB Center.
But something feels off...
🔍 Volume surged late — likely short liquidations.
OBV didn’t confirm — it's still lagging.
RSI is extended. Structure looks tired.
Could be a liquidity grab above recent highs.
If price closes back below the Fib, momentum could fade fast.
📌 Key zones to watch on a pullback:
– 1H 50MA
– Previous support clusters
We’ll be here to watch it unfold.
Always take profits and manage risk.
Interaction is welcome.

LITCOIN BUY OR SELL !!!Hello friends🙌
🔊According to the price drop, you can see that the price has been below the specified resistance for a while and when it was able to break the resistance, it shows us the power of the buyers. Now, when we return to the previous resistance, which has now become a support, you can see that the buyers are providing good support and the price is expected to move to the specified targets.
Note that the most important rule in trading is capital and risk management So make sure to follow it.
🔥Follow us for more signals🔥
*Trade safely with us*

Jul 20 | Crypto-market reviewNew Crypto-Sunday market review video, where I share my current analysis on the trend structures of BTC, ETH, SOL, XRP, HYPE and other alt- and mem-coins of interest to my, highlighting key support and resistance zones to watch in the coming sessions.
Charts featured in the video
BTC
ETH
XRP
(!) SOL
(!) HYPE
(!) TRUMP
BRETT
(!) FET
RENDER (Weekly)
(!) DOG
(!) MOG
Thank you for your attention and I wish you happy Sunday and great trading week!
If you’d like to hear my take on any other coin you’re tracking — feel free to ask in the comments (just don’t forget to boost the idea first 😉)
