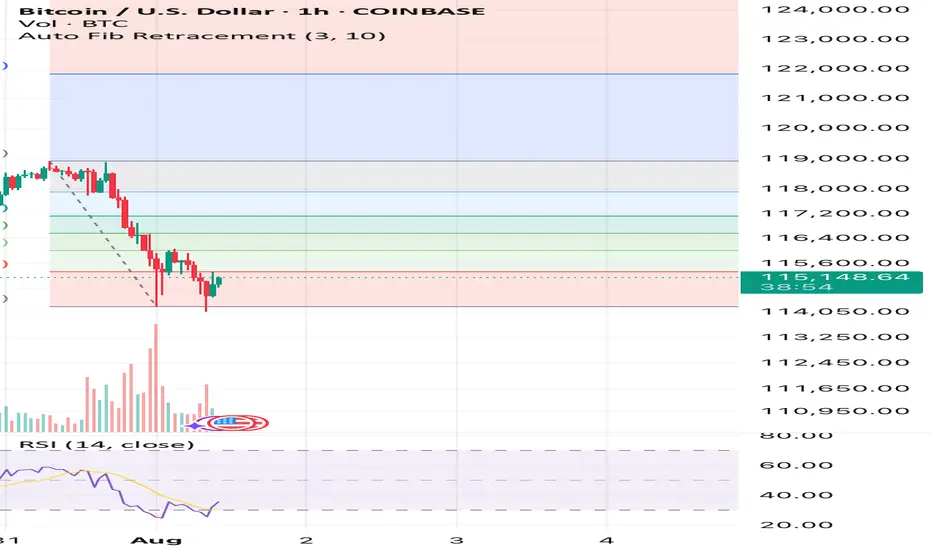
Bitcoin has an upside to it if we hold above $14,900See what you think it’s simple Auto Fib Retracement and RSI. That’s all I’m using here and also past times and other data outside of this image but inside the CRYPTOCAP:BTC market.
What you think? Up to $118k again before down or sideways? Or will this be the end of the large bull flag formation? We’ll soon find out!
Cryptomarketcap
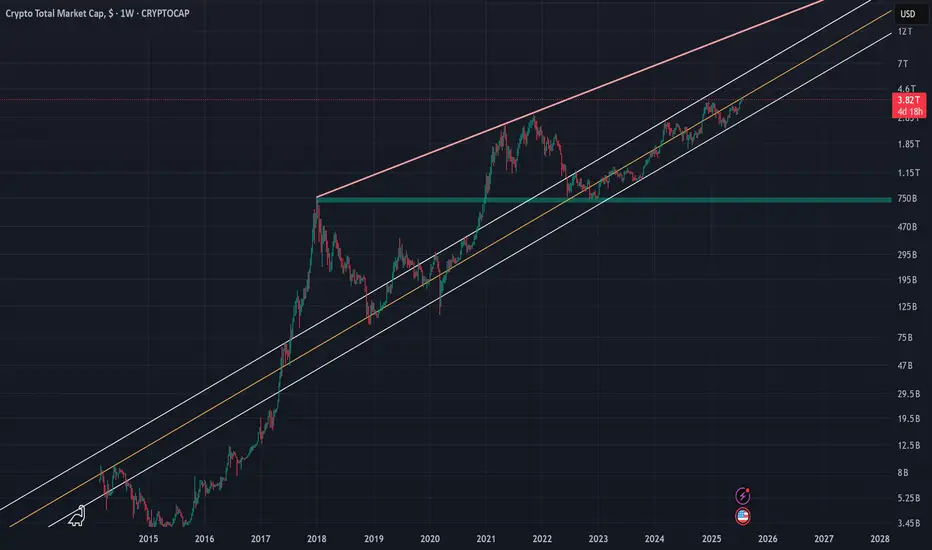
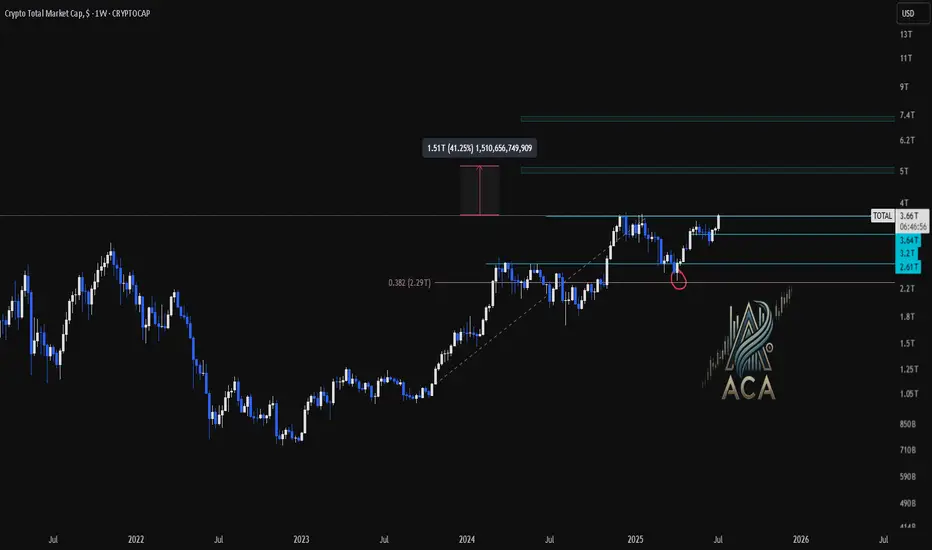
Crypto Total Market Cap (TOTAL) | 1WThe crypto market cap represented by the symbol TOTAL can be considered the most important index for analyzing the cryptocurrency market, although I believe that analyzing Bitcoin itself, given its strong positive correlation with the TOTAL index, would yield similar results. In the attached image, the red line actually indicates the overall resistance level of the symbol, and the drawn parallel channel illustrates the current upward trend of the TOTAL symbol, which is now on the verge of encountering its round resistance at 4 trillion dollars. While we should expect a correction around this level, breaking through the 4 trillion dollar resistance could likely lead to a market cap of 6 to 7 trillion dollars in the next phase. On the other hand, with support at 2.4 trillion dollars based on the 100-week SMA on the weekly timeframe, the 750 billion dollar level—marked by a green zone in the image—can still be considered the most important long-term market support, even before the fifth halving.
I will try to continuously update this analysis of the TOTAL symbol according to market changes and developments. Also, I welcome reading your critiques and comments, so don’t forget to leave a comment!
Eth Targetseth short term trade but once the market breals obver 3960 and sustain the longs will work great to 4350 level

MARKETS week ahead: July 27 – August 2Last week in the news
Trade tariff (un)certainties shaped market sentiment during the previous week. The US-Japan trade deal was settled which brought some relaxation among investors. The US equities continued with a positive trend, with the S & P 500 reaching fresh all time highest level, ending the week at 6.388. On the same ground the price of gold turned a bit toward the downside, closing the week at $3.336. The relaxation was evident also in 10Y US Treasury yields, which closed Friday trading session at 4,38%. BTC had a short liquidation session on Friday, shortly reaching the $115K level, however, swiftly returned back toward the $118K.
The European Central Bank (ECB) held its July meeting during the previous week, where it held interest rates steady after seven consecutive cuts, signalling a more cautious approach going forward. While its macroeconomic outlook remains unchanged, the ECB sees downside risks to growth, including global trade tensions and weak market sentiment. President Lagarde downplayed concerns about the stronger euro and minor inflation undershooting, emphasizing a data-dependent, meeting-by-meeting policy stance. Although the ECB appears comfortable with its current position, a final rate cut in September is still possible if inflation or macro data disappoint.
President Trump announced a major trade deal with Japan this week, featuring a 15% reciprocal tariff, marking a shift in bilateral trade relations. The U.S. also reached a framework agreement with Indonesia, reinforcing efforts to strengthen trade ties across Asia. Trump signalled that more deals may be finalized before the August 1 tariff deadline, including potential progress with the EU, as a meeting with Commission President von der Leyen is set for Sunday in Scotland. These developments have been well received by investors, easing concerns over trade uncertainty and potential supply chain disruptions.
China unveiled a global AI action plan at the World Artificial Intelligence conference in Shanghai, calling for international cooperation on technology development and governance. Premier Li Qiang proposed establishing a global AI cooperation organization to coordinate regulation and infrastructure, emphasizing equitable access. The plan positions China in contrast to the U.S., favoring multilateralism over America's more block-oriented approach to AI strategy. Featuring participation from over 800 companies including domestic giants Huawei and Alibaba, the conference showcased thousands of AI innovations and signals China's ambition to challenge U.S. dominance in the field.
Palantir's stock achieved a new record high last Friday, rising over 2% and lifting its market cap to around $375B. With the latest move, the company is now holding 20th place as the most valuable U.S. company. The company's shares have more than doubled this year as investors' enthusiasm grows around its AI capabilities and government contract momentum. Analysts attribute the rally to Palantir's strengthened role in AI analytics and expansion in defence-related software and data contracts.
CRYPTO MARKET
The crypto market was traded in a mixed mode during the previous week. Some liquidations were made in BTC, followed by altcoins, however, there were also coins with relatively solid weekly performance. Total crypto market capitalization was increased by 1% on a weekly basis, adding total $39B to its market cap. Daily trading volumes were modestly decreased to the level of $275B on a daily basis, from $333B traded a week before. Total crypto market capitalization increase from the beginning of this year currently stands at +19%, with a total funds inflow of $600B.
BTC had a relatively flat week, with only $3B of funds inflow. On the other hand ETH continues to perform strongly, with another week in a positive territory of 5,3%, increasing its cap by $23B. XRP did not perform well on a weekly basis, as the coin had a drop in value of 7,4% and outflow of $15B. Some of the significant weekly gainers include Litecoin, with a surge of 13% on a weekly basis, Maker was traded higher by 14%, BNB gained 7%, while Solana was higher by 5% same as Uniswap. Other altcoins were traded either with a modest drop in value or with a modest increase in value.
There has been increased activity with circulating coins. Another week in a row, IOTA is increasing the number of coins on the market by 0,8% w/w. EOS had an increase of 0,6%, same as Polkadot. The majority of other altcoins had a modest increase of circulating coins of 0,1%, including XRP.
Crypto futures market
This week the crypto futures market reflected perfectly developments on the spot market, with ETH long term futures managed to pass the $4K level.
BTC futures were traded mostly flat compared to the previous week. Futures maturing in December this year closed the week at $120.810, and those maturing in December 2026 were last traded at $127.500. At the same time, ETH futures were traded around 2,5% higher for all maturities. Futures ending in December 2025 reached the last price at $3.779, while those maturing in December 2026 for the first time ended the trading week at $4.058.
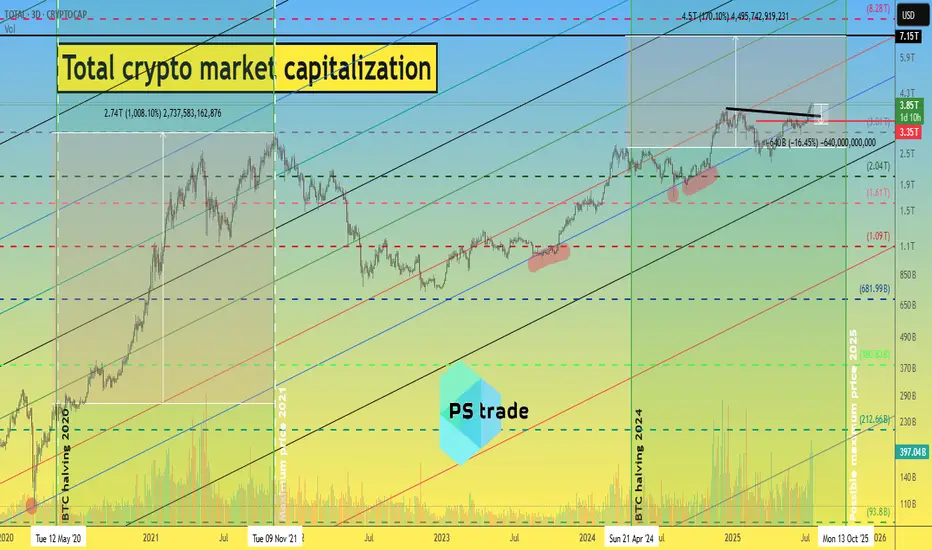
What to expect in the crypto market until 2026 ?!📈 Today, we will look at the graph of the total capitalization of the cryptocurrency market, as well as the implementation of our ideas from 2022 to 2025.
At that time, the cryptocurrency market was in a total depression, there was no talk of BlackRock or MicroStrategy buying cryptocurrencies, and we stubbornly wrote that this was the bottom... and then a miracle happened)
During this time, the total capitalization of the crypto market grew 5 times from $800 million to $4 billion.
ℹ️ You can find all posts in the channel by searching by date:
1️⃣ 18.11.22 - “How much can the crypto market capitalization grow by the end of 2025?”
The growth momentum is slowing down, but the following ideas give hope.
2️⃣ December 30, 2022 - “Plans for 2023-25”
If we are to believe this fractal, which has been working for over 2.5 years, then all the most interesting things are still ahead.
3️⃣ 29.02.2024 - “What to expect from the crypto market in 2024-26”
At the beginning of 2024, the previously published fractal was slightly adjusted to the market situation.
4️⃣ 04.03.2025 - “The total capitalization of the crypto market is on the verge of a foul.”
Then, despite the market depression and a lot of negative news, the total capitalization still managed to stay above the blue trend line.
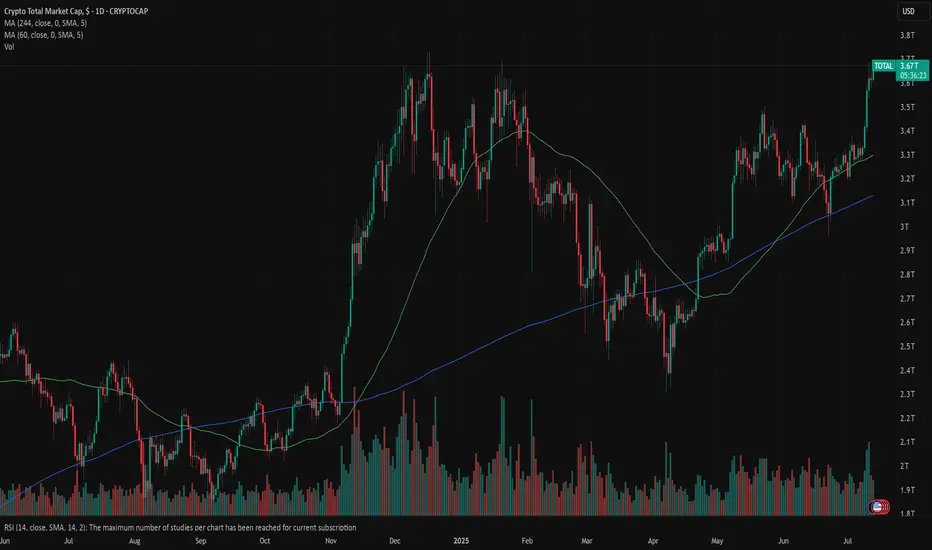
📊 Cryptocurrency market capitalization as of 22.07.25:
◆ Bitcoin - $2.36 trillion
◆ Ethereum - $442 million
◆ Ripple - $206 billion
◆ SOL and BNB - $110 billion each
◆ USDT and USDC - $162 billion and $65 billion, respectively.
In total, this is $3.45 trillion out of $3.89 trillion of the total crypto market capitalization.
♎️ Too much capital is concentrated in the top 7 projects; we need a process of capital flow and the launch of exponential growth. Especially since all of the above fractals “suggest” that the time has come and anything is possible.
🔃 The total capitalization of the crypto market must continue to remain above the blue trend line, i.e., it cannot be adjusted by more than -13-16% to $3.25-3.35 trillion.
Roughly speaking, the price of CRYPTOCAP:BTC cannot be adjusted by more than -10% due to its high dominance at the moment. (Such an adjustment of the #BTCUSDT price fits into the scenario we published a few days ago.)
_____________________
Did you like our analysis? Leave a comment, like, and follow to get more
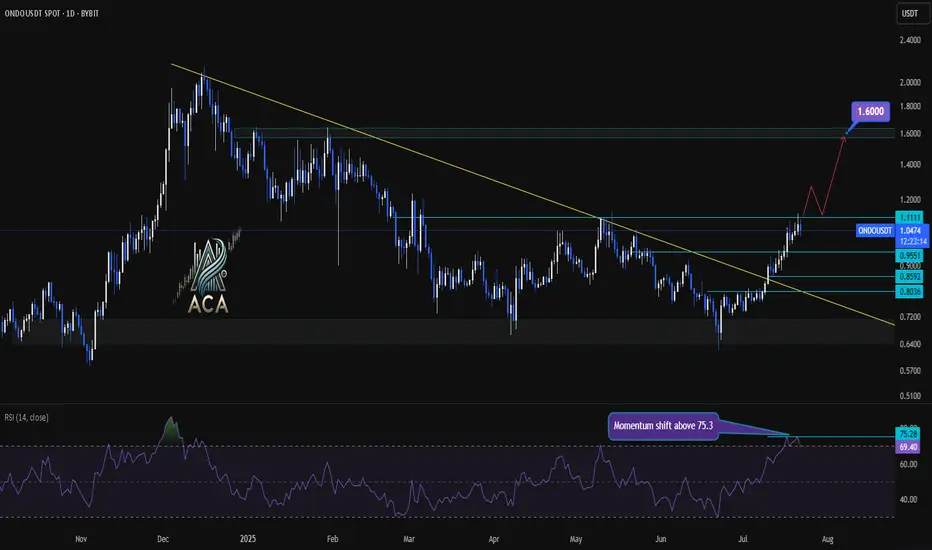
ONDOUSDT Daily Chart Analysis | Momentum Shift & Breakout LevelsONDOUSDT Daily Chart Analysis | Momentum Shift & Breakout Levels
🔍 Let’s dive into the ONDO/USDT daily chart and break down the latest momentum signals, key breakout areas, and targets for bulls.
⏳ Daily Chart Overview
The daily trend shows significant recovery after prolonged downward pressure, with price action now testing critical resistance levels. A key descending trend line has recently been challenged, highlighting a potential shift in market structure.
🔺 Bullish Setup
- Momentum Trigger: The RSI has closed above 75.3, signaling a strong momentum shift and upping the odds for continued upside.
- Breakout Confirmation: Watch for a daily candle close above the $1.1111 resistance level. This would confirm a bullish breakout and could serve as a solid trigger for further upside.
- Trend Line Dynamics: The price has decisively broken above the major descending trend line, which had capped rallies for months—removing a significant area of supply and emboldening bulls.
- Upside Target: Once confirmed, this setup opens the door for an advance towards the $1.60 area, where the next major resistance sits.
📊 Key Highlights
- Daily RSI closing above 75.3 reflects strong market momentum and buyer dominance.
- A daily candle close above $1.1111 can be used as a bullish trigger.
- The long-term descending trend line has been broken, indicating a major momentum shift.
- Immediate upside target stands at $1.60, representing a clear resistance level for profits or further evaluation.
🚨 Conclusion
Momentum is clearly shifting in favor of the bulls as technical barriers fall by the wayside. For traders looking to position long, confirmation above $1.1111 combined with the powerful RSI reading sets the stage for a move towards $1.60—keep these levels on your radar as the setup plays out!
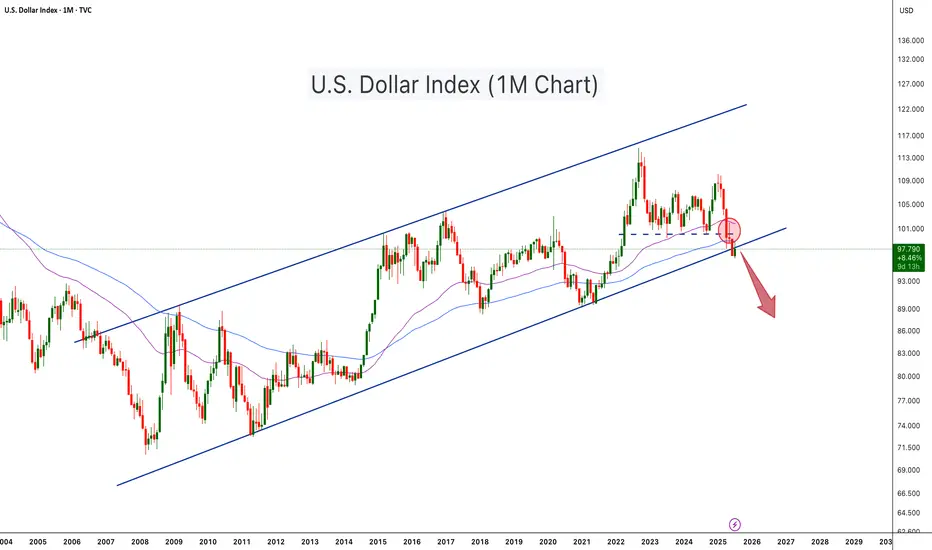
U.S. Dollar Index Loses Key Support – Crypto Bull Run Loading?The U.S. Dollar Index (DXY) has just broken below a long-term ascending channel, which has held since 2008. After losing the key horizontal support (~100 level), DXY retested and rejected from it (red circle), confirming a potential trend reversal. The move is technically significant and hints at further downside, possibly toward the 88–90 zone or lower.
This breakdown aligns with classic macro cycles, where a weaker dollar often fuels bullish momentum in risk assets, especially crypto. Historically:
-DXY downtrends in 2017 and 2020–2021 coincided with major Bitcoin and altcoin bull runs.
-DXY strength during 2018 and 2022 contributed to crypto bear markets.
With DXY now below both horizontal and diagonal support, Bitcoin and the broader crypto market may be entering the next expansion phase, especially if the dollar continues its downward trajectory
-DXY has broken below a 17 year rising channel – a macro bearish signal.
-Rejection from former support turned resistance confirms breakdown.
-A falling DXY historically corresponds with Bitcoin rallies and altseason expansions.
-Declining dollar strength could be the fuel that propels Bitcoin past $140K and Ethereum above $6K.
-A dollar bear trend may fuel total crypto market cap breakout beyond $4T+.
As DXY weakens, liquidity tends to rotate into risk-on assets like crypto. This setup mirrors pre-bull run environments seen in 2017 and 2020. A structural breakdown in the dollar could act as a catalyst for Bitcoin’s next major leg up.
Cheers
Hexa
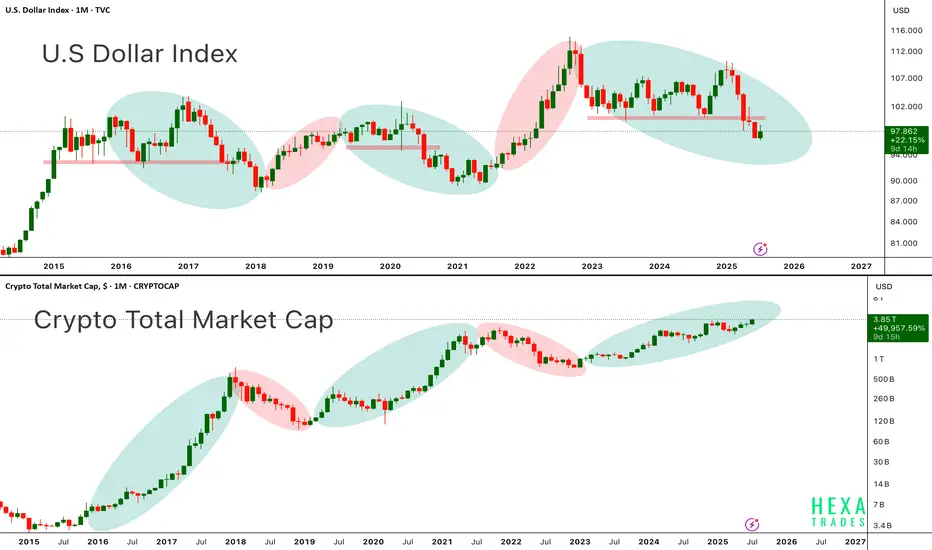
DXY vs. CryptoAbove chart highlights the long standing inverse correlation between the U.S. Dollar Index and the Crypto Total Market Cap a relationship that has guided the macro trend for Bitcoin and altcoins since 2015.
in the first chart, When the dollar weakens (green ovals), crypto tends to rally. When the dollar strengthens (red ovals), crypto markets usually experience corrections or prolonged bear markets.
In the second chart, each period of dollar weakness aligns almost perfectly with explosive crypto upside seen in 2017, 2020–2021, and now potentially again in late 2024 through 2025. Conversely, periods of DXY strength (2018, 2022) coincide with crypto market downturns.
Currently, DXY is entering a downward phase, while the crypto total market cap is pushing higher, now above $3.8 trillion suggesting that a new leg in the crypto bull cycle may be underway. Bitcoin and Ethereum have historically performed best when DXY trends lower, as liquidity shifts into risk-on assets.
Key Points:
-DXY and crypto market cap show a strong inverse macro relationship.
-DXY in a clear downtrend from 2024 highs supportive of further crypto upside.
-Crypto Total Market Cap approaching all-time highs suggesting broad market strength.
-Potential for BTC > $150K and ETH > $6K+ if this macro divergence continues.
-This setup resembles early 2020, right before the massive crypto bull run.
If the dollar continues to weaken structurally, crypto markets led by Bitcoin and Ethereum could see accelerated momentum, pushing into parabolic territory by late 2025.
Cheers
Hexa🧘♀️
MARKETS week ahead: July 20 – 26Last week in the news
Resilient inflation and the jobs market in the US supported further investors sentiment, bringing equities to higher grounds. The new all time highest level was reached by the S&P 500, which is closing the week at 6.296. The US Dollar gained in value during the week, however, the price of gold remained relatively flat, closing it at $3.349. Strong macro data decreased expectations among market participants over the Fed's rate cut, bringing 10Y US yields down to 4,42%. The new Genius Act was passed in the U.S. House, supporting the price of BTC to hold at higher grounds, above the $118K.
The U.S. economic data in focus last week was led by June inflation figures. Headline inflation remained relatively stable, rising 0.3% for the month and 2.7% on a yearly basis, both matching market expectations. Core inflation came in at 0.2% for the month and 2.9% annually, slightly below forecasts by 0.1 percentage points, though still elevated. The Producer Price Index (PPI) was flat in June (0.0%), with core PPI also unchanged. On an annual basis, PPI rose by 2.3%, and core PPI by 2.6%. Meanwhile, retail sales in June outperformed, climbing 0.6%, well above the expected 0.1%. Another positive news came from the University of Michigan preliminary Consumer Sentiment Index for June, where five-year inflation expectations eased to 3,6% (down from 4% posted previously), while one-year expectations declined to 4,4% from the previous 5%. Resilient macro data decreased market expectations over the potential Feds rate cut in September to 50% from previous 70%, as per data shown in CME FedWatch Tool.
The Genius Act was passed by the U.S. House on July 17th, after its approval from the Senate in June. The bill represents an important milestone for the crypto market, as it sets a comprehensive federal standard for stablecoins, clearing the way for banks and fintechs to issue them under clear reserve and audit rules. Among others, it allows permitted institutions to issue U.S. Dollar-pegged stablecoins, backed 1:1 by liquid reserves such as cash or Treasuries. It also mandates strict rules for reserves, custody and consumer protection in terms of full reserves, monthly disclosures, segregation of assets and priority in bankruptcy, aimed to boost consumer confidence and financial stability.
Weekly news on trade tariffs include a report by the Financial Times indicating that the US President had intensified his trade demands on the European Union after weeks of negotiations. According to the report, Trump is now pushing for a minimum tariff of 15% to 20% on imports from the EU, escalating further trade tensions.
Effective July 23, the composition of the S&P 500 index will be adjusted. A tech company Block will be added to the index, replacing energy company Hess, which will be removed. Following the announcement, Block’s shares jumped 10% on Friday.
Denmark is the first country in the world which passed the legislation by which citizens of their country own the copyright to their own face, voice and body. With this move Denmark Government is trying to protect its citizens from AI deepfakes, and similar misuse of data, pictures and voices of its citizens, without an explicit consent.
CRYPTO MARKET
While the previous week was the one dedicated to BTC, this week belongs to altcoins, who drove total market capitalization to higher grounds. The adoption of the Genius Act by the U.S. House was the main trigger behind the strong demand for altcoins. The crypto market gained a total $181B in market cap, increasing it by 5% on a weekly basis. Out of $181B, BTC participated with “only” $11B. Daily trading volumes were also increased to the level of $333B, from around $300B traded a week before. Total crypto market capitalization from the beginning of this year currently stands at 17%, with a total funds inflow of $561B.
This week belongs to ETH and other altcoins, which were major weekly gainers. ETH managed to add $74B to its market cap, increasing it by an incredible 20,8%, reaching levels of $3,5K. XRP was also one of coins with a gain above 25%, adding total $41B to its market cap. This week, market favourite Solana added $9,4B to its capitalization, increasing its total value by 11%. BNB managed to collect new $6,3B, surging by 6,6%, while DOGE added $6,7B to its market cap, which was increased by 23%. Among significant gainers ADA should also be mentioned, with an weekly increase in its cap by $4,2B or 17%.
A relatively calmer week when coins in circulation are in question. The main weekly difference relates to ZCash which withdraws 3,8% of its coins from the market free float. At the same time, Solana was the one to increase its number of circulating coins by 0,4% this week. Algorand also had an increase of coins on the market by 0,3%.
Crypto futures market
BTC and ETH futures were moving in opposite directions during the previous week. While BTC futures had a modest drop in value for all maturities, ETH futures gained significantly. BTC futures were traded by around 0,8% lower from the week before. Futures maturing in December this year closed the week at $121.215, and those maturing a year later were last traded at $128.345.
At the same time, ETH futures marked a surge in value of around 18% for all maturities. The coin passed the $3,5K levels. December 2025 futures were closed at $3.678, while those maturing in December 2026 were last traded at $3.958.
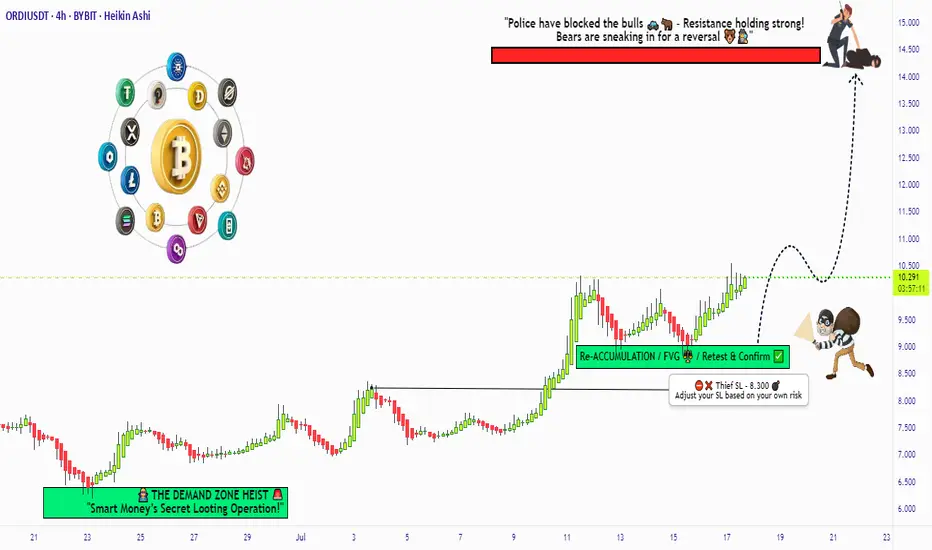
"ORDI/USDT: Pirate’s Treasure Trade! Bullish & Loaded"🚨 ORDI/USDT HEIST ALERT! 🚨 ORDI/USDT Bullish Raid Plan (Thief Trading Style) 💰🎯
🌟 Attention Market Pirates & Profit Raiders! 🌟
🔥 Thief Trading Strategy Activated! 🔥
📌 Mission Brief:
Based on our elite Thief Trading analysis (technical + fundamental heist intel), we’re plotting a bullish robbery on ORDI/USDT. Our goal? Loot profits near the high-risk resistance zone before the "Police Barricade" (bear traps & reversals) kicks in!
🚨 Trade Setup (Day/Swing Heist Plan):
Entry (📈): "The vault is open! Swipe bullish loot at any price!"
Pro Tip: Use buy limits near 15M/30M swing lows for safer pullback entries.
Advanced Thief Move: Layer multiple DCA limit orders for maximum stealth.
Stop Loss (🛑): 8.300 (Nearest 4H candle body swing low). Adjust based on your risk tolerance & lot size!
Target (🎯): 14.400 (or escape early if the market turns risky!).
⚡ Scalper’s Quick Loot Guide:
Only scalp LONG!
Rich thieves? Go all-in! Broke thieves? Join swing traders & execute the plan slowly.
Use trailing SL to lock profits & escape safely!
💎 Why ORDI/USDT? (Fundamental Heist Intel)
✅ Bullish momentum in play!
✅ Macro trends, & intermarket signals favor upside!
✅ News-driven volatility? Expect big moves!
⚠️ WARNING: Market Cops (News Events) Ahead!
Avoid new trades during high-impact news!
Trailing stops = Your best escape tool!
💥 BOOST THIS HEIST!
👉 Hit LIKE & FOLLOW to strengthen our robbery squad! More lucrative heists coming soon! 🚀💰
🎯 Final Note: This is NOT financial advice—just a thief’s masterplan! Adjust based on your risk & strategy!
🔥 Ready to Raid? Let’s STEAL Some Profits! 🏴☠️💸
👇 Drop a comment & boost the plan! 👇
(🔔 Stay tuned for the next heist!) 🚀🤫
MARKETS week ahead: July 13 – 19 | XBTFXLast week in the news
Previous week was short in US macro news, however, news regarding trade tariffs were the ones that shaped market sentiment at Friday's trading session. The optimism on the US equity markets still holds, regardless of a short correction on Friday. The S&P 500 reached another all time highest level, ending the week at 6.259. Gold was once again a refuge from tariffs for investors, gaining during the week, ending it at $3.354. Tariffs tensions rattled US Treasury yields, with the 10Y benchmark closing at 4,41%. Certainly, the winning asset of the week was BTC, which broke the $108K resistance and moved all the way up to $118K, bringing another all-time highest level.
This week was relatively quiet in terms of key U.S. macroeconomic data. The main highlight was the release of the FOMC meeting minutes from June. The minutes didn’t reveal any new information beyond what has already been communicated publicly. The Federal Reserve continues to emphasize the need for flexibility regarding future rate cuts and is likely to remain on hold until economic indicators more clearly signal a slowdown. Most analysts still expect the next rate cut to come in late 2025 and early 2026. This outlook is shaped by persistent risks of both rising inflation and increasing unemployment, driven by recently imposed trade tariffs, which present ongoing challenges for Fed policymakers.
When it comes to trade tariffs, the previous week brought news regarding imposition of a 35% tariff on imports from Canada and a 50% tariff on goods coming from Brazil into the U.S. There have also been discussions about the possible introduction of a broader 10% universal tariff on most other countries, with some mentions of rates as high as 15% or 20%, as well as 50% on all copper imports. News posted on Saturday noted the introduction of a 30% tariff on all imports from the European Union and Mexico. The European stocks closed the Friday's trading session lower, waiting for a tariffs-letter from the US Administration, which was released on Saturday.
News is reporting that the US Government managed to end June with a budget surplus of $27B, for the first time since 2017. The reason behind the increased funds analysts are noting a surge in income from tariffs, which reached $113B this year. Still, the broader fiscal picture remains challenging, as analysts are concluding.
Speaking at an event, Fed Governor Christopher Waller stated that the growing use of stablecoins could lead to faster and more affordable payments. "As a free-market capitalist economist, my goal is to see competition in the payments space lower costs for households, consumers, and businesses—plain and simple," he said. Waller also noted that while stablecoins might reduce the demand for physical U.S. currency, they could simultaneously strengthen overall demand for the U.S. dollar.
CRYPTO MARKET
This was a week for celebration for crypto enthusiasts. BTC not only reached the all time highest level, but this coin is on the road to $120K as it managed to reach level above the $118K. This was indeed another significant milestone for BTC to reach, while crypto enthusiasts are noting that the price could easily reach even higher values till the end of this year. What will be the case, is to be seen in the future. Total crypto market capitalization significantly gained during the week, ending the week total 10% higher from the week before, adding $330B of new funds. Daily trading volumes were more than doubled, with an average daily trading volume of around $300B. Total crypto market capitalization from the beginning of this year currently stands at 12%, with a total funds inflow of $380B.
The vast majority of crypto coins gained during the previous week, and managed to significantly increase their market capitalization. The most important coin which drove the market to the upside was BTC, with a surge in value of 8,6% on a weekly basis, adding a total amount of $185B to total crypto market capitalization. ETH also had an incredible week, surging, after a longer period of time, to levels above the $3K, adding 17,5% to its market cap with an inflow of $53B of funds. All major coins had a positive week. Solana was traded higher by 9,3%, adding $7B to its market cap. ADA ended the week higher by 22,6%, with an inflow of $4,6B. One of the unexpected significant gainers of the week was Stellar, with an incredible surge in value of 63,7%. DOGE gained 21%, Uniswap surged by 21%, Algorand was traded higher by 26%. Indeed one incredible week for all crypto coins with strong gains.
As on the spot market, there has also been higher activity when it comes to coins in circulation. It is not frequently seen that BTC has a weekly increase of circulating coins, as it was during the previous week, when the number of coins was increased by 0,1%. Stellar increased its value by an incredible 63,7%, but at the same time, it increased the number of coins on the market by 0,4% w/w. IOTA had a surge in coins on the market by 0,8%, while Filecoin added 0,4% of new coins on the market. Interestingly, this week, BNB decreased the number of circulating coins by 1,1%.
Crypto futures market
In line with the surge of the value of coins on the spot market, crypto futures also skyrocketed in value, reaching some of the all time highest values for long term maturities. BTC short term futures ended the week by more than 9% higher, while the longer term futures were up by more than 7%. Futures maturing in December this year reached the last price at $122.135. At the same time futures maturing in December 2026 reached the new all time highest level at $129.355. As per values of futures, the price of BTC has more space to reach higher grounds.
ETH futures also had an excellent week, surging by more than 20% for shorter maturities and above 16% for longer maturities. What is most important is that futures finally ended the week above the $3K levels. Futures maturing in December 2025 closed the week at $3.121 and those maturing a year later were last traded at $3.359.
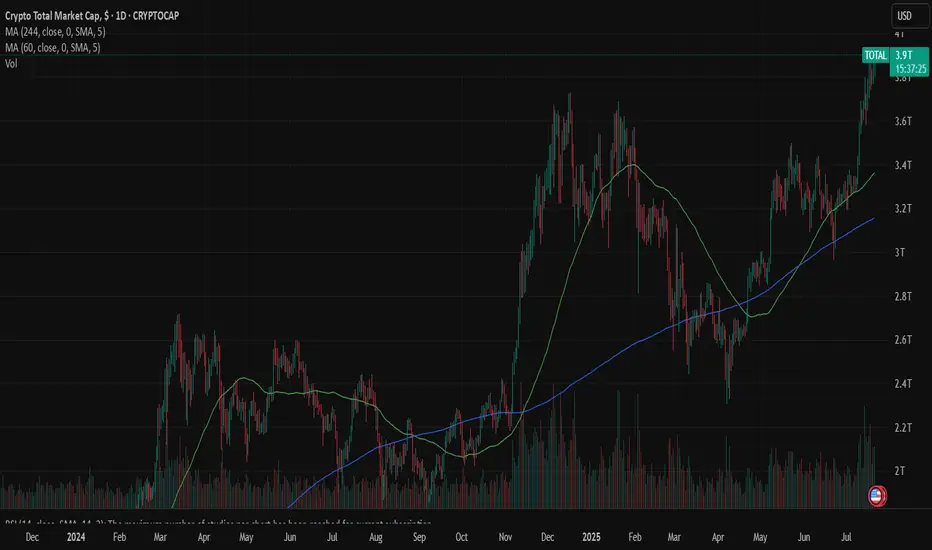
CRYPTO TOTAL MARKET CAP | Weekly Chart Analysis | Breakout in PrCRYPTO TOTAL MARKET CAP | Weekly Chart Analysis | Breakout in Progress
🔍 Let’s break down the crypto total market cap and highlight why the next move could be explosive.
⏳ Weekly Overview
The weekly chart shows a strong breakout above the consolidation box, following a classic fakeout to the downside. The 0.382 Fibonacci retracement level at $2.29T provided solid support, confirming the bullish structure and setting the stage for this move.
🔺 Bullish Scenario:
- The market faked out below the box, trapping bears, and is now breaking out above resistance.
- The breakout targets align with the Fibonacci extension, projecting a move toward the $5T region.
- This $5T target is not only a psychological level but also matches the next major Fibonacci confluence, adding further conviction to the bullish outlook.
📊 Key Highlights:
- 0.382 Fibonacci retracement ($2.29T) held as support during the fakeout.
- Breakout above the box signals renewed momentum and a shift in market sentiment.
- Upside target around $5T is supported by both the measured move and Fibonacci extensions.
- Previous resistance levels at $3.27T and $3.54T now act as support zones.
🚨 Conclusion:
Crypto is breaking out after a textbook fakeout and reclaim of the range. With confluence from Fibonacci targets and strong momentum, the $5T region is now firmly in play as the next major target. Watch for sustained closes above $3.54T to confirm the move and open the door for further upside
Total Market Cap Weekly Chart: Ready to Explode?Hey traders! Let’s dive into this weekly TOTAL Crypto Market Cap chart. The headline says it all— Total Market Cap Is About to Explode , and we’re here to break it down!
We’re seeing a massive expanding triangle formation, with the market cap currently at 3.21T , right at retest of triangle resistance. Historically, these patterns have led to parabolic moves — check out the 2019 - 2020 breakout! If history repeats, a breakout could send the market cap soaring toward 8.0T or even higher!
However, if the breakout fails, we might see a pullback to the previous level of support around 2T .
Key Levels to Watch:
Resistance: 3.66T (ATH)
Support: 2T
Breakout Target: 8.1T+
Breakdown Risk: 1.20T (latest strong resistance below 2.6T)
Is the market cap about to go parabolic, or are we in for a fakeout? Let’s hear your thoughts below!

MARKETS week ahead: July 6 – 12Last week in the news
The US jobs data posted during the previous week shaped investors sentiment. The jobs market seems resilient, making market participants diminish any expectations that the Fed might cut interest rates at July's FOMC meeting. In this sense, the 10Y Treasury yields adjusted from level of 4,2% to close the week at 4,33%. On the opposite side, strong jobs figures pushed the S&P 500 to reach all time highest levels for the last five days, closing the week at the level of 6.279. Weakening of the US Dollar supported the price of gold to end the week higher, at the level of $3.333. The crypto market had a volatile week, with BTC reaching the level of $110K, still, ending it at levels above the $108K.
This week was marked with US jobs data, exposing its further resilience. The JOLTs job openings ended May at 7.769M, which was higher from market anticipation of 7,3M. The posted unemployment rate for June was standing at 4,1%, slightly lower from 4,2% posted for the previous month. The data which mostly impacted market sentiment were related to the Non-farm Payrolls for June, with 147K new jobs. It was higher from the market estimate of 110K for the same period. A strong jobs market made an impact on investors to rethink the potential Fed's rate cut at July's FOMC meeting. Current expectations for September's rate cut were increased.
Trump's “big, beautiful bill”, proposing significant tax cuts, passed the U.S. Senate during the previous week, and is now back in the House for final approval. Analysts are still concerned regarding its effects on the US level of debt in the next 10 years period, currently estimating further broadening of the US debt by $3,7 trillion.
Although the last two weeks passed with increased optimism on US equity markets, still both analysts and investors are closely watching developments with trade tariffs deals by the US Administration. Last week, the US made a deal with Vietnam of 20% tariffs for imports from Vietnam, while the US goods will be tariff-free. However, the next week will be important from the perspective of the end of a 90-days delayed tariffs period, which the US Administration left for the majority of countries around the world, leaving them the space for negotiations. Talks with major US trade partners are still ongoing, including China, European Union, Japan and India.
News is reporting that the ECB will most likely wait for the September meeting to further cut interest rates on Euro. The reason for such expectations are mentioned uncertainties regarding the trade agreement with the US Administration. Economists are also noting this year`s surge of Euro against US Dollar of 14%, which might add an additional burden on the EU economy in addition to trade tariffs.
CRYPTO MARKET
Another volatile week on the crypto market passed. The positive market sentiment was under influence of better than expected US jobs data posted for June. The BTC reached the level of $110K on Wednesday, but still, ending the week lower. Majority of other cons peaked during the week, but are still ending the week lower. On a weekly basis, there has been almost an equal number of gainers and losers among crypto coins. Total market capitalization gained 1% for the week, adding $24B to its total cap. Daily trading volumes remained relatively flat during the week, moving around $153B on a daily basis. Total crypto market capitalization from the beginning of this year currently stands at 2%, with a total funds inflow of $50B.
The largest coin was moving the market during the previous week. BTC closed the week by 0,7% higher on a weekly basis, adding $15B to its total cap. This week ETH also managed to close it 2,7% higher, increasing its market cap by $7,9B. Market favourite Solana had a significant surge during the week, till the level of $159, however, it is ending the week above the $146, marking the weekly loss of 2,9%, or $2,3B outflow of funds. DOGE had a similar movement, but ending the week with a modest loss of 0,5%. ADA managed to sustain its weekly gains, ending it at 1,8% higher. Uniswap had a drop in value of 2,7% while Maker lost almost 5% in value.
Although market prices of crypto coins had a relatively volatile week, still when it comes to circulating coins, the situation was much calmer. Stellar had the highest weekly decrease of the number of coins on the market , of 1%. Such withdrawals are not frequent with this coin. Filecoin traditionally is increasing the number of coins on the market, with this week's increase of 0,3%.
Crypto futures market
Crypto futures also reacted to a positive investor sentiment, where both BTC and ETH futures ended the week higher. BTC short term futures had a modest increase of some 0,7%, while the longer term ones closed the week higher by 2,6%. Futures maturing in December this year ended the week at the level of $113.750, and those maturing a year later were last traded at $120.395.
Similar development was also with ETH futures, where short term ones closed the week by 2,9% higher, and longer term ones surged by more than 7% on a weekly basis. ETH futures maturing in December 2025 were last traded at $2.689. Futures maturing in December 2026 closed the week at $2.894.

USDT.D Showing Signs of Bounce – Altseason at Risk?USDT Dominance is still moving within a rising parallel channel, holding just above the nearest support zone. After a brief dip, price is now showing signs of recovery from the lower boundary of the channel.
However, the key resistance zone near the top of the channel has proven tough to break — it rejected price on the last attempt.
Until we get a clear breakout or breakdown from this channel structure, the market may remain choppy. A breakout above 5.00% could signal risk-off sentiment (bad for alts), while a drop below the support zone may trigger altcoin momentum.
Stay cautious — the market is still undecided.

MARKETS week ahead: June 30 – July 7 Last week in the news
The news regarding a deal settlement on trade tariffs between the U.S. and China, brought some relief on financial markets during the previous week. The most significant weekly gainer was the US equity market, where the S&P 500 reached a fresh, new all time highest level at 6.185. On the same grounds, the price of gold turned into a correction, with a weekly drop of 2%, reaching the level of $3.273. A further easing of inflation in the U.S. impacted 10Y Treasury yields to ease down to the level of 4,27%. The crypto market managed to sustain upper grounds during the week, with BTC holding above the $107K.
The information which occupied the market's attention during the previous week, was that the US Administration and China managed to settle a trade tariffs deal. Although the details of a deal have not been publicly disclosed, still, the market reacted in a positive manner, bringing the US equity market to higher grounds. The posted macro data showed further ease in the US inflation. Fed's favourite inflation gauge, the PCE index reached 0,1% in May, bringing it to the level of 2,3% on a yearly basis. The core PCE remains elevated, with 0,2% in May and 2,7% for the year. Still, all figures were in the line with market expectations, increasing odds that the Fed might cut interest rates in September.
Weekly tariffs news include the discontinuation of trade negotiations with Canada. As the U.S. President posted on social media, the termination of negotiation is immediate, and the US will decide on the level of tariffs within the next five days. Such a decision came after Canada decided to impose a digital services tax on US tech companies.
CNBC is reporting that Coinbase is the best performing stock in June, with a surge of 43% only during this month. As the reason for such a strong price movement analysts are noting several combined reasons, like its inclusion into S&P 500 index, the GENIUS Act which was passed in the Senate and a strong performance of Circle.
Fed Chair Powell was for one more time a topic of the US President answering the journalists questions. The US President commented that he will put as the head of the Fed anyone who will support the rate cuts. He also noted that there are several candidates for this place, not explicitly mentioning names.
There has been a discussion among analysts whether stablecoins represent a threat to payment card business, concretely to Visa and Mastercard. The one alternative for these companies to sustain the market game is to issue their own stable coins which could function on a prepaid basis. However, a few services which are currently not provided by stablecoins, like buy now - pay later are still advantageous to card issuers.
CRYPTO MARKET
It was a week of ups and downs on the crypto market, however, the week ended in a positive territory. The US-China deal on trade tariffs brought some relaxation among investors, which was also reflected in a crypto market. Total crypto market capitalization gained 4% during the week, where major crypto coins are participating with 70% in total funds inflow of $130B. Daily trading volumes were slightly decreased to the level of $146B on a daily basis from $187B traded a week before. Total crypto market capitalization from the beginning of this year currently stands at 1%, with a total funds inflow of $26B.
The major coins on the market were the ones which mostly supported an increase in a weekly capitalization of the crypto market. BTC managed to add $87B to its market cap, increasing it by more than 4% on a weekly basis. Second place took Solana this week, with an inflow of $7,2B, where its market cap surged by almost 10%. XRP had a strong funds inflow of $5,8B, or 4,7%, while ETH collected $5B which was an increase of 1,8% for this coin. BNB was moving within a modest territory, with a weekly surge of 2% adding almost $2B to its market cap.
It was an active week also when it comes to coins in circulation. This week both Solana and Polkadot had an increase of the number of coins on the market of 0,6%. At the same time IOTA increased its number of coins by 0,8%. Although it is a stablecoin, it is worth mentioning that Tether is continuously increasing the number of its coins, which surged by 1% last week. This could be treated as an indicator of increasing popularity of stablecoins during the recent period.
Crypto futures market
The crypto futures market ended the week in alignment with the spot market developments. BTC futures were closed above 3% higher from the end of the previous week. Futures maturing in December this year were closed at $110.680, and those maturing a year later were last traded at $117.270. On a positive side is that the long term futures are slowly nearing the historically highest level of $124K reached in January this year.
ETH futures were traded relatively flat compared to the week before. Futures maturing in December 2025 closed the week at $2.514, and those maturing in December 2026 achieved the last price at $2.703.

MARKETS week ahead: June 23 – 29Last week in the news
Geopolitical tensions, the FOMC meeting and inflation fears could be the summary of topics for the previous week. Markets are currently in a sort of limbo phase, not sure what direction to trade, considering high uncertainties which are surrounding financial markets. The S&P 500 tried to be positive at the beginning of the week, but ended it lower, at the level of 5.967. The US Dollar was traded in a mixed manner, but the price of gold took a bit of a relaxing trend, closing the week at the level of $3.371. The 10Y yields reacted to the Fed's narrative around interest rates and closed the week lower, at the level of 4,37%. The crypto market was also traded in a mixed manner, but more toward the downside, where BTC closed the week lower, at the level modestly above the $103K.
The main event of the previous week was the FOMC meeting. The Fed kept interest rates unchanged, as widely expected. The Fed stays on the course of two rate cuts during the course of this year. Once again it has been noted that “uncertainty about the economic outlook has diminished but remains elevated”. The uncertainty mostly relates to the effects of the implemented trade tariffs on the U.S. economy in the future period. Possibility of higher inflation is also noted. With that respect, the Fed will stay data-dependent when deciding over the future course of interest rates.
Based on official comments, it seems that the FOMC members are not united when it comes to the final decision regarding the cut of interest rates. During the previous week, Fed Governor Waller noted in an interview that the Fed might make the first rate cut in July, considering the current inflation level and jobs market. On the opposite side was San Francisco President Mary Daly, who stated that some more confidence is needed that the trade tariffs would not make a significant impact on inflation, before the next rate cut.
As news is reporting, Tesla has signed an agreement with China to build a grid-scale battery power plant in China. As noted, it is going to be the largest project in China that Tesla is going to conduct, with an estimated worth of $556M.
Coinbase announced that the company had secured a Markets in Crypto Assets or MiCA license from Luxembourg authorities, based on which it will be able to offer crypto services to clients in the EU. With this license, the company also noted that their central hub in the European Union will be in Luxembourg, instead of Ireland, as previously planned.
The Swiss National Bank cut rates by 25 bps to 0% during the previous week. The decision was made after the country was struggling to sustain the inflation growth, entering into deflation in May. The inflation in Switzerland peaked at 3,5% in August 2022, and since then is on a deflationary road.
CRYPTO MARKET
There have been a lot of topics for investors during the previous week, including geopolitics and macroeconomics, which left the crypto market a bit behind the traditional markets. Although during the first half of the week, crypto coins were traded in a mixed manner, still, the weekend brought some major pulls toward the weekly negative zone. Total crypto market capitalization dropped by 3% on a weekly level, dragging down $84B in the value of the market. At the same time, daily trading volumes remained relatively flat on a weekly basis, moving around $187B. Total crypto market capitalization currently stands at the negative territory of -3%, compared to the end of the previous year, with a total outflow of $104B.
For one more time BTC was pushing the total market cap to the downside, with an outflow of $38B, decreasing its value by 1,8% for the week. ETH was also traded in a negative territory, down by 4,8% on a weekly basis, with an outflow of $14,6B. The majority of other coins traded in red for the week, where DOGE was down by 10,1%, Cardano dropped by 9,1%, ZCash lost 9,8% in value. Market favorite coins had a relatively modest weekly drop as BNB ended the week by 1,3% lower and Solana was down by 3,2%. Only a few altcoins ended the week in shiny green, like Tron, which was higher my modest 1% or EOS with a plus of 1,7% for the week.
This week Solana managed to add new coins on the market, increasing its total number by 0,7%. Such a strong increase is not very frequent with Solana. On the other hand, a total surprise came from LINK, who added 3,2% of new coins to the market. Filecoin traditionally increases its circulating coins on a weekly basis, adding 0,2% new coins for this week.
Crypto futures market
The crypto futures market reflected developments from the spot market. Both BTC and ETH futures ended the week lower from the week before. BTC futures ended the week by 1,8% lower, while ETH futures were last traded around 4,5%.
BTC futures maturing in December this year reached the last price at $107.345, and those maturing a year later at $113.520. The good news is that BTC long term futures are still holding above the $100K level, exposing the investors anticipation regarding future potential of BTC.
ETH futures maturing in December this year closed the week at $2.525, and those maturing in December 2026 at $2.710.

MARKETS week ahead: June 15 – 21Last week in the news
Newly emerged tensions in the Middle East impact market sentiment as of the end of the previous week. The US equity markets reacted in a negative manner, bringing the S&P 500 down by more than 1%. The US Treasury yields started their relaxation during the week, however, reversed on Friday back to the level of 4,4%. The US Dollar lost in value, however, the demand for safe-haven assets pushed the price of gold more than 1,4% higher, ending the week at the level of $3.443. The BTC had a rollercoaster week, with highs at $110K, but is ending the week above the $104K level.
The previous week started in a promising sentiment. The US May inflation data was posted, indicating a clear down trend. The inflation in May reached the level of 0,1%, bringing it to the level of 2,3% compared to the previous year. Core inflation was also standing at 0,1%, while both figures were slightly better from market estimates. The week-end brought the University of Michigan Consumer Sentiment preliminary for June, where inflation expectations were also decreased. Yearly inflation expectations significantly dropped to the level of 5,1% from 6,6% posted for the end of May. The five year inflation expectations were also decreased from 4,2% to 4,1%.
The inflation data supported market expectations that the Fed will hold interest rates unchanged at their meeting in June, but increased odds for the next cut in September. The FOMC meeting is scheduled for June 18th, together with macro projections. Analysts are pointing that the macro projections will be in the spotlight of investors, as they are still trying to wage the total impact of the imposed trade tariffs. At their May meeting, it has been shortly noted by Fed Chair Powell that the risks of both higher inflation and unemployment had risen. As data are showing that the inflation is slowing down, the increasing unemployment might impact the Fed to cut interest rates in order to fulfil their dual mandate.
The new unrest in the Middle East is another topic that puts concerns among investors. Seeking safe-haven assets, the price of gold gained 1,4%, only on Friday trading. The investors are also concerned that the surging prices of oil, due to the crisis, might spillover to the US inflation figures in the coming period. Although the US at present moment, is not highly exposed to the volatility of oil prices on world markets, still, analysts are pointing to the effect which might come from increased commodity prices, as a consequence of surged oil prices. This will be another topic closely watched at the FOMC press conference on Wednesday.
Interesting news came from Sweden. As Reuters was reporting, the Swedish pension fund AP7 blacklisted shares of Tesla and sold the whole stake. As announced by the fund “ AP7 has decided to blacklist Tesla due to verified violations of labor rights in the United States”. Nevertheless, shares of TSLA gained 1,94% in Friday's trading session.
CRYPTO MARKET
The rollercoaster on the crypto market was evident during the previous week. The newly emerged Mid-East crisis left its market also on a crypto market. The coins were traded in a mixed manner, but ended the week in a negative territory. On the other side were a few coins which managed to end the week in green. Total crypto market capitalization decreased by 1% on a weekly basis, losing around $22B from the market cap. Daily trading volumes were relatively flat compared to the week before, moving around the $185B on a daily basis. Total crypto market capitalization once again entered into the negative territory from the beginning of this year, currently standing at minus 1%, with a total outflow of $20B.
BTC ended the week flat from the end of the previous week, although the price of coin at one moment reached the level of $110K at the beginning of the week. ETH managed to gain 1% in value, adding $3B to its total capitalisation. Other gainers among altcoins were Uniswap with a surge in value of 17,3% and Maker, with an increase in value of 23% on a weekly basis. The major coins on the market were traded with a negative sentiment. Market favorite Solana ended the week by 4,7% lower from the week before, losing $3,75B in its cap. BNB was modestly down by 1%, while DOGE decreased its value by 4%.
Although Solana was traded with a negative sentiment, still, the coin managed to increase its total coins in circulation by 0,5%. This week IOTA had a stronger increase of total number of coins on the market by 0,8%. The majority of other altcoins had an increase of coins in circulation by 0,1% w/w.
Crypto futures market
The latest drop in the value of BTC and ETH was not reflected in the prices of crypto futures as of the end of the week. BTC futures ended the week higher by around 0,6% for all maturities, while ETH futures had an increase of around 1,5% on a weekly basis.
BTC futures maturing in December this year closed the week at $109.390 and those maturing a year later were last traded at $115.590. At the same time ETH futures with maturity in December this year closed the week at $2.637, and those maturing in December 2026 were last traded at $2.838.

Bitcoin B-Wave Trap? Major C-Wave Down Correction Incoming!Bitcoin’s recent bounce has all the signs of a classic B-wave in an ABC corrective structure. After the impulsive A-wave down from the highs, this current rally appears more like a corrective relief move rather than the start of a new bullish impulse. Volume remains weak and the structure looks choppy — not the kind of strength you’d expect from a sustainable uptrend.
I believe we are now completing the B-wave, luring in late bulls before the real drop — the C-wave — begins. This next leg down could be sharp and painful, targeting key support zones and possibly wiping out the complacency that’s built up in the market.
🧠 Watch for signs of exhaustion in this rally.
📉 Potential C-wave targets: 98k 97k
⏳ Timing and structure suggest we’re close to the turning point.
Stay cautious. This could be the calm before the real storm.
---

MARKETS week ahead: June 8 – 14Last week in the news
The first trading week in June started with surprisingly better than expected US jobs data, which influenced some positivity in investors sentiment. The US equity markets gained during the week, with S&P 500 heading again toward levels above the 6K. The US Dollar also modestly gained on Friday, pushing the price of gold to the lower ground, ending the week at the level of $3.309. The US 10Y Treasury benchmark also had a strong reaction on the US jobs data, surging to the level of 4,5% on Friday. The crypto market was traded in a mixed manner, however, BTC managed to hold the $105K level as of the end of the week.
Previous week was marked with the US jobs data, which the market closely watched. At the start of the week JOLTs job openings in April were posted, with a modestly higher figure than anticipated. Jobs openings reached 7,391M, while the market was expecting to see the figure of 7,1M. However, the major data were posted on Friday, impacting the positive market sentiment. The Non-farm payrolls in May added 139K new jobs, while the market estimate was at the lower grounds, around 130K. The market reaction was positive for the equity market, however, it pushed US Treasury yields to higher grounds. Investors are not anticipating that the Fed might hold interest rates at current levels for a longer period of time, than previously anticipated. The CME FedWatch tool is currently estimating odds of 100% that the Fed will hold interest rates steady at their June meeting.
On the opposite side from US investors' sentiment was the European Central Bank, which cut interest rates for the eighth time this year by 25 basis points. The ECB reference rate currently stands at 2%, at the same level where yearly inflation in the Euro Zone stood in May. The ECB currently sees reference interest rate at neutral level. At the same time, ECB commented that the next move will be data-driven, in which sense, neither the ECB nor markets could perceive when and what will be the next ECB move. ECB President Lagarde commented that the US tariffs would hurt EuroZone growth, but extra government spending on defence would bring some positive effects to the economy. The ECB also lowered the inflation forecast for this year and next, while its growth projections remained unchanged. The inflation forecast for this year stands at 2% from 2,3% previously, and at 1,6% in 2026.
Since tariffs are the major headline news, some new information from the previous week includes continuation of negotiations between US and China in London in a week ahead. The US President announced that China agreed to let some rare minerals flow from China to the US. At the same time, Reuters posted that the China central bank bought gold on the market for the seventh consecutive month in May, increasing further its gold reserves.
Another event that spotted market attention was a dispute between the US President and his ally Elon Musk over the “big, beautiful” tax bill which is to be adopted in the US, including significant tax cuts. Musk commented on social networks that this bill will add $36,2 billion new debt to the US balances, which could further hurt the sustainability of the US debt. The shares of Musk's company Tesla dropped by 14% on the news, however, modestly recovered as of the end of the week.
CRYPTO MARKET
During the previous week the crypto market continued with consolidation, after reaching the new highs two weeks ago, especially concerning the BTC price moves. Although the market traded in a modestly negative sentiment during the week, Friday's US jobs data, which was better than expected, also pushed the crypto market to cover some of the weekly losses. Total crypto market capitalization remained flat on a weekly level, with a modest weekly funds outflow of $8B. Daily trading volumes also eased to the level of $194B on a daily basis, from previous weeks $234B. Total crypto market capitalization increase from the beginning of this year, currently stands at 0%, with an inflow of funds of around $2B.
The crypto market was traded in a mixed manner during the previous week. The leader of the market, BTC, was initially traded toward the downside, but managed to end a week flat, with a small funds inflow of $6B. On the opposite side was ETH, which lost less than 2% in the market value, decreasing its cap by $5,9B. Major crypto coins were also traded with a negative sentiment, but with relatively small weekly loss. In this group is BNB, with a weekly drop in value of 1,6%, Solana was down by 2,8%, ZCash was down by 3,7%. DOGE was down by 5% on a weekly basis, due to a dispute between the US President and his ally Elon Musk, a promoter of DOGE. Few coins which ended the week in green were Maker, which surged by 7,5%, Tron was traded higher by 4,4% and OMG Network ended the week higher by 3,4%.
There have been some interesting developments when circulating coins are in question. Namely, during the previous week BTC increased the number of coins on the market by 0,1%. Such a situation is extremely rare on the market, which is why it deserves attention. At the same time, Solana also had an increase in circulating coins by 0,6% while the number of coins of EOS were higher by 0,5% w/w.
Crypto futures market
In line with the consolidation on the spot market, the crypto futures eased during the previous week. BTC futures were traded modestly down by 0,3%, which could be treated as a flat weekly trading. Futures maturing in December this year closed the week at $108.695, and those maturing a year later, were last traded at $114.860.
ETH futures had a higher drop of around 3,5% for all maturities. ETH futures ending in December 2025 closed the week at $2.597, and those maturing in December 2026 were last traded at $2.795.

TOTAL2 – Altcoin Market Cap (Weekly TF) 2025
**Summary:**
The TOTAL2 chart (crypto market cap excluding BTC) is showing a structurally bullish formation after a deep retracement and a higher low confirmation. This setup suggests a potential multi-phase rally toward 2.98T and beyond, with defined support zones and Fibonacci targets aligned with liquidity cycles. This analysis visualizes the expected roadmap based on trend-based Fibonacci extensions, retracement levels, and psychological market phases. Notably, the outlook includes the possibility of an initial correction to retest strong support zones before the market begins its ascent.
**Chart Context:**
TOTAL2 represents the aggregated market capitalization of all crypto assets excluding Bitcoin. Historically, it reflects capital rotation into altcoins, especially following BTC dominance peaks. The current chart shows strong reaccumulation above the 1T support zone, with Fibonacci confluences hinting at a sustained recovery pattern. Dotted arrows illustrate a wave-like projection of accumulation, rally, retracement, and expansion. The possibility of a near-term correction to lower support zones is also embedded in the path structure.
**Key Technical Observations: and Levels**
TP1 = 1.78T
TP2 = 2.05T
TP3 = 2.4T
TP4 = 2.85T
* **Secondary Fib Retracement :** 0% = 1.23T, 100% = 425.89B
* Key zones: 23.6% = 1.04T, 38.2% = \~840.42B, 61.8% = \~569.41B
Possible Support Levels: 1.04T, 930B, 840B, 766B, 735B,
* **Trend-Based Fib (A-B-C):** A = \~420B, B = \~1.23T, C = \~735B
* This projection aligns with TP1 at 1.78T
* **Support Area:** Around 1T psychological zone (930B)
* **Strong Support Zone:** 735 Bto775B
* **First Target Zone:** Between 1.73T and 1.89T (early resistance + Fib cluster)
**Indicators:**
* Weekly structure forming higher lows
* Long-term Fib retracements respected
* Trend-Based Extension projecting 1.618 move
* No divergence, confirming strength
**Fundamental Context:**
* Liquidity conditions are improving globally with rate cuts expected into late 2025.
* ETH and ecosystem tokens are likely to lead altcoin recovery.
* Regulatory clarity and ETF flows add legitimacy to broader crypto allocations.
* Historical alt-seasons emerge from BTC profit rotation—TOTAL2 leads that shift.
* However, several macro risks may trigger a correction before rallying:
* The Crypto Fear & Greed Index is currently high, suggesting overbought conditions.
* Macroeconomic uncertainties (e.g., inflation, rate hike fears) can suppress short-term risk appetite.
* Regulatory tightening across major jurisdictions introduces hesitation in capital deployment.
* Technical signs of a five-wave drop in BTC hint at a larger ABC correction scenario.
* DAT (Digital Asset Treasury) exposure among public firms may lead to forced liquidations during downturns.
**Philosophical or Narrative View:**
This is not just a market cycle—it's a reflection of decentralized innovation reclaiming narrative dominance. After fear-induced lows, TOTAL2's rise echoes the resilience of builders, protocols, and investor conviction. Each Fibonacci level acts like a checkpoint in the unfolding story of crypto's evolution beyond Bitcoin.
**Related Reference Charts:**
*
**Bias & Strategy Implication:**
* **Bias:** Bullish with short-term corrective risk
* **Accumulation Zone:** 1.0T–1.23T
* **Initial Risk:** Price may revisit the **Support Area (1T)** or even the **Strong Support Zone (775B–725B)** before a sustained move higher.
* **Partial TP:** 1.78T–2.05T
* **Extended TP:** 2.4T–2.98T
* Caution near TP4–Bonus zones as distribution risk increases
* Invalidated if closes below 725B (structure break)
**Notes & Disclaimers:**
This is a structural macro outlook and not financial advice. Markets are dynamic and subject to rapid shifts in sentiment, liquidity, and regulation. Always use risk management.

ONDO Finance Potential Bullish Breakout OpportunityONDO Finance seems to exhibit signs of overall potential Bullish momentum if the price action forms a prominent Higher High with multiple confluences through key Fibonacci and Support levels which presents us with a potential long opportunity.
Trade Plan:
Entry : 1.3
Stop Loss : 0.47
TP 1 : 2.13

RENDER Potential Bullish Breakout OpportunityRENDER seems to exhibit signs of overall potential Bullish momentum if the price action forms a prominent Higher High with multiple confluences through key Fibonacci and Support levels which presents us with a potential long opportunity.
Trade Plan:
Entry : 5.8
Stop Loss : 2.2
TP 1 : 9.4
