$BTC Consolidating Before the Next Big Move?CRYPTOCAP:BTC consolidating after a strong bounce!
Bitcoin is holding well above the 106K support zone and forming a tight range just below resistance.
After a false breakout above 100K, the price is compressing just below key resistance at 108100.
This consolidation between 106500 and 108100 looks like a pause, not a top.
If BTC breaks 108100, the next targets are 110500 and ATH.
Market structure is still bullish.
A retest of 106500–105650 is possible before liftoff.
Are you positioned for the breakout?
If you find my updates helpful, don’t forget to like and follow for more!
DYOR, NFA
#BitcoinRecovery
Cryptomojo_ta

$PNUT in Freefall – Can $0.20 Hold as Support?$PNUT is dropping like a falling knife!🚨
Technically, we have support around $0.22 and $0.20.
According to the Fibonacci levels, the 0.786 level may
act as strong support near $0.20, making that area a key zone to watch.
So unless this support range is reached, the price may continue to drop toward that zone.
If you're currently stuck in this coin, you could consider adding funds and setting your liquidation point below $0.18 for safety.
If you're looking to enter or accumulate, the range between $0.22 and $0.20 is ideal for accumulation.
However, even with these support levels, we still need to wait for clear reversal patterns before expecting a trend reversal in the shorter time frame.
Thank you so much for reading, I hope my updates help you in your trading journey.
DYOR, NFA

No Change in Plan! $BTC Targeting Major Liquidation ZoneAs I warned you guys, CRYPTOCAP:BTC came down to the $100K exactly as expected, and then we bounced from the $100K level!
That lower trendline once again acted as strong support, just as expected.
Now #Bitcoin is pushing back up toward the major trendline and eyeing the $107K–$112K zone, which holds large liquidations.
No changes in the game plan, watching the daily and weekly closes closely.
If Bitcoin breaks above this trendline clearly, we could see a strong move up. 🚀
I’ll keep you posted as things unfold. If you find my updates helpful, don’t forget to like and follow for more!
$GALA Holding Support – Breakout Coming?INDEX:GALA is holding strong above the trendline support and showing signs of a bounce.
The price is now approaching a key descending trendline a breakout here could lead to a solid move toward $0.021–$0.026 📈
As long as it stays above the trendline, bulls are in control.
#GALA #ALTSEASON

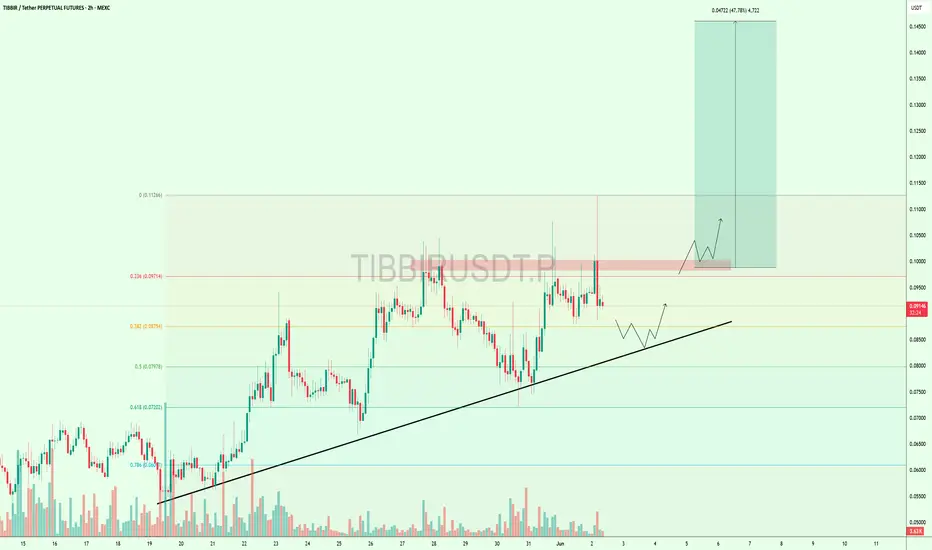
Price Cooling Off – But $TIBBIR Still Looks Bullish$TIBBIR is trying to break above the 0.097 resistance, but it hasn’t succeeded yet.
The price is now pulling back and might test the uptrend support line around 0.085–0.087. This area has helped the price bounce before.
If the support holds and price moves back up, we could see a strong move toward 0.1126 that’s nearly +47% higher.
Keep watching a breakout could come soon! 👀
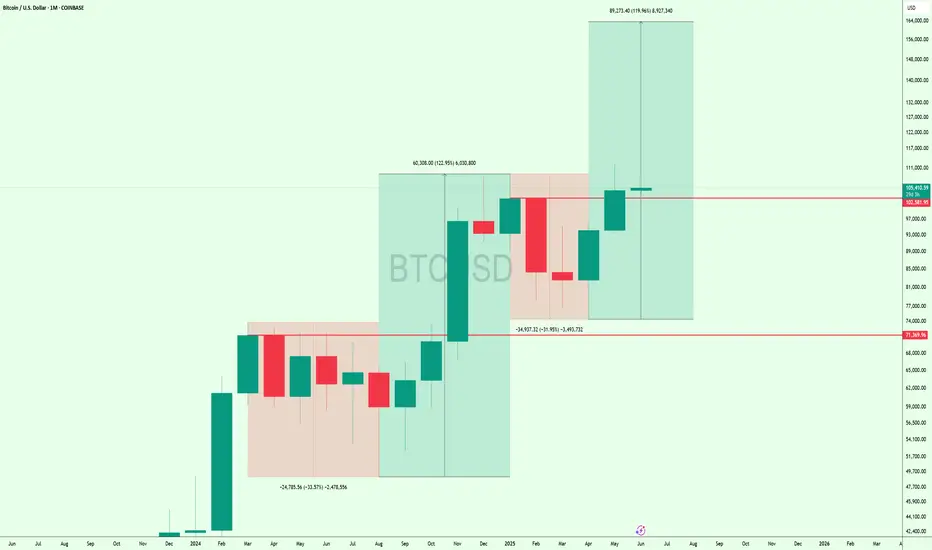
This Is Not a Top – It’s the Beginning of the Mega Bull RunThis is the monthly #Bitcoin chart, and honestly, how can anyone be bearish here?
CRYPTOCAP:BTC just bounced after a -31.95% correction and is now holding strong above the $101K breakout zone.
Last time, a similar setup led to a 122% pump... and this time, we could be looking at a move toward $160K that's 120% upside from here.
We’re likely entering the biggest bull market ever.
Get ready. 🚀
Using Previous Day’s High and Low to Decide Intraday TrendIntroduction and Disclaimer
This article explains how to use the daily chart to understand and plan for short-term or intraday market direction.
To fully understand this, you should already know what directional bias means. If you’re not familiar with it, I highly recommend reading my previous article on the topic before continuing here.
Disclaimer
I'm not a financial advisor.
This article does not offer financial, investment, legal, or any kind of regulated advice.
It's made for educational and entertainment purposes only.
Trading involves risk. You can lose all your money—or even more—if you’re not careful.
You're reading the thoughts of a 22-year-old.
The goal of this article is to show you how to use the previous day’s high and low on a daily chart to:
Get a clear intraday bias (bullish or bearish).
Find entry signals for your trades.
Set clear invalidation points, meaning when a trade idea becomes invalid.
This is part of what’s called multi-timeframe analysis—looking at higher time frames to understand what might happen on lower ones.
Even if you trade short-term (like on 5 or 15-minute charts), it's still helpful to know what the bigger picture (like the daily chart) looks like. Why? Because it shows the main trend, important levels, and key zones that may not appear on lower time frames.
In my opinion, smart trading involves breaking down the price chart from top to bottom—starting with the big picture—then making decisions based on your trading strategy.
The ideas in this article work well for:
Intraday traders who want to capture moves during the day, and
Swing traders who want to catch bigger moves by entering early.
This concept can also be applied to higher time frames, such as the previous week’s high and low.

Gold Holding Pattern – Key Resistance AheadHey, friends
On the 4-hour time frame, TVC:XAU is forming a symmetrical triangle pattern, but we haven’t seen any breakout yet, we’re still trading inside the triangle.
If we look at the LTF, we’re currently at the 0.236 FIB level, which isn’t a very strong buying zone, but technically, we’ve broken out of a falling wedge and are now retesting it.
That looks pretty good, and if this setup plays out well, we could see an upward move toward $3,470.
However, there’s a strong resistance around $3,350 to $3,370 that we need to break first. If we break that, it will also confirm the breakout of the symmetrical triangle from the 4-hour chart.
So keep an eye on those areas!
#GOLD #forextrading

USDT.D Forecast: Time to Buy the Dip?#USDT DOMINANCE
This is what I’d like to see happen in the next 2 days.
And I believe it will. Invalidation would be a close above 4.80%.
I’m buying the dip, guys. Let’s see how this plays out.

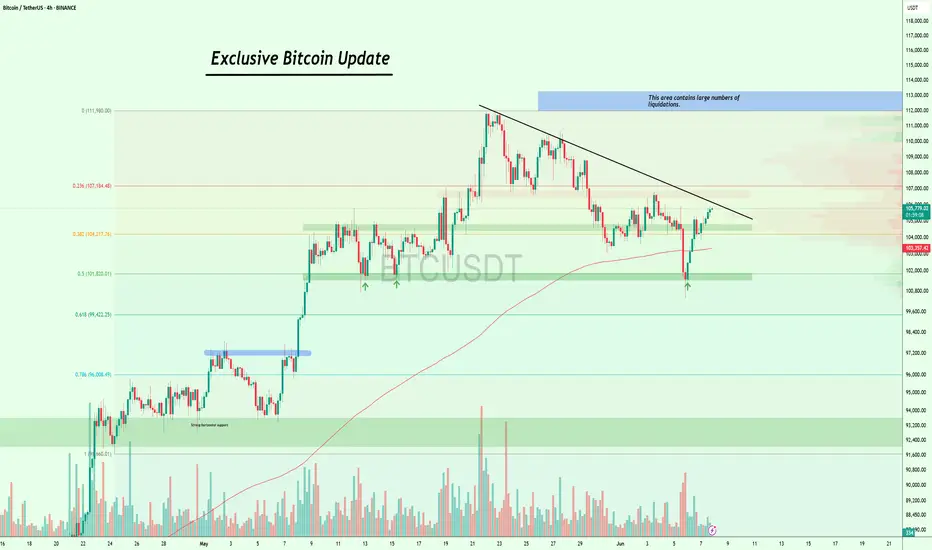
Bitcoin Correction or Trap? Watch This Support Zone CloselyExclusive #Bitcoin Update
I got lots of DMs, people are asking:
Do you think the bull trend is finished, or is it just a correction and pullback?
Guys, first stop panicking.
This is exactly what the shark wants you to do. Don’t let them shake you out.
Let’s get to the chart:
My previous chart got invalidated, and the current situation is that CRYPTOCAP:BTC is defending strongly around the $104.8K to $104.3K support zone.
According to the FIB level, we’re currently at the 0.383 level. This area has previously served as strong resistance, so it can now function as effective support.
If bulls manage to bounce from this area and push above $107K, we could trigger a sharp move toward the $112K–$113K liquidation zone,
where we have almost $12B in short liquidations acting as a strong magnet!
Let's talk about the worst-case scenario, in case we break down below this supportive area, then we have
200 EMA and a strong support around $101.4k to $101.8k.
I’ll keep you posted as things unfold. If you find my updates helpful, don’t forget to like and follow for more! #Bitcoin2025
CRYPTOCAP:BTC BITSTAMP:BTCUSD BINANCE:BTCUSDT

Altseason Isn’t Over – It’s Just Getting Started !!It’s not the end of #Altcoins this is just a small dip before the big move. 🚀
Right now, all EMAs (50, 100, 200) are sitting at the same level. This is acting as very strong support around the $1.12T zone.
Price has bounced from this area before, and if it holds again, we could see a big breakout toward $1.28T+.
Altseason isn’t over. It’s loading.
Be ready. 👀
#TOTAL2 #Altseason2025

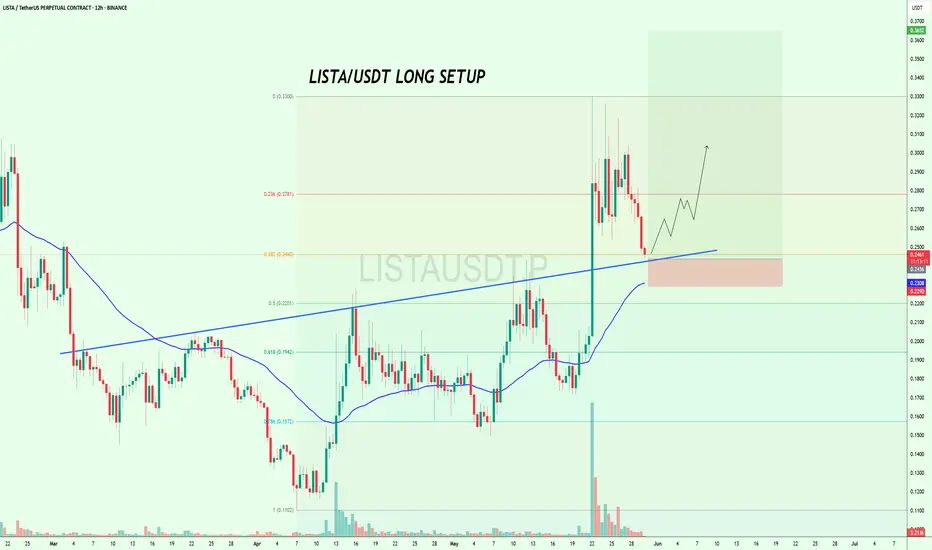
$LISTA at Key Support – Long Opportunity Loading?$LISTA looks good to long here with a short SL🚀
It is approaching a key confluence support zone right at the 0.382 Fib level (~0.2460), the rising trendline, and the 100EMA on the 12H chart.
This level held well in the last move and could once again act as the launchpad for a bullish breakout toward $0.30–$0.33.
But if it breaks below this support zone, short-term momentum could shift.
Watch how the price reacts here👀
BINANCE:LISTAUSDT
$BUSDT Ready to Explode? Breakout Could Send It Flying#BUSDT is demonstrating strong potential for a pennant breakout.
A successful breakout could trigger a +60% bullish rally in the coming days. 🚀
#Altseason2025

$XAUUSD Holding Key Support – Bounce Incoming?OANDA:XAUUSD is holding firm at the short-term support zone around $3,290–$3,295. This zone also aligns with the 200 EMA, adding strength to the current level.
Price previously flipped this resistance into support, now acting as a solid demand zone.
If we hold here, a potential push toward $3,330–$3,360 could follow.
Sellers remain active near the upper range, so monitor reactions closely.
DYOR,NFA
OANDA:XAUUSD TVC:XAU

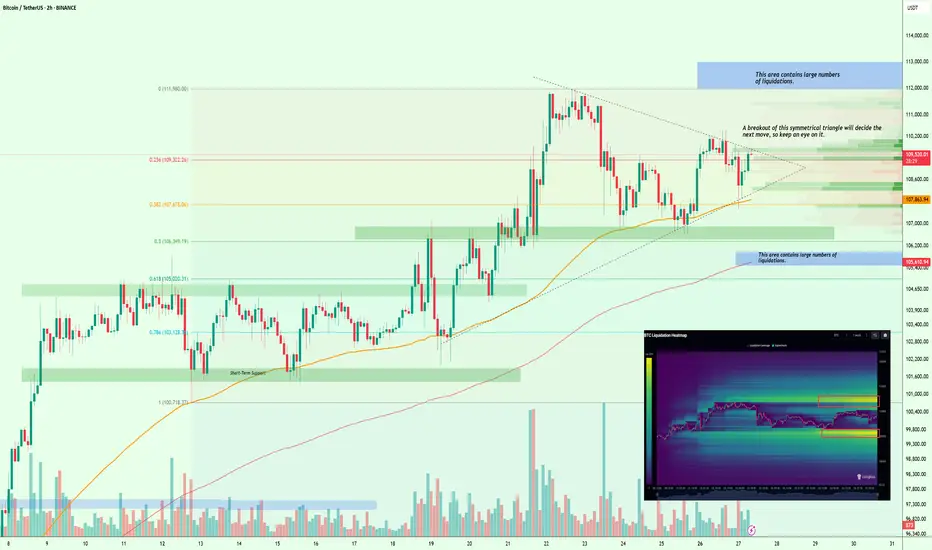
$BTC Liquidity Squeeze Incoming – Breakout or Breakdown?#Bitcoin
According to the liquidation heat map, CRYPTOCAP:BTC is building a large cluster of liquidations on both the upside and downside, creating some confusion in the market. However, the nearest major liquidation zone is around $112K–$113K, which increases the chances of a move toward that range.
Technically, BTC is forming a symmetrical triangle, and the breakout from this pattern will likely determine the next major move.
So keep a close eye on it.
I’ll keep you posted as things unfold.
If you find my updates helpful, don’t forget to like and follow for more!
$EGLD Gearing Up for Next Leg – Bull Flag in PlayCRYPTOCAP:EGLD is forming a clean bull flag on the 6H chart after a strong move up.
Price is holding the trendline, and a breakout above $19.7 could target $27 that’s a 47% potential move.
This setup appears solid, incorporating confluence from Fib levels and volume zones.
Eyes on this breakout that could be explosive.
Flag breakout incoming?
DYOR, NFA.
#EGLDUSDT #Altseason2025

$AXIBT Breakout Confirmed – 2x Potential Ahead?$AXIBT just broke above a key accumulation zone after days of consolidation.🚀
Strong volume, bullish Ichimoku support, and a clean breakout above resistance suggest this could be the start of a major move.
If this rally continues, we could see a sharp push toward the $0.50+ zone, nearly 2x from here.
Reclaiming and holding above the $0.22–$0.24 zone is crucial for confirmation.
Eyes on this one.

$RWA Breakout Alert – Trend Reversal in Play?LSE:RWA just broke out of a falling channel with strong volume — signaling a potential trend reversal.
It’s now retesting the breakout zone near the 0.382–0.5 Fib level, which could act as a support area before the next leg up.
If this reclaim holds, upside targets extend toward $0.017+—a 40%+ move from here.
Keep it on your radar.
DYOR, NFA.

$PENGU Approaching Apex – Breakout Watch On!CSECY:PENGU is forming a symmetrical triangle on the 4H chart, and price is getting close to the apex.
It’s currently holding above the support trendline and the 200 EMA a key zone to watch.
A breakout above the triangle could push the price toward the $0.022–$0.023 range.
I’m watching closely. If it breaks out with strong volume, it could be a solid setup.
Use a tight stop-loss and manage your risk properly.

$BEAM Coiling Up in the Golden Zone – Breakout Incoming?NASDAQ:BEAM is consolidating inside a symmetrical triangle, right near the 0.5–0.618 Fib golden pocket a zone where strong moves often begin.
It’s a clean setup with a good risk-reward and a clear stop-loss.
Keeping this on watch and accumulating inside the pattern, a breakout could push the price toward $0.009 or higher.
DYOR, NFA

$NXPC Rebounding from Golden Zone!!$NXPC
Based on the Fib retracement, the price is currently sitting in the golden zone between 0.5–0.618 levels a common area for strong bounces.
Also, the price is reacting well near the demand zone, and a small falling wedge has just broken out.
This setup offers a clean risk-reward with tight invalidation.
I’m keeping a close eye on it could be a solid opportunity if momentum builds.

$FET has formed an ascending triangle pattern!NYSE:FET has formed an ascending triangle pattern!
After getting rejected from the $0.93–$0.95 resistance zone, price pulled back but it's holding above this lower trend-line support and this 100EMA.
If this support holds, we could see a move back toward the resistance zone, and maybe even a breakout above it.
DYOR, NFA
