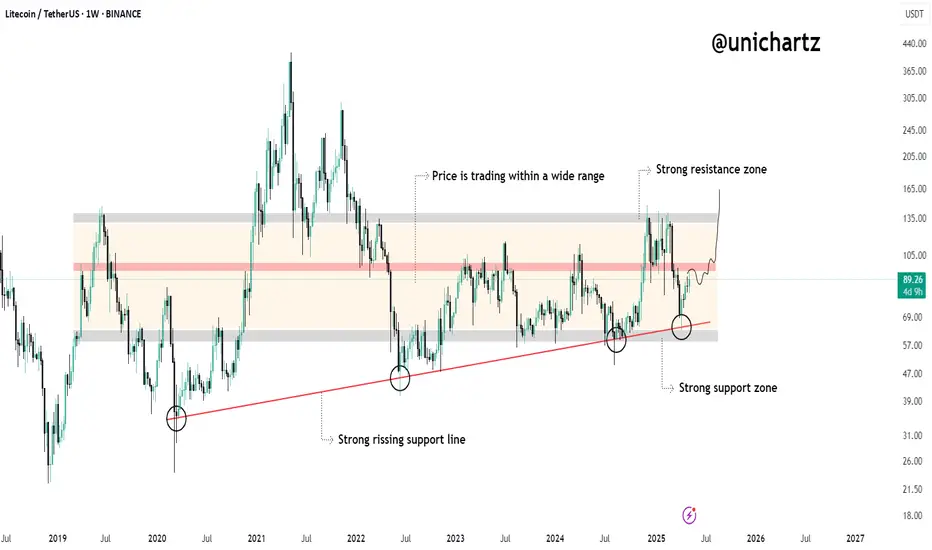
Is $LTC Lining Up for a Breakout Move?LTCUSDT is moving inside a wide range that's been respected for over 3 years — with price bouncing between a strong support zone ($50–$60) and a strong resistance zone ($130–$145).
Key Highlights:
Strong Support Zone:
Price recently bounced off a long-term horizontal support area near $60 — the same zone that sparked multiple rallies in the past.
Rising Trendline:
A clean, rising diagonal support has held since 2020 — each retest has led to upward momentum. The latest bounce confirms this structure is still valid.
Current Structure:
Price is climbing from the base of the range. If it breaks through the mid-zone and holds, we could see an attempt toward the upper resistance around $130+.
DYOR, NFA
Cryptonews
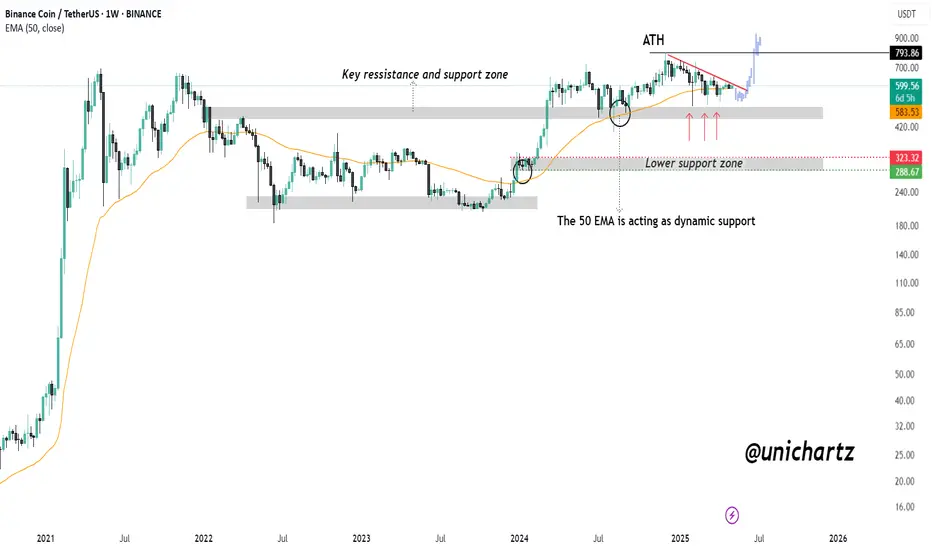
BNB Bull Flag Activated — Watching for $794 CRYPTOCAP:BNB is showing strong bullish momentum after rebounding off the marked support zone. This level, which previously acted as resistance, is now holding firmly as support following the breakout.
As long as BNB sustains above this zone, the bullish structure remains intact — and the path toward a new All-Time High (ATH) around $794 is wide open. The 50 EMA continues to act as dynamic support, further strengthening the setup.
DYOR, NFA
CRV Breakout Retest – Eyes on the Next Leg UpLSE:CRV has been trading within a well-defined ascending channel, showing a consistent bullish structure. Recently, the price broke above a key horizontal resistance level and is now retesting it—this is a classic breakout-retest scenario.
As long as CRV holds this support and remains within the channel, the bias stays bullish. A successful bounce from this zone could lead to a strong continuation toward the upper boundary of the channel or higher.
DYOR, NFA

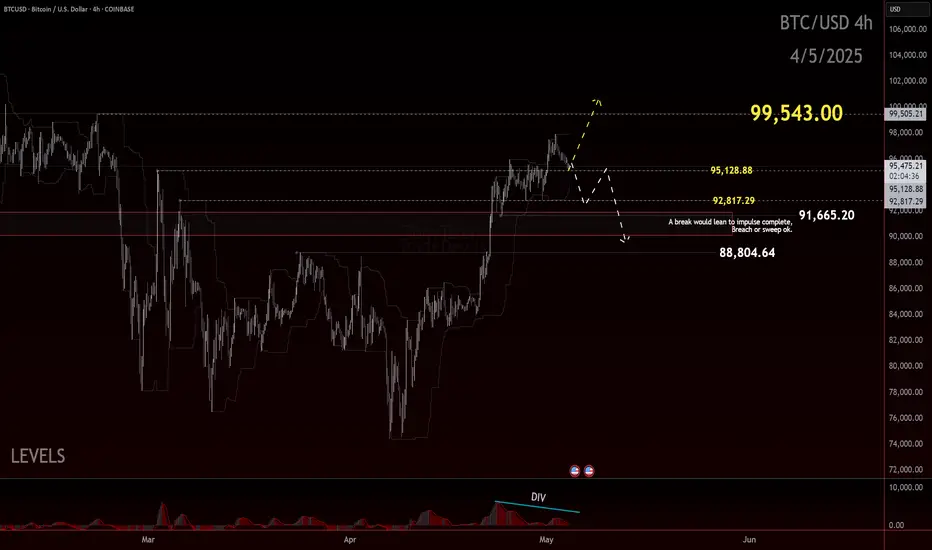
BTC: Balancing on the EdgeBitcoin held the $90.5K level and managed to flip prior resistance into support—an encouraging development, especially given how close price was hovering to the so-called danger zone. That flip marked a technical win for bulls, signaling potential strength in the short-term structure.
However, we’re not entirely out of the woods just yet.
While price is holding above support and showing some resilience, we’re still trading uncomfortably close to the edge of the recent consolidation zone. For now, $91.5K stands as the ideal level to hold.
The concern? If price starts slipping back below this newly established support, especially with conviction, that could be a signal of deeper retracement on the table. The bullish narrative would weaken significantly if we revisit and fail to defend those levels, potentially opening the door for a more sustained correction.
So, while the short-term structure remains cautiously optimistic, this isn’t the time for complacency. The market’s still in a precarious spot, and clarity will only come with either continued strength—or a confirmed break below support.
Eyes on $91.5K for now. Hold that, and the momentum favors the bulls. Lose it, and the deeper pullback scenario comes back into play.
Trade Safe, Trade Clarity.
BTC DOMINANCEBitcoin dominance could break down at this point, potentially signaling the start of an exceptional altseason.

Solvery IG Predicts Bitcoin to Reach $105,000 by May 10, 2025The cryptocurrency market continues to surprise even the most seasoned investors. Against this backdrop, the analytical firm Solvery IG has released an ambitious forecast: according to their calculations, Bitcoin's price could reach $105,000 by May 10, 2025.
Factors Supporting Bitcoin's Growth
In recent months, the market has shown strong positive momentum. Several key factors have contributed to this trend:
Institutional Investments: Major banks, funds, and corporations are increasingly incorporating Bitcoin into their portfolios as a hedge against risks.
Macroeconomic Instability: Inflationary pressures and weakening fiat currencies are driving investors to seek alternative assets.
According to Solvery IG experts, it is the combination of these factors that creates a "perfect storm" for the continued growth of the leading cryptocurrency.
Analysis and Potential Risks
Despite the optimistic forecast, potential threats should not be overlooked. The cryptocurrency market remains highly volatile. Possible tightening of regulations in the U.S. and Europe, as well as sudden shifts in Federal Reserve policies, could exert downward pressure on the market.
Nevertheless, Solvery IG highlights a crucial technical point: according to their data, Bitcoin has successfully held above key support levels between $60,000 and $65,000. This indicates strong buyer sentiment and supports expectations for a continued upward trend.
The impact of the halving event, which occurred in April 2024, should also be taken into account. Historically, Bitcoin has shown significant growth 12–18 months following a halving, and the current market behavior aligns closely with these cyclical patterns.
What This Means for Investors
If Solvery IG’s forecast comes true, Bitcoin would achieve more than a 50% increase compared to current levels. This presents significant opportunities for long-term investors. However, experts advise exercising caution, diversifying risks, and avoiding allocating all funds to a single asset.
Cryptocurrencies remain high-risk instruments, and successful investing requires a deep understanding of the market and a realistic assessment of all potential scenarios.
Conclusion
Solvery IG’s prediction of Bitcoin reaching $105,000 by May 10, 2025, sounds promising, especially given the positive momentum in recent months. However, investors should always remember: high returns come with high risks.

ORDI is printing a classic “dead-cat or genesis‐leg” decisionORDI is printing a classic “dead-cat or genesis‐leg” decision
🕞 60-Second Read
Trend on the 1-D chart is still structurally bearish but price (spot 8.34 USDT) just bounced +55 % off the March capitulation wick.
Hot-Zone #1 – 6.83 (V-Low): last defended demand, 18 % under spot.
Hot-Zone #2 – 11.74 (3 MP-High): first daily breaker sitting 41 % above spot.
Hot-Zone #3 – 23.24 → 30.62 (V-High ↔ MP-High): macro supply shelf where the next big void starts.
🎲 Probability Dashboard
HTF Trend & Market Structure – -2
Liquidity Map (voids above, un-retested pivots) – +1
Momentum (bull div & impulse) – +1
Derivatives Flow (funding near flat) – 0
Net Score = 0
Bear / Neutral / Bull odds ≈ 45 % / 25 % / 30 %
📈Trade Playbook
Strategy 1
1. Layered Limit Grid – Aggressive Counter-Trend Long
Entry layers (size %):
7.05 – 25 % of your allocated ORDIUSDT size
6.20 – 35 %
5.20 – 25 %
4.20 – 15 %
SL = 3.35
TP ladder:
11.74 – 25 % off-load
15.22 – 25 %
20.72 – 30 %
23.24 – 20 %
Weighted R:R ≈ 4.6
---
Strategy 2
2. Layered Limit Grid – Conservative Breakout Long
Trigger: daily close > 12.00, then place grid orders.
Entry layers (size %):
12.10 – 40 %
13.20 – 30 %
15.20 – 20 %
20.80 – 10 %
SL = 10.10
TP ladder:
23.24 – 30 %
30.62 – 30 %
37.65 – 25 %
48.25 – 15 %
Weighted R:R ≈ 4.9
Setup Logic
Price reclaimed minor breaker but sits inside a 72 % upside void to 11.74.
Three un-retested pivot highs (11.74 / 15.22 / 30.62) magnetise rallies.
Yearly BC 37.65 brackets with I-High 38.85 – high-timeframe liquidity pool.
Capitulation low left MP-Low 3.83 as invalidation reference for longs.
Risk Radar
BTC volatility spill-over could nuke thin ORDI order-books.
Macro: U.S. risk‐off headlines keep alt liquidity fragile.
Narrative: inscription / BRC-20 hype cycle cooling – watch volume.
ORDI is printing a classic “dead-cat or genesis‐leg” decision: defend 6.8 and bulls get an air-pocket run to 15 – 23; lose it and 3.8 is next. Trade the grid, not the hopium.
(Not financial advice – manage your own risk.)

CTSI Breaks Major Downtrend – Is the Next Leg Up Here?CTSI/USDT – Bullish Breakout in Play
CTSI has broken out of a long-term descending trendline, signaling a major shift in market structure. After reclaiming the $0.063–$0.068 resistance zone as support, bulls are clearly in control.
Key Highlights:
✅ Downtrend broken after months of lower highs.
✅ Minor resistance flipped to support, confirming strength.
✅ RSI at 75.62 shows strong bullish momentum.
✅ Structure is now forming higher highs and higher lows — a key trend reversal sign.
🎯Upside Targets:TP1: $0.085
TP2: $0.110
Support to hold: $0.063
CTSI is gaining momentum — if support holds, the next leg up could be explosive.

ETHFI Breakout Loading? Targets Up to $1.67!$ETHFI/USDT Analysis
Price is currently trading around a key resistance zone after a strong recovery from recent lows. While momentum looks bullish, the resistance has not been broken yet — making this a crucial level to watch.
A clean breakout and candle close above this zone could confirm a potential rally toward the next targets.
🎯 Upside Targets (if breakout confirms):
TP1: $0.881
TP2: $1.291
TP3: $1.677
📌 For now, stay patient. Let the price action confirm before entering — this zone could act as a rejection point if bulls fail to push through.
DYOR, NFA

XRPAs we bear the end of April, we should see continuation to the upside eyeing $2.50.
May is filled with ETFs going Live, Paul Atkins will come to a conclusion on the XRP v SEC case, plus many more catalyst.
Once we break $2.50 we will hit $3, very quickly. From there, the upside is hard to predict. We've seen $5 - $100 by the end of year, but in all honest. We must stay patient, and continue to stack our bags.
THIS IS NOT FINANCIAL ADVICE. IT IS MY OPINION ONLY.


Trend Shift Alert: $PEPE Closes Above Resistance + EMACRYPTOCAP:PEPE has closed above the 50 EMA after reclaiming a key resistance zone, previously acting as support. This breakout is a strong technical signal suggesting a trend reversal may be in play.
RSI is climbing and currently sits near 63, indicating increasing buying strength but not yet overbought.
If price holds above the reclaimed zone and the 50 EMA, it could trigger a continued move upward toward previous highs.
DYOR, NFA

Xrp idea Xrp seems to be stucked in this head and shoulders top pattern.
Probably head and shoulders top failure?
We will find out in due time.

BTC - Halving Cycle | Historical Patterns & 2025-2026 Projection
In this chart, we dive deep into the cyclical nature of Bitcoin price action post-halving and draw parallels between past and current movements, with a specific focus on how the market has historically reacted at various intervals following each halving event. This analysis incorporates both structural and temporal elements, providing a potential roadmap based on previous behavior.
---
Historical Context: Previous Cycles
3rd Halving – May 11, 2020
Following the 3rd Bitcoin halving, we observed a parabolic run-up over the next several months:
- 11 months after halving (April 2021): BTC reached a major peak, hitting nearly $65,000.
- This was followed by a significant correction.
- 19 months after halving (December 2021): Bitcoin printed a second top close to the previous all-time high, forming a classic double top pattern. This structure often signals market exhaustion and precedes deeper corrections.
Cycle Completion – Price Reversion
By 30 months after the 3rd halving (around November 2022), BTC had retraced much of its gains and returned to prices nearly equivalent to the halving level (~$8,000–$10,000 zone in log-adjusted terms). This marked the end of the cycle, confirming a full reversion to the mean after the double-top distribution phase.
---
Current Cycle: 4th Halving – April 19, 2024
We're now entering the 4th post-halving cycle , and so far, the structure appears to be rhyming closely with the previous cycle :
- Pre-halving rally took BTC to ~ FWB:73K (March 2024), indicating strong bullish momentum leading into the event.
- If this cycle follows a similar path, we may expect:
- A first major top around 9 months after the halving , potentially at or above $100K.
- A second top forming around 17 months after the halving (projected for September 2025), possibly signaling the beginning of a broader correction phase.
---
Projection: October 2026 (30 Months After Halving)
Using the same temporal framework:
- By October 2026 (30 months post-halving), the chart suggests a return to a much lower level , possibly around $50K.
- This projection mimics the post-double-top decline of the previous cycle, reinforcing the idea of cyclical mean reversion .
- It’s important to note: this isn’t necessarily bearish, but it highlights the cyclical and psychological nature of markets —boom, euphoria, distribution, and reversion.
---
The Macro View: Halving Cycles Are Rhythmic
- Every halving has historically set off a new bull run, but the timing of tops and bottoms is shockingly consistent :
- Peaks often occur 9–18 months post-halving .
- Full cycle completion is around 30 months post-halving.
- These cycles are heavily influenced by supply shocks , market psychology , and macro liquidity cycles .
---
Final Thoughts
This chart isn’t a guarantee—it’s a probability model based on cyclical symmetry. If history repeats or rhymes, we may be witnessing another textbook cycle play out, where a euphoric run in 2025 gives way to a deep correction by late 2026.
Stay alert for the double top pattern and macro divergences. Just as in 2021, timing the exit after the first peak can be the difference between profit and pain .
What do you think? Will Bitcoin follow the same 30-month post-halving trajectory?

Bitcoin’s Breakout Blueprint: Eyeing $92KAs of April 20, 2025, Bitcoin (BTC) is trading around $84,500, having recently tested the $92,000 level multiple times. This price point is significant, serving as both a psychological barrier and a technical resistance level.
Technical Analysis:
Resistance and Support Levels: Bitcoin has encountered resistance near $92,000, a level that has been tested repeatedly. A sustained move above this could open the path toward $100,000 and potentially $108,000, the previous all-time high from December 2024. On the downside, support is observed around $85,650, aligning with the 200-day EMA. Further support lies at $78,000 and $74,500, marking previous consolidation zones.
Chart Patterns: The formation of a bullish pennant on the daily chart suggests potential for an upward breakout. If confirmed, this pattern could propel BTC toward $137,000 by Q3 2025.
Volume and Momentum: Recent trading volumes have been moderate, with a slight uptick during price advances, indicating growing buyer interest. Momentum indicators, such as the RSI, are neutral, leaving room for further price movements in either direction.
Fundamental Factors:
Institutional Inflows: Significant capital inflows into Bitcoin ETFs, exceeding $70 billion, have been observed, reflecting strong institutional interest.
CryptoRank
Macroeconomic Environment: Liquidity injections by the U.S. Treasury, amounting to $500 billion since February 2025, have increased market liquidity, which historically correlates with Bitcoin price appreciation.
Halving Effect: The April 2024 Bitcoin halving event has reduced the supply of new BTC, a factor that has historically led to substantial price increases in subsequent months.
Mid-Term Outlook:
Considering the technical and fundamental factors, Bitcoin's mid-term target remains at $92,000. A decisive break above this level could lead to a retest of the $100,000 psychological barrier and potentially higher targets. However, failure to maintain support above $85,650 may result in a consolidation phase or a retest of lower support levels.
Investors should monitor key resistance and support levels, institutional investment trends, and macroeconomic indicators to assess Bitcoin's trajectory in the coming months.

INJ at Key Support – Will History Repeat?INJ/USDT Weekly Chart Analysis
INJ is currently trading at a crucial technical level, touching the strong rising support line of a long-term ascending channel. Historically, this trendline has acted as a reliable base for strong upward reversals.
The Stochastic RSI is also deeply oversold, similar to the levels seen during previous bottoms in early 2022 and early 2023 — both of which led to significant rallies.
If the support holds, INJ could be poised for another upward move toward the key resistance line of the channel.
However, a breakdown below this support would invalidate the structure and could lead to further downside.

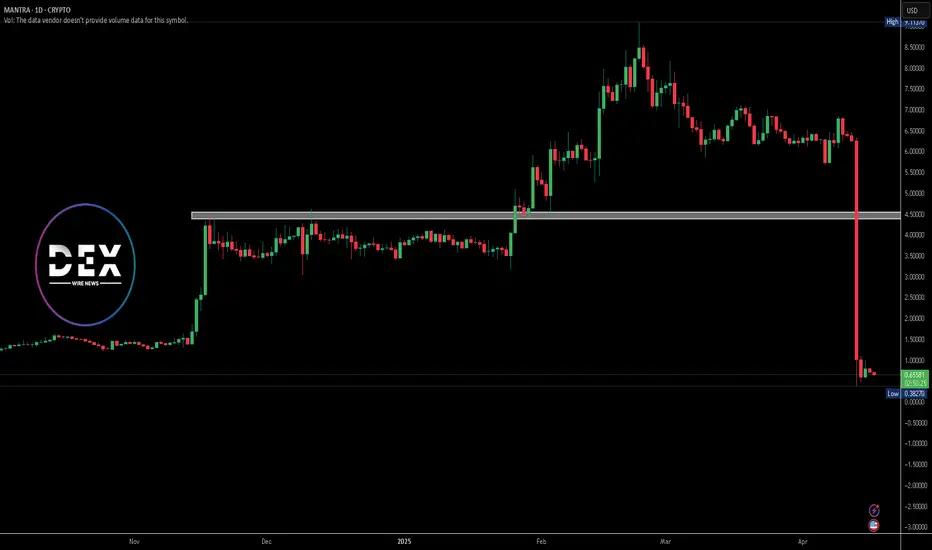
OM Token Plunges 92% as MANTRA Initiates InvestigationOn April 13, MANTRA’s native token, OM, experienced a dramatic 92% drop in price, plummeting from over $7 to just $0.66. The sharp fall occurred around 18:28 UTC during a period of low market activity. This sudden crash erased most of OM’s recent gains, bringing the weekly loss to -89.73%. As of now, OM trades at $0.6591 with a daily decline of 9.68%. The token holds a market capitalization of $634.76 million, with 24-hour trading volume at $387.43 million, reflecting a 42.99% drop.
MANTRA’s CEO, John Patrick Mullin, addressed the incident, clarifying that the collapse did not stem from any internal activity. He blamed the crash on “reckless forced closures” by centralized exchanges. Although no exchange was named, Mullin expressed concerns over the influence and decision-making power of these platforms, particularly during low liquidity windows such as Sunday evenings.
In response to the unexpected decline, MANTRA launched an internal investigation to identify the root causes and verify the token’s current circulating supply. To restore investor confidence, the project also announced a token buyback and burn program. These actions aim to support holders and reinforce OM’s long-term stability.
Technical Analysis
The OM/USDT chart reveals aggressive selling pressure signaling panic selling. After peaking near $9.11, the price sharply reversed, erasing months of gains. The absence of any meaningful volume during the crash suggests that liquidity dried up rapidly, leading to cascading liquidations. The price now hovers around a potential psychological support zone, but sustained recovery will depend on renewed demand and market confidence.
BTCUSDT has reached a pivotal point.Market Alert: Bitcoin's Crucial Moment
The battle lines are drawn! BTCUSDT has reached a pivotal point, slamming into the trendline resistance zone that's proven to be a formidable foe for bulls. Will the bears finally break through, or will the bulls rally for another attempt at higher grounds?
Our analysis reveals a high probability of rejection at this critical level, setting the stage for a potential downturn. If our expectations play out, we could see BTCUSDT plummeting towards the $81K and $80K support zones. These levels will be make-or-break for the short-term trend, and traders would do well to keep a close eye on them.
Stay alert, stay informed, and let's ride the waves of volatility together! The market is full of opportunities, and with the right insights, you can navigate even the most turbulent of times.

Crypto Market Cap: Short-Term Pullback Before Major RecoveryTechnical Analysis
The chart illustrates a well-defined ascending channel for the total crypto market cap (excluding BTC), currently experiencing a downward retracement. The price action suggests a probable dip towards the lower boundary of the channel around the $969 billion support zone before rebounding significantly. This level aligns with previous price reactions and serves as a strong demand zone, making it a potential bottom before the market resumes its uptrend.
Fundamental Analysis
Liquidity Flow & Market Sentiment
The broader market has seen increasing stablecoin dominance (such as USDT’s market cap exceeding $130 billion), indicating risk-off behavior as investors move to safety. This suggests a short-term sell-off in altcoins before a reinvestment phase.
Institutional inflows into ETFs (like Ethereum and broader crypto ETFs) will likely drive the next bullish wave, but the current correction reflects temporary uncertainty.
Macroeconomic Factors
Interest Rate Policies: If the Federal Reserve signals rate cuts in mid-2025, risk assets (including crypto) will likely benefit from increased liquidity.
Regulatory Clarity: The market is awaiting key regulatory developments, especially in the U.S. and EU, which could influence capital inflows into crypto.
Altcoin Cycle & Market Recovery
Historically, the crypto market experiences phases of correction before a strong recovery. With the next Bitcoin halving approaching (April 2025), the overall crypto market cap is expected to rebound as bullish momentum returns.
DeFi, gaming, and AI-based tokens continue to gain traction, setting the stage for an altcoin-driven rally once risk appetite returns.
Conclusion
A short-term pullback to the $969 billion support level is highly probable, after which a strong bullish reversal is expected. Long-term investors might see this dip as a buying opportunity, anticipating a rally towards the upper boundary of the channel (above $2 trillion) as macroeconomic and institutional factors align in favor of crypto.

$SOL Weekly Bounce from Dynamic Support – Watch for BreakoutCRYPTOCAP:SOL is holding above a key rising trendline that has acted as strong support since 2021. After a successful retest near $95–$100, SOL bounced sharply and is now trading above $120.
This move also confirms a reclaim of a previous resistance-turned-support zone. As long as it holds, SOL could aim for $145 and above.
DYOR, NFA

Tariff Pause = Crypto Pump?USDT Dominance is testing strong resistance (5.60%–5.80%) while holding a rising support line. A break below 5.40% could signal a shift to risk-on sentiment, triggering a move into Bitcoin and altcoins.
Trump’s 90-day tariff pause may further boost market confidence, reduce demand for stablecoins, and support crypto inflows. If dominance breaks down, it could spark an altcoin rally. If it holds above 5.80%, caution remains. This is a key turning point.

LTC Holding Key Support Zone Within Multi-Year RangeCRYPTOCAP:LTC is currently trading within a well-defined wide range, bound by a strong support zone near $63 and a resistance zone around $130–$140. The price has once again bounced from a rising support trendline that has held firm since 2020, confirming its significance as a long-term bullish structure.
Each time price approached this rising trendline within the support zone, it has historically led to a reversal or a strong upward move. Currently, LTC is showing signs of support around this zone again, suggesting the potential for another bounce.
However, the range-bound nature of the chart implies that until a breakout above resistance or breakdown below support occurs.
DYOR, NFA
#LTCUSDT #Litecoin

Bitcoin Technicals Flash Warning – Smart Money Watching!Bitcoin has been forming a series of lower highs and lower lows since its all-time high (ATH) of $109,568, indicating a potential downtrend. The support level, which previously held strong, has now been broken and is acting as resistance. The recent price movement suggests a retest of this broken support, which could confirm further downside if rejected.
The 100 EMA is positioned above the price, reinforcing bearish pressure. If BTC fails to reclaim this level, the price may continue to decline. RSI is hovering around 41.51, indicating weak momentum, with no strong bullish signals yet.
Bullish Scenario: A reclaim of the broken support and a move above $90,000 could invalidate the bearish setup.
Bearish Scenario: A rejection from this level could lead to further downside, potentially targeting $75,000-$72,000.
