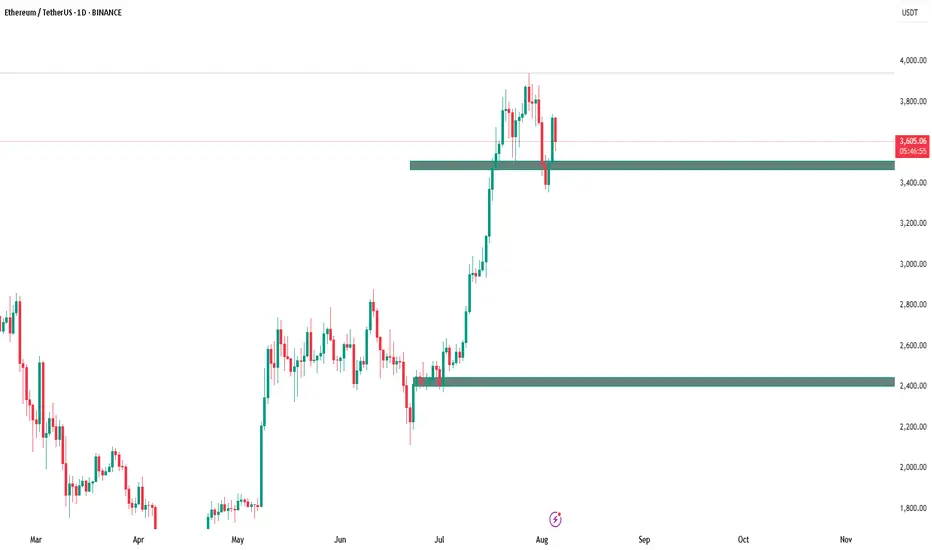
ETHERIUMTHE RESULT
Follow for more Simple And accurate swing analysis on Indices, Currency, Commodities.
Cryptorphic
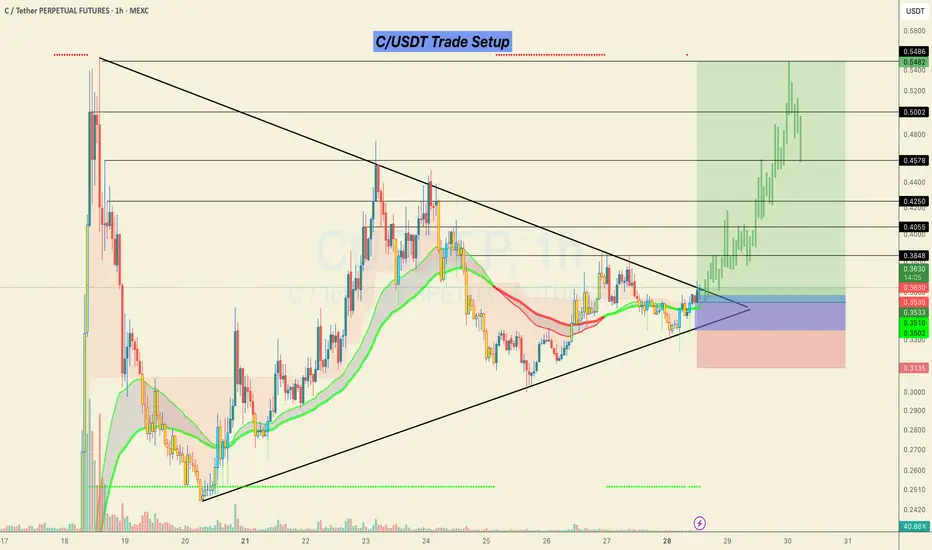
#C/USDT Looks ready for a 50% bullish move.C/USDT Trade Setup 📉
Currently forming a strong breakout structure after a long consolidation inside the triangle.
📌 Accumulation Zone:
0.3350 – 0.3580
🎯 Targets (Black Horizontal Levels):
0.4055
0.4250
0.4578
0.5002
0.5486
🛑 SL: Below 0.3135 (previous structural low)
Price broke out with solid momentum and retested the breakout zone. As long as we hold above the EMAs and the structure remains intact, continuation toward higher levels is likely.
This is a low-risk, high-reward setup as long as the risk is managed properly.
> Not financial advice. Trade at your own risk.
Do hit the like button if you want me to post more of these setups here.
Thank you
#PEACE
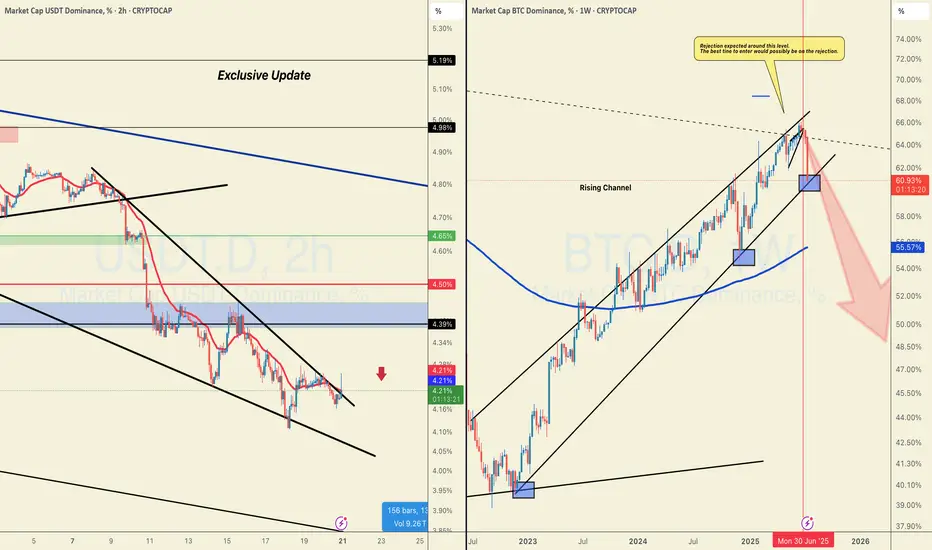
#BTC.D Just Hit the DAILY SUPPORT, WILL THERE BE A PULLBACK?CRYPTOCAP:USDT is breaking out on LTF while BTC.D just hit support that looks ready to break down.
Not a short call, but if you've been trading well, this is when you reduce margin and cut leverage.
Although I could be wrong about USDT here but profit-taking matters.
We will probably get a pullback this week to enter again.
It's better to watch coins rise a few more waves without you than to give it all back in a few reckless trades.
Spot bags? HODL and DCA.
Futures? Trade cautiously.
DYOR. NFA.
Do show your support with your likes if this post adds any value, and hit the like button.
Thank You
#PEACE
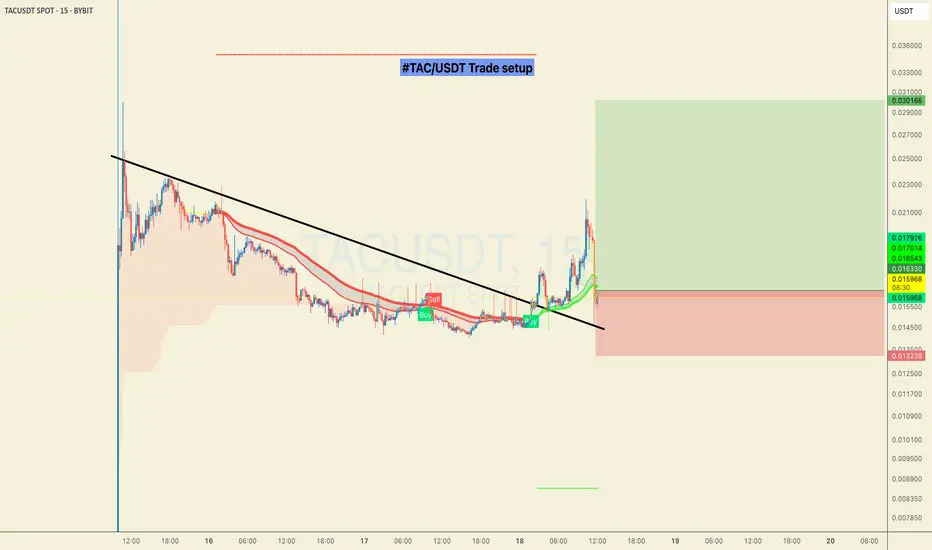
#TAC/USDT Trade Setup. Huge Dip, 80% potential!TAC just dipped ~20% after the breakout, but multiple indicators still point to a bullish rally. Sentiment’s flying 85% voting up for bullish PA on cmc.
Also, mainnet went live July 15, pulled in $800 M TVL via “TAC Summoning,” landed on Bybit, Bitget, Kraken, Binance Alpha, with Morpho, Curve & Bancor already onboard.
Entry: 0.01633 / 0.01566 / 0.01485
Targets: 0.01855 / 0.01989 / 0.02066 / 0.02234 / 0.02455 / 0.02766 / 0.02988
SL: 0.01327
High‑risk, high‑reward—use small margin, manage your risk, and DYOR. Not financial advice.
#PEACE
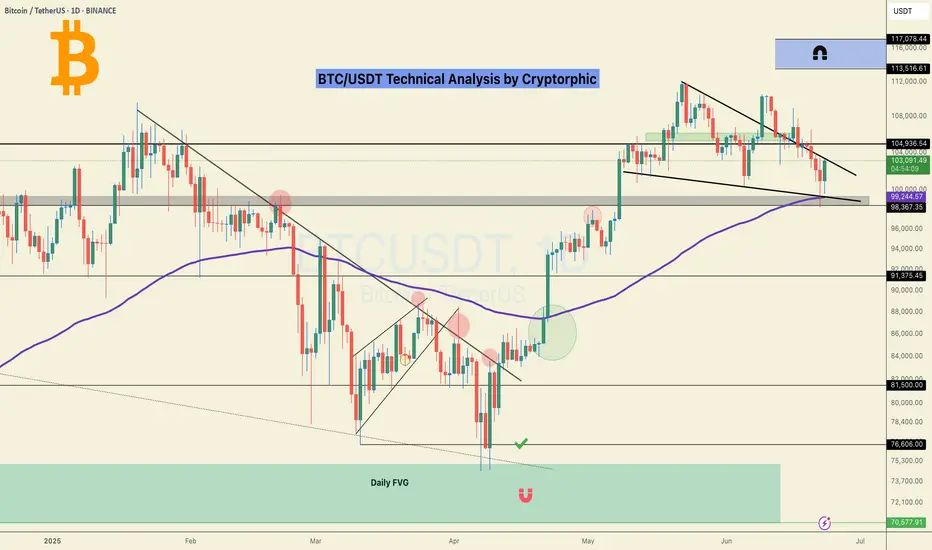
#BTC/USDT It's not over yet! Eying at 130K +ALTCOIN CHEAT SHEET!The last time I shared this chart was on April 14th, when Bitcoin was trading around $84,000 — right when panic was setting in across the market.
The message back then was simple: don’t panic, it’s just a retest.
And here we are again, revisiting the same sentiment with a new chart!
There are a lot of “double top” charts circulating in the space right now, but let me be clear: it’s not over yet.
Before jumping to conclusions, go through this chart and analysis to understand the full picture.
Bitcoin closed the week at $105,705 — certainly higher than most expected just a few days ago.
This marks the first red weekly candle after seven consecutive green closes, which is normal in the context of a healthy uptrend. We're still midway toward the broader target, so there’s no reason to panic or shift into disbelief.
Yes, we may see further corrections in BTC over the coming days or week, potentially down to $98K, and in a less likely scenario, even $ 92K. But this time, Ethereum is showing signs of strength and is likely to outperform Bitcoin, creating high-quality entry opportunities across the altcoin market. In other words, this phase is not a threat, it's an opportunity. BTC is still destined to hit $130k+ as per charts and other important metrics.
Here’s a typical market structure and reaction flow to help put things in perspective:
1. Bitcoin rallies — Altcoins underperform or get suppressed due to capital rotation into BTC.
2. Bitcoin corrects — Altcoins correct further as fear increases and dominance rises.
3. Bitcoin stabilises — Ethereum begins to gain strength, often leading the altcoin recovery.
4. ETH/BTC ratio increases — Ethereum holds up better while many altcoins continue to lag.
5. Bitcoin breaks ATH — This triggers a gradual recovery in altcoins.
6. BTC dominance peaks — Altcoins start gaining serious momentum.
7. Capital rotates from BTC and ETH into altcoins — Sectors tied to the current narrative (like meme coins this cycle, and Metaverse/NFTs in the last one) begin to lead.
8. Altcoin season begins — Utility and mid-cap tokens follow, often delivering strong returns in the final phase.
This pattern has repeated across cycles. Currently, we appear to be in the transition between Bitcoin stabilising and Ethereum gaining dominance — typically the stage that precedes a strong altcoin rally.
Now is not the time to assume the move is over. Stay objective, monitor capital rotation closely, and prepare for what comes next.
If your views resonate with mine, or if this post adds any value to you, please boost with a like and share your views in the comments.
Thank you
#PEACE

100% Win Rate on BTC & Alts! Where’s the Next Breakout?USDT Dominance Update:
While the herd chases the latest hype, we called this before it even unfolded. BTC’s recent surge was lightning-fast.
These were the trades shared in the last 30 days. I'm just saying we could've had more wins!
Our setups didn’t just hit targets…
They exploded through them 🚀
These are spot gains, imagine trading wth leverage with these.
There's more to come in the next week.
✅ MIL:ENA +53%
✅ HOSE:VIC +50%
✅ $CHILLGUY +40%
✅ NASDAQ:HUMA +35%
✅ CRYPTOCAP:XRP +34%
✅ $VOXEL +32%
✅ OMXTSE:MAGIC +30%
✅ CRYPTOCAP:RENDER +25%
✅ CRYPTOCAP:AVAX +24%
✅ SEED_DONKEYDAN_MARKET_CAP:FLOKI +25%
✅ CRYPTOCAP:LINK +17.65%
✅ CRYPTOCAP:SUSHI +17.3%
✅ AMEX:MBOX +15%
✅ $MAVIA +14.7%
✅ TVC:MOVE +11.66%
✅ $EPT +11%
✅ BME:ETC +10.3%
✅ PSX:POL +20%
✅ CRYPTOCAP:SUI +20%
✅ LSE:ONDO +7.5%
✅ SET:PORT +6.17%
✅ CRYPTOCAP:TON +3%
📈 These aren’t just simple trades; they’re alpha-backed calls.
If you’re still watching from the sidelines…
You’re watching others print.
Be patient and precise with your entries and exits. Never FOMO.
The market will bait you into bad timing if you let it.
A 4.4% drop in USDT dominance marks the start of a new altcoin season, but remember, BTC will steer this cycle.
More setups on the way.
Stay tuned.
Do hit the like button and share your views in the comments.
Thank you
#PEACE

Altseason isn’t cancelled, it’s just delayed. Here's WHY!CRYPTOCAP:BTC Dominance Update:
Altseason isn’t cancelled, it’s just delayed.
The key zone to watch is 69.5%–73% dominance. That’s where we’re likely to see a strong rejection if it doesn't start soon, which seems unlikely given the current circumstances.
The longer it takes to reach that level, the stronger the altcoin rally will be once it hits.
This isn’t hope, it’s exactly what the charts are showing.
Historically, 70% dominance has acted as a major reversal zone.
If there are signs of reversal before this level, I'll let you know beforehand.
So follow me if you don't and share this chart with your crypto friends.
Do not forget to keep cash/stables!
Let me know what you think in the comments.
Thank you
#PEACE

#BTC Bounced, 100EMA saved the day!100 EMA saved the day.
But the one concern? We’ve printed a new Lower Low, not a great sign.
The chart looks bouncy, but the overall structure still feels uncertain.
No point guessing or forcing trades here, I’d rather wait for clear confirmation.
I’ll share updates if I spot any changes or interesting altcoin setups.
For now, patience is our best edge. I know many altcoins might look great, but BTC Dominance is not yet done. I'll be sharing that chart tomorrow.
Stay sharp.
Hit that like button if you find this short update useful.
Thank you
#PEACE
#BTC/USD Close Fight but bulls win! $117K Still in sight!CRYPTOCAP:BTC Weekly Update:
BTC closed the week up by just 0.08%, leaving behind a long wick and a tiny body, forming a Dragonfly Doji, one of the strongest candlestick patterns, signalling a fierce battle between bulls and bears.
✅ This time, the bulls won by a small margin, but a win is a win.
✅ BTC successfully held its key support.
✅ The CC is green, which is a positive sign.
The price action remains choppy, but the trend is still pushing upward from here.
Invalidation:- Weekly Close below $100k
What do you think?
Do let me know in the comments section. And please hit the like button.
Thank you
#PEACE

#MARKET DUMPED! What's Next?Honestly, I didn’t expect this move to play out the way it did.
I’ve been warning about a potential breakout on the lower timeframes, and in hindsight, the signs were all there, but I still missed it. It happens, even to the best of us.
Took a few hits with stop-losses today. But no complaints, it’s a small dent compared to what we’ve gained over the past few weeks.
Now, shifting focus. I’m watching this chart closely — this is the 130 EMA on the 4H, which has historically done a great job identifying short-term rejections and bounces. It’s already plotted, and I’ll continue tracking it.
If we break above this level, there’s a strong chance
CRYPTOCAP:BTC can revisit the 98k zone. Until then, stay cautious and avoid High leverage.
Holding LSE:TAO $EIGEN and a few more.
No need to force trades, let the setup come to you.
One more thing, I am still not Bearish, it's a shakeout right before the real move! So be alert when opportunities come to you.
I was planning to take a break today, but not like this tbh.
Stay tuned
We adapt and move forward. Always!
Cheers
Do show your support and hit that like button.
Thank you
#PEACE

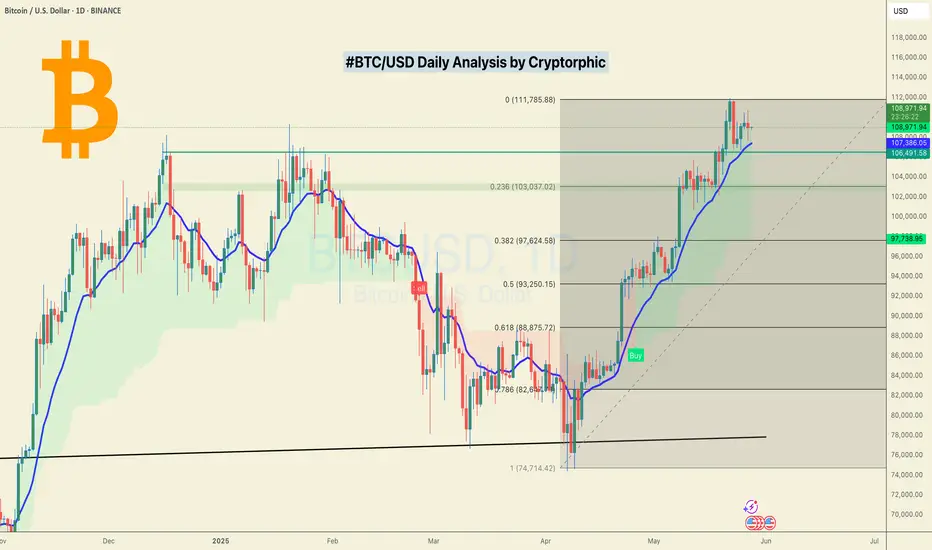
#BTC/USD The Uptrend is still intact! Here's Why!BTC Daily Close Update
Bitcoin closed at $108,951, marking another failed attempt to break through the $111K resistance.
It’s been nearly 8 days of consolidation just below this level. That’s not ideal, and it signals we may need a fresh catalyst to push higher.
Not bearish, just cautious.
As long as the blue EMA holds on the daily, the uptrend remains intact.
Still watching for a move toward $117K.
DYOR, NFA
Please show your support with your likes.
Thank you
#PEACE
$USDT: A Critical Close Is Approaching. BULL TRAP or ALTSEASON?This one’s more important than most people realise.
Alts will either explode from here, or this recent ATH turns out to be a bull trap, the last rally we've been waiting for may take a little more likely.
I personally think this is an unlikely scenario but if you really intend to make big bucks in this market, you gotta be ready for every outcome.
No bs. No noise. Just the facts.
I'll recommend that you bookmark this post to stay updated.
Do hit the like button if you like this post.
Thank you
Stay safe folks
#PEACE

No one is talking about this! Big breakout Incoming! Here'S Why!CRYPTOCAP:USDT dominance is nearing a potential death cross on the daily chart. The last time this happened, we saw nearly 40 days of uninterrupted green across altcoins.
During that period, CRYPTOCAP:BTC rallied from $67,476 to $101,898. Many altcoins surged between 90% and 300%.
We’re now witnessing similar conditions unfold.
If this crossover gets delayed or invalidated (Less likely but entirely possible), altcoins may experience short-term corrections.
But the broader altcoin season remains inevitable.
If this helped you gain perspective, give it a like and repost.
You might want to bookmark it, I’ll update the chart as this plays out.
Don’t let short-term volatility shake you out of generational opportunities.
Be strong there, WAGMI!
#PEACE

#BTC/USDT Highest Daily Close! What it Means? $117k on cards?Bitcoin Daily Update – Bulls Take the Lead
Bitcoin just recorded its highest daily close in history at $106,849.99 (Binance), surpassing the previous record of $106,143.82 set on January 21st. While the difference is minor in percentage terms, it's still a meaningful win for the bulls.
The next key level to watch is $113k to $117k, based on the Fibonacci extension target.
For confirmation, we need another solid daily candle close above the current range. The $106K resistance has already been broken, and BTC is holding above it, indicating strong bullish momentum.
To avoid getting trapped in a fakeout, consider adding the 14 EMA to your chart. As long as BTC holds above this EMA, the uptrend is likely to continue.
Once BTC's show is over, Altcoins will likely follow suit.
INVALIDATION OF THIS CHART: A close below $102k in confluence with 14EMA in Daily.
I hope this update gives you actionable insight. If it did, feel free to follow and like. Let me know your thoughts or questions in the comments, I read every one.
Thank you
#PEACE

#ETH/BTC Update:- This will trigger the real Altseason!The $ETH/BTC chart is making a strong attempt to break above the channel resistance, which aligns with the 100 EMA (the blue line).
Once it breaks above these two levels, it will trigger the real altseason as alt/BTC pairs start to pump. Until then, as long as we stay within this channel, we won’t see an altseason. ETH needs to break this resistance.
I recommend bookmarking this post to stay updated.
Cheers

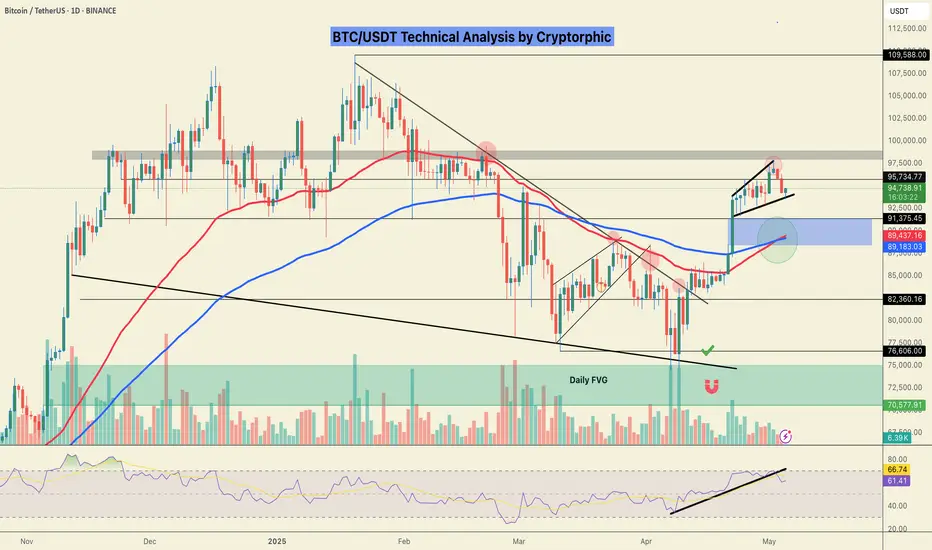
#BTC/USDT Bullish Crossover in Play!CRYPTOCAP:BTC Update: Bitcoin is currently holding support and showing signs of strength with a bullish EMA crossover — the 50 EMA crossing above the 100 EMA, which historically signals upward momentum based on past fractals.
The lower support zone is marked in blue, in case the price dips further.
Immediate resistance remains at the GETTEX:98K level — a confirmed close above this could trigger a move toward $103K.
Stay tuned for more real-time updates.
Do hit the like button if you like it, and share your views in the comments section.
Thank you
#ETH is hitting a major resistance next target $4000! Here's Why#ETH is back inside the legendary 1,883-day trendline, a massive bullish signal for altcoins.
Meanwhile, BTC Dominance is getting rejected from the top, adding fuel to the altcoin momentum.
But there's one key confirmation still needed before we talk about new ATHs for ETH, BTC, and the broader altcoin market:
The 200-Week EMA.
Currently sitting around $2,237, this level needs to be claimed with a strong weekly close. ETH is trading above it right now, but the next 2 days and 4 hours are crucial.
A confirmed breakout here would signal a major shift in ETH's 200-week momentum a structural change that could trigger the next big leg up.
I believe it’s only a matter of time before ETH closes above this level. Once that happens, the next target for CRYPTOCAP:ETH would be $2980, $3488 and $4000!
What do you think?
Drop your thoughts in the comments and hit the like button if you found this valuable.
#PEACE ✌️

#BTC/USDT Update. Bitcoin is currently trading around a key resistance zone.
The immediate support lies near $95,554, while a confirmed breakout above $97,300 could trigger an uptrend toward $104,000.
Until then, trade with caution.
DYOR. NFA.

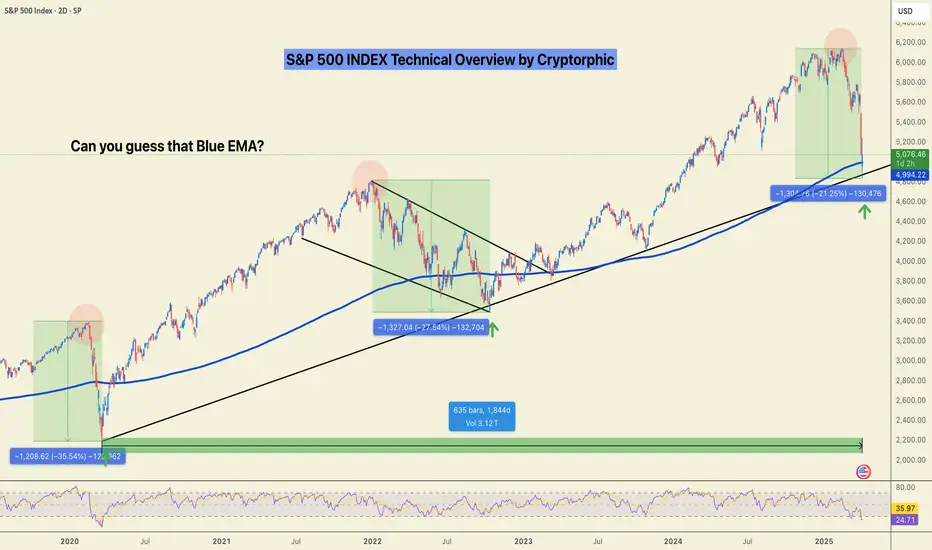
S&P 500: Valuation Correction or the Start of a Breakdown?Valuation Correction or the Start of a Breakdown?
Zoom out. Clear the noise.
We might still sweep the lows, but when viewed on the weekly timeframe, this current S&P 500 move looks more like a healthy valuation correction than a structural breakdown.
Let’s break it down by the numbers using fractal analysis:
🟩 March 2020 (COVID Crash):
▪️~35% drop
▪️V-shaped recovery
▪️Oversold RSI bounce
🟨 2022 Bear Market:
▪️~27% correction
▪️Multi-month wedge consolidation
▪️Eventually led to an upside breakout
🟦 Now (2025):
▪️~21% correction so far
▪️Retesting long-term trendline
▪️RSI in familiar oversold zone
📊 Fractal Math:
- From 35% to 27% = 22.86% decrease
- From 27% to 21% = 22.22% decrease
Both legs show a consistent ~22% drop in correction depth suggesting bearish momentum is weakening with each cycle. Currently bouncing off the1844 days of support.
Is this the bottom? Will there be relief?
🔁 If this pattern holds:
- We could see a short-term sweep or deviation under recent lows.
- But structure favours a potential recovery from this zone, unless the trendline breaks decisively.
📌 Watch levels closely. Timing matters.
🧠 What’s your take, is this another “buy the dip” moment?
Do hit the like button if you liked this update and share your views in the comment section.
#BTC/USDT Urgent Update. If you like money, Read This!Welcome to this quick update, everyone!
Bitcoin (BTC) is currently trading at around $98,400 at the time of writing.
BTC is making a **bearish retest of the 21EMA** on the daily chart, which is a crucial indicator for identifying short-term trends. This is particularly significant for traders involved in futures and options within the crypto market.
- Break above the 21EMA is bullish.
- BTC is also retesting the previously broken pennant pattern to the downside.
If you're feeling FOMO (fear of missing out), it's better to wait until BTC reclaims the Blue EMA and trades back inside the channel/pennant.
If these two levels are recovered, we could anticipate a new all-time high (ATH). However, until that happens, exercise caution. Trading volume is exceptionally low across exchanges, and it's worth noting that during holiday seasons, market makers often exploit these conditions to manipulate prices, leaving retail traders at a disadvantage.
While you're free to make your own decisions, my advice is to trade with confirmations. This approach provides an edge and makes holding positions more comfortable while effectively managing risk.
If you found this analysis and chart helpful, please hit the like button to show your support and feel free to share your views in the comments section.
Thank you!
#PEACE

#ATH/USDT a Solid Investment Opportunity!10X POTENTIAL!TSX:ATH : A Cheaper and Better Alternative to CRYPTOCAP:RENDER
TSX:ATH is emerging as a strong competitor to CRYPTOCAP:RENDER , offering decentralized GPU rendering services for digital creators at a more cost-effective price point. While RENDER leads in market cap and adoption, ATH is catching up with its blockchain-based approach and value-driven proposition.
ATH Market Cap: $374.75 million
RENDER Market Cap: $3.46 billion
If ATH reached RENDER's market cap, it could potentially deliver a 10x return from its current levels. This potential is why ATH remains one of my largest holdings.
If you feel that FOMO, focus on accumulating fundamentally strong coins like ATH, which feature robust use cases and display bottom-reversal chart patterns.
##Why TSX:ATH is a Strategic Accumulation Opportunity
Due to the ongoing bearish market conditions, nearly all altcoins, including ATH, are under pressure. However, this creates a golden opportunity to accumulate quality projects.
I hold a low-leverage futures position with an average entry of around $0.75, and I plan to add more if the price dips further. My target is $4-$5, especially if the much-anticipated altseason materializes.
For spot entries, the $0.054-$0.066 range is an excellent zone to accumulate. With strong fundamentals and promising potential, ATH remains a key project to watch.
Note: Always conduct your own research (DYOR) before making any investment decisions.
If you found this analysis helpful, don’t forget to hit the **like button** and share your thoughts in the comments below!
Thank you and #PEACE ✌️

#USDT Dominance: Don't FOMO! Here's Why!A rejection on the daily chart has led to a strong performance in altcoins, while BTC is steadily approaching the $100K zone, currently sitting at $98K. A break below the blue EMA, which is being tested now, could result in further continuation.
However, a bounce might mark the end of this Christmas rally.
For those experiencing FOMO, it’s better to hold on and wait. Of course, you’re free to make your own decisions, but in my opinion, patience is the best approach.
I hope you're enjoying the holidays!
Make sure to reduce screen time and spend quality moments with your family and friends.
Stay tuned for more updates!
Do hit that like button if you found my updates helpful in any way.
Thank you
#PEACE

#CHRISTMAS RALLY INCOMING OR JUST A TRAP?CRYPTOCAP:BTC Dominance is Finally Seeing a Rejection!
The upcoming weekly close will be critical for ALTCOINS.
The rejection looks good and it's important for BTC to stay stable for the altcoins to pump.
The weekend is here and you don't decide on a trend on the weekend, you must wait for a weekly close and how traditional markets open.
So more clarity will be seen on Monday.
Is this the start of the altcoin rally you've been waiting for?
Or is there more pain ahead?
The answers will reveal themselves soon.
So make sure you follow me on all socials.
More updates will be posted on confirmation!
I’ve shared 13 altcoins on request in my TG, and they’re already up 10%-25% in the last 4 hours.
Also, do not forget to hit that like button and share your views in the comment section.
Thank you
#PEACE
