BTC to 26450$ BTC is going to test 26450$ support level. Price is going down, Probably it’s going more lower levels.
Cryptos

Wyckoff Method - AMBUSDTWyckoff Method - AMBUSDT 1 hour frame
Wyckoff's method on 1 hour frame, I think the target is 0.01058 with 13% profits.
I hope this works.

XRP- NEW DAWNYou get money, they get money, this is a possible start for the bullrun of crypto. Its cup and handle in cup in handles, flags within flags.
Looking at this Risk to Reward is very promising for bulls vs bears. Do YOUR OWN ANALYSIS, but keep this chart in mind for is for told within the near future and beyond.

BTC Buys into $30K I need price to flow into the $30k region so I can begin scaling into my long-term sales. While I wait for this setup to arise, we can take advantage of some short-term buys up into the big round psychological number. I personally believe price could flow up from here without much manipulation or buy trade disturbance.

ETHUSD Megaphone taking the price to the top of the ChannelEthereum / ETHUSD is consolidating at the bottom of a Megaphone which was created after the bottom pricing on the Channel Down.
A 1day RSI Bullish Divergence was the bullish reversal indication.
You can buy on the current market price as the trend is very steady and target 1880 (top of the Channel Down and still under the 0.786 Fibonacci level).
Follow us, like the idea and leave a comment below!!

STRAXUSD hit the 1week MA200 after more than a year.Stratis / STRAXUSD hit the 1week MA200 after June 2022. That is also the top of Resistance Zone A and somewhat below Fibonacci 0.382.
Technically the strongest Resistance region and what separates the Bear Cycle from the Bull.
Even though the coin has long broken the Falling Resistance of the correction cycle, it is still inside the Accumulation range.
Only by closing over this Resistance Zone, will it enter into long term bullish grounds.
Until it does, sell and target 0.55000 (1week MA50). A highly overbought 1week RSI supports this scenario.
If it does close a weekly candle over the MA200, buy and target 1.6500 (under the 0.618 Fibonacci).
Follow us, like the idea and leave a comment below!!

TUSD: Strong breakout confirmed. Rally just beginning.Threshold crossed over the LH trendline of 2023, turning bullish on the 1D timeframe (RSI = 67.372, MACD = 0.000, ADX = -21.212). This is a confirmation that a new rally has started, as it also closed over the 1D MA50. This has been done before on June 23rd but there was no RSI Bullish Divergence as it built up now.
Consequently, the short term target is the 1D MA200 (TP1 = 0.0240) and after a pullback rebuy and target the R1 level (TP2 = 0.02955). After that, the upper Fibonacci levels will play the Resistance part.
## If you like our free content follow our profile to get more daily ideas. ##
## Comments and likes are greatly appreciated. ##

BTC Short-Term ☁️, One-Week Horizon Bullish ☀️Clouds ☁️ lie ahead in the next 24 hours for the global crypto market, including Bitcoin and Ether, indicating a slightly bearish market with downside risk. Altcoins such as Avalanche, Chainlink, and Polygon face more lenient trading conditions, with a slightly bullish sun forecast by ATTMO.
Over a one-week horizon, this slightly bullish sun should also shine over Bitcoin, Ether, Cardano. ☀️ Ripple and Binance Coin won’t profit from these favorable trading conditions and continue to face a downside risk.
Follow us for more crypto weather reports!

BITCOIN (BTCUSD): I am BULLISH! Here is WHY: ₿
Have you seen that peculiar confluence zone on Bitcoin on a daily time frame:
we have a perfect match between a horizontal demand cluster, 382 / 50 retracements
of the last 2 bullish impulses.
After the test of that structure, the price formed an inverted h&s pattern on a 4H time frame
and broke its neckline, confirming the strength of the buyers.
I anticipate growth now at least to 28300
❤️Please, support my work with like, thank you!❤️

TWTUSD: The 1D MA100 may be what's needed for a 1.6500 rally.TWTUSD has crossed today over both the 1D MA50 and MA100 with force turning overbought technically on the 1D timeframe (RSI = 72.444, MACD = 0.001, ADX = 22.204). It hasn't closed a candle over the 1D MA100 since January 29th 2023, so today's closing may be vital for the long term. Even though the 1D MA200 looms just under the R1 level (0.9885), we believe that closing above the 1D MA100, will be the most crucial step towards a four month uptrend targeting the 0.618 Fibonacci level (TP = 1.65000). If it fails to close above the R1 level, we will take a short term sell, aiming at the 1D MA50 (TP = 0.8350).
## If you like our free content follow our profile to get more daily ideas. ##
## Comments and likes are greatly appreciated. ##

Bitcoin sell is your favorite directionas we see in the RSI a divergence has been dedected and we know that BTC respect this divergences if we see in last years he follow the RSI before 2023 and the begining of 2024 more dump for BTC then the RALLY will begin note my notes see you in the beging of 2024

GALAUSD: Next 1D MA50 break can deliver a massive rally.GALAUSD is testing today the 1D MA50 for the first time in two months on a green technical 1D outlook (RSI = 60.296, MACD = -0.001, ADX = 46.201). Being through all 2023 inside a Channel Down similar to 2022, we can argue that the next 1D MA50 cross over (like the 1W RSI cross over the MA line) can provide a rally similar to January's. That will be our trigger level and will target the 0.786 Fibonacci level (TP = 0.04400).
## If you like our free content follow our profile to get more daily ideas. ##
## Comments and likes are greatly appreciated. ##

XECUSDT Trade Signal Timeframe: 1H XECUSDT Trade Signal Timeframe: 1H
#Crypto #Cryptomarket #CryptoSignal #Forex #XECUSDT #TechnicalAnalysis #TradingOpportunity #Divergence #TradingSignal #TradingwithBelieve #NASDAQ #USTECH
Hey traders! 👋 Let's dive into a potential trading opportunity on the XECUSDT pair using technical analysis. 📊
📉 Previously Bullish Trend:
Firstly, on the 1H- timeframe, we've been witnessing a Bearish trend in the XECUSDT pair. 🐻
🔄 NO Divergence on HH (Higher High):
However, it's crucial to note that recently, we have started to observe a no divergence pattern on the HH (Higher High’s). This is an important signal that the Bearish momentum might be weakening. 📉🔄
📊 Trade Opportunity:
Currently, we are looking at a potential trade opportunity with a Bullish bias.
📈 Entry Price: 0.000002778
🎯 Stop Loss Level: 0.000002644
🚀TP1: 0.000002893
💰 Investment Advice:
Please remember that trading carries risks, and it's essential to have a well-defined trading plan, proper risk management, and stop-loss orders in place. This analysis is for educational and informational purposes only and should not be considered as financial advice. Make sure to do your research and consider your risk tolerance before entering any trade.
Happy trading, and may the pips be in your favour! 🚀📈💰 #HappyTrading #ProfitOpportunity #TradeSmart #CryptoSignal #StockSignal #TradingwithBelieve

POLYUSD Wait for a clear break out.POLYMATH is having a strong (1d) candle, crossing over both the MA50 and MA200 (1d).
This is not a bullish signal yet as the long term pattern remains a Channel Down, particularly bearish under the Falling Resistance.
Trading Plan:
1. Sell as long as the (1d) candles close under the Falling Resistance.
2. Buy if it closes over it.
Targets:
1. 0.1150 (Support 1).
2. 0.2100 (Fibonacci 0.5).
Tips:
1. The RSI (1d) is overbought. It favors short term selling.
Please like, follow and comment!!

BTCUSD This Resistance is the pivot point. Trade accordingly.Bitcoin is trading inside a Channel Up that led it straight to the Falling Resistance of July.
Even though it crossed over the MA200 (1d) and Resistance 1 (28175), it is currently struggling to close the candle over them.
Along with the MA100 (1w), which is a Resistance since May 7th 2022, those are your pivot points.
Trading Plan:
1. Sell as long as the (1d) candles close under the Falling Resistance.
2. Buy if it closes over the MA100 (1w).
Targets:
1. 27200 (Channel Up bottom).
2. 30800 (Resistance 2).
Tips:
1. The RSI (1d) is almost overbought near 70.00. This justifies a short term pull back before the break out.
Please like, follow and comment!!
Notes:
Past trading plan:

BTC 🌤️ 24-Hr & 1-Wk Outlook; Bullish Trend 🔛Sunny trading conditions with a few clouds lie ahead for the global crypto market, including Bitcoin and Ether in the next 24 hours and over a one-week horizon. 🌤️
This indicates that a slightly bullish market with upside potential is likely.
On the other hand, XRP and Binance ☁️ buck the trend, facing slightly bearish trading conditions.
Follow us for more crypto weather reports!

Filecoin lagging behind Bitcoin and rest of the cryptocurrenciesPer request, we want to take a look at Filecoin. This cryptocurrency has been around for a few years, and the first thing that stands out to us is that its value is down more than 98% since its peak in 2021. Another thing that caught our attention is the relatively lower daily volume since the start of summer compared to the period in the first six months of 2023. Currently, Filecoin trades near $3.40, with technical indicators like MACD, Stochastic, and RSI pointing to the upside on the daily time frame, with MACD attempting to enter a bullish zone above the midpoint. We saw similar developments shortly before the recent jump in the price of Bitcoin. Therefore, it might be worth watching out for a breakout in MACD as it can bolster a bullish case in the short term. However, we think that beyond the short term, Filecoin will be exposed to the pressure of growing Bitcoin’s dominance, likely putting a lid on its price.
Illustration 1.01
Illustration 1.01 shows the daily chart of Filecoin in USD and simple support/resistance levels.
Technical analysis gauge
Daily time frame = Slightly bullish
Weekly time frame = Neutral
*The gauge does not necessarily indicate where the market will head. Instead, it reflects the constellation of RSI, MACD, Stochastic, DM+-, ADX, and moving averages.
Please feel free to express your ideas and thoughts in the comment section.
DISCLAIMER: This analysis is not intended to encourage any buying or selling of any particular securities. Furthermore, it should not be a basis for taking any trade action by an individual investor. Therefore, your own due diligence is highly advised before entering a trade.

BTCUSD: The Huge Pivot Zone will decide its fate.Bitcoin has completed seven weeks of trading inside the 1W MA200 - 1W MA50 range. It is no surprise that the 1W technical outlook is neutral (RSI = 50.743, MACD = 460.600, ADX = 25.554) as while the 1W MA50 has been supporting, the 1W MA100 has been resisting. The latter hasn't closed a 1W candle over it since April 25th and is at the moment the top priority to break for Bitcoin.
On a greater scale though, the true Resistance to cross is 31,800 which is the top of what we call the "Huge Pivot Zone" (25,400 is the Support). The price hasn't closed any 1W candle outside of this Zone since it entered it on the week of March 13th 2023. In fact we can go as back as January 2021 and see the importance of this Pivot Zone. In 2022 there hasn't been any 1W candle closing under the top (31,800) of the Pivot Zone. Then in 2022 up until March 2023 this became a rejection level, closing all candles under it, while the Cycle bottom was being formed.
With the Bull Cycle HL trendline still supporting (along with the 1W MA50) and the price approaching the 1W MA100, we will soon have a strong breakout signal at hand. But if this is accompanied by a break over 31,800 then we have great chances of going into the April 2024 Halving with prices above $40,000. Likewise a crossing under the HL and the 25,400 Support can break the Bull Cycle blueprint and take us into uncharted (bearish) territory.
## If you like our free content follow our profile to get more daily ideas. ##
## Comments and likes are greatly appreciated. ##

SOLUSD Very close to a huge break outSolana is testing now the Falling Resistance from July's candle body top.
All two prior break outs over such Resistance in the past 12 months have ended with a new Higher High on our main Channel Up pattern.
Trading Plan:
1. Buy if the price breaks above the Falling Resistance.
Targets:
1. 33.000 (Fibonacci 2.0 extension as on previous break outs).
Tips:
1. The RSI (1d) will start flashing the first sell signs inside its Resistance Zone. Use it as an additional exit back up plan in case there is a sudden price reversal.
Please like, follow and comment!!

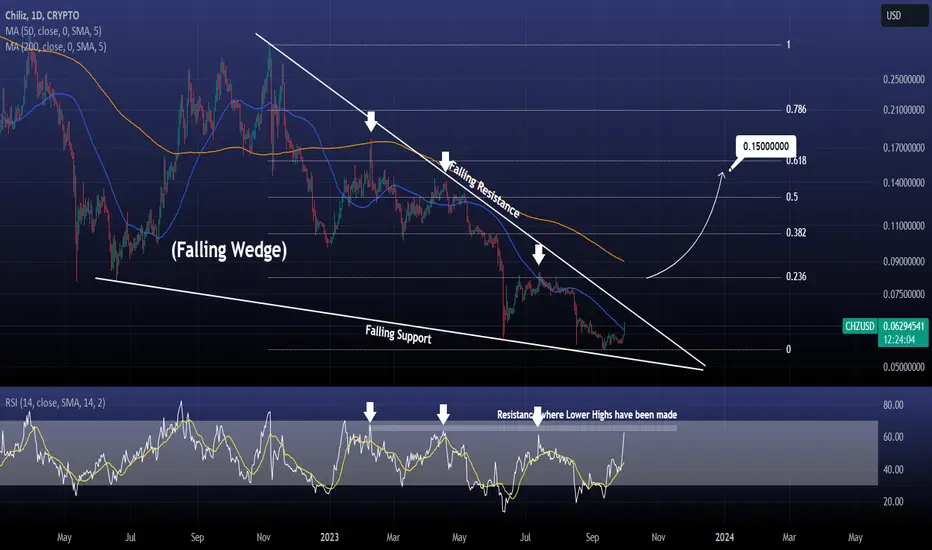
CHZUSD Giant Falling Wedge about to break upwards?Chiliz / CHZUSD crossed today over the 1day MA50 for the first time in 2 months.
Even though that is a significant bullish signal, it is still not as strong as a potential break over the top of the Falling Wedge pattern would be.
As a result, a break over the Falling Resistance would target the 0.236 Fibonacci level and 1day MA200.
Buy when a 1day candle closes over the 1day MA200 and target 0.15000 (a little under the 0.618 Fibonacci).
Note that the 1day RSI is on the Resistance level which has priced 3 Lower Highs on the Falling Wedge. This is why wee need to see a clear breakout.
Follow us, like the idea and leave a comment below!!
GALAUSD: Bullish divergence leading to the top of the ChannelGala is trading inside a Channel Down every since the market top early this January and today the 1D technical outlook turned neutral (RSI = 46.626, MACD = -0.001, ADX = 48.052) as it is trading on the strongest 1D green candle since March. The 1D RSI bullish divergence (HL) shows a short term momentum shift and the price can now target 1D MA100 and the top of the Channel Down. We estimate at least a +50.35% rise from the bottom (TP = 0.01900).
## If you like our free content follow our profile to get more daily ideas. ##
## Comments and likes are greatly appreciated. ##

LDOUSD About to break the MA50 (1d). Get ready to buy!LDOUSD is testing the MA50 (1d) as we speak. This Resistance level hasn't been broken since July 25th (2 months).
Despite trading inside a Channel Down, every MA50 (1d) bullish cross has completed uptrends of at least + 39.12%.
Trading Plan:
1. Buy on the slightest crossing over the MA50 (1d).
Targets:
1. 1.9350 (almost +39.12% aimed at the MA200 (1d)).
Tips:
1. The RSI (1d) is on a Rising Support while the price traded on a Falling Support, flashing a big bullish divergence. This can be the signal that breaks the Channel Down to the upside.
Please like, follow and comment!!

BICOUSD Massive pump but buy on the next pullbackBICOUSD is having a strong push that naturally turned the 1D technical outlook overbought (RSI = 75.371, MACD = 0.002, ADX = 39.812). By doing so it hit the 1D MA200 for the first time in almost five months. We are not buying into this pump yet as the 1W MA50 looms (rejected the April 8th high) as well as the Resistance Zone. The 1D MACD is below 0, suggesting that there is still high upside potential, so we will buy after a rejection near 0.2500 and target the top of the Falling Wedge (TP = 0.3500).
## If you like our free content follow our profile to get more daily ideas. ##
## Comments and likes are greatly appreciated. ##
