GRTUSDTThe targets are close and they are now in the price equilibrium areas, and do not forget to place the stop loss
Cryptos

Long Trade Bitcoin Straight forward triangle here , wait for 4hour to close above resistance line , with a breakout in volume aswell.
Stop loss- 23100
4h RSI coiling up and creating divergence.

Still strong and going no whereHoping that it will break up soon
As the 1 hour rsi is oversold with moving avrage going down and down

The Rug Game (Re-upload)From the creator of CULT DAO we now have the THE RUG GAME.
The chart we currently looking at today is the governance token TRG.
Buy signal 4hour candle close above resistance and break of the triangle , money flow coming up.
Targets - who knows its at 3 million dollar market cap ,most likely 10 million
coinmarketcap.com
Previous TA was taken down because i posted a "private invite only indicator" that is against the house rules

NEAR/USDT AnalysisApparently NEAR has broke its bullish channel and forming up small correction on top of it. As well as ETH and BTC have broke it's quite affective resistance, NEAR could follow up much stronger. Personally I think it is able to go up 10% easily.

BTC Eliott Wave Corrective Pattern🚨⚠️BTC ALERT, IMPORTANT CHART 12HR,
Currently forming an Eliott Wave Corrective Pattern! (A) = 21,000 / (B) 23,600 / (C) 18000.

Bitcoin - BTC 🟢step 1 is done 🟠step 2 in progressBitcoin
Using RSI & SMA delta Indicator by MarcoValente (changed settings)...
🟢step 1 is done
🟠step 2 in progress (close above 0.50)
Next BTC bullish run ahead dear Crypto Nation❓🚀
Let me know your thoughts in the comments🤗
⬇️⬇️⬇️
Likes and Follow for updates appreciated🤗
Disclaimer:
Not financial advice
Do your own research before investing
The content shared is for educational purposes only and is my personal opinion

BTC Bullish?Can BTC hold the 23k?
for this speaks 0.618 Fib, volume profile, rising volume.
Personally, however, I assume that we will move even lower before we jump in the direction of 30K.
If I had to name a price, my guess would be between 21,450 and 21,850

BTC / ETH / HEX WEEKLY LOOK! WHAT's NEXT?BTC - INSIDE Day , Possible reversal on the week (21K target).Will 20K be retested??.. Next Target upside $25300 area needs to break and hold.
ETH - INSIDE Day , Possible reversal on the week ($1450 target)... Next upside Target $1750 area needs to break and hold.
HEX - 2 Down Day , Possible reversal on the week... Will 0.05 Cents hold? Next upside Target 0.073 needs to break. PULSECHAIN NEWS will help this coin keep raising. This asset has relative strength from BTC/ETH.
What's Next? Wait for the Daily Candle to tell US!
Best of luck in your Trades..
DISCLAIMER: This video is for entertainment purposes only.

What will happen to MATIC after leaving the $1 penny Crypto areaWhat will happen to MATIC after leaving the $1 penny Crypto area❓
The Renko Chart shows that Polygon is at an important support line🟩
Chances for a bullish breakout confirmation are good IMO🚀
Let me know your thoughts in the comments🤗
⬇️⬇️⬇️
Likes and Follow for updates appreciated🤗
Disclaimer:
Not financial advice
Do your own research before investing
The content shared is for educational purposes only and is my personal opinion

DXY - Will US Dollar history of 1981 repeat? 🔲DXY
Will the USD find support at this important monthly line🔲and history of 1981 repeat with a bullish run⁉️🚨
Personally I don't expect that due to the parabolic $-M1 Supply
But what are your thoughts on that dear #Bitcoin and Crypto Nation?
Let me know your thoughts in the comments🤗
⬇️⬇️⬇️
Likes and Follow for updates appreciated🤗
Disclaimer:
Not financial advice
Do your own research before investing
The content shared is for educational purposes only and is my personal opinion

Financial Wave. XRPXRP continues to decline in wave 2 and in our view this wave is almost complete. Our priority scenario remains the same: A rise in wave 3 could take the Ripple price to $0.42201. If XRP price goes below $0.37105, this scenario will be cancelled.

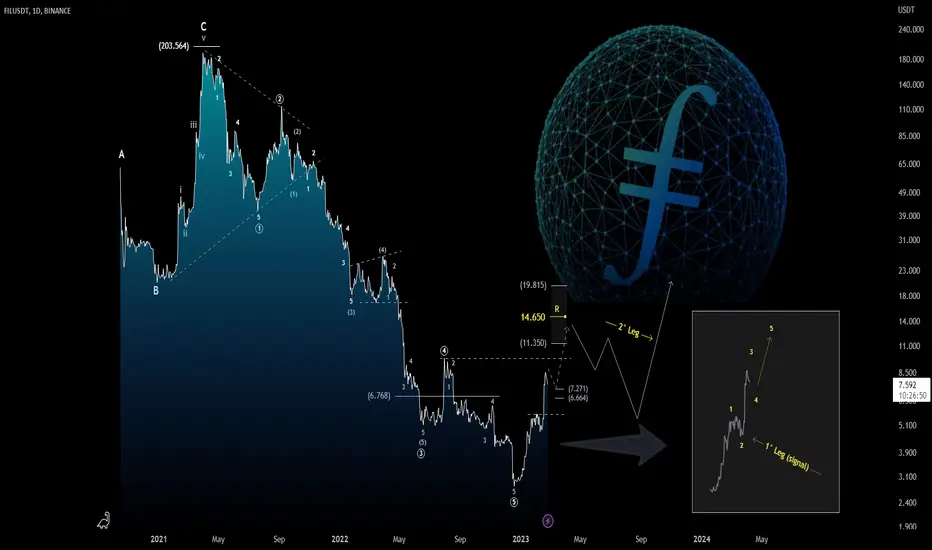
Filecoin ($FIL): Technical Analysis on Daily ChartHi everyone!
From a technical point of view, the trend on the daily chart is absolutely bearish, but at the same time, with the completion of the bearish impulsive structure (12345), I do not exclude the continuation of the corrective structure (bullish) in play. At the moment we do not have a confirmed bullish signal yet, but if in the short term we manage to trigger another bullish leg before the pullback, the trend could turn bullish again in the medium term. Technically speaking, in the short term, we have a support area around 7.26/6.66 and if $FIL is to turn bullish, it should be held.
Trade with care! 👍 ...and if you think that my analysis is useful, please..."Like, Share and Comment" ...thank you! 💖
Cheers!
N.B.: Updates will follow below
$QOMWETH Shiba Predator QOM is the Shiba Predator, it is a community token whose function is to flip the Shiba Market cap.
The live Shiba Predator price today is $1.02e-7 USD with a 24-hour trading volume of $4,162,720 USD. We update our QOM to USD price in real-time. Shiba Predator is up 30.55% in the last 24 hours. The current CoinMarketCap ranking is #381, with a live market cap of $61,291,329 USD. It has a circulating supply of 599,886,333,333,333 QOM coins and a max. supply of 1,000,000,000,000,000 QOM coins.

Bitcoin ($BTC): Price Action Analysis & Forecast in medium-termHi everybody!
In recent months my view on Bitcoin has not changed and only technical analysis will tell me "if and when" to change my mind. Well, as mentioned in our latest weekly analysis, the approach to the resistance area (Pivot + MA200) was expected, so we are not surprised by the rally triggered during yesterday's session. In support of this analysis, the Market Cap Index (TOTAL2) also seems to prove us right (see chart below), even if at the moment, on weekly chart, the trend is bearish, yet. Another interesting element is to see "how" $BTC triggered this bullish leg from 15,000 (that's why I don't use indicators or oscillators in my analysis). Today and in the next sessions, my supporters and I will continue to follow the dynamics on lower time frames (daily and intraday chart) in search of the next swing that should push the Price Action towards a consolidation. From a technical point of view, I think it is much more important to follow the opening of the next weekly bar than the closing of this candle....but this is just my opinion...
TOTAL MARKET CAP ANALYSIS
(Click & Play on Chart below)
BULLISH LEG from 15,000 AREA
(Click & Play on Chart below)
Trade with care! 👍 ...and if you think that my analysis is useful, please..."Like, Share and Comment" ...thank you! 💖
Cheers!
N.B.: Updates will follow below

