#LRC Ready for a Massive Recovery From Here | Must Watch Yello, Paradisers! Is #LRCUSDT finally ready for a breakout, or is it just another trap for early bulls? Let's break down the current structure of #LRC.
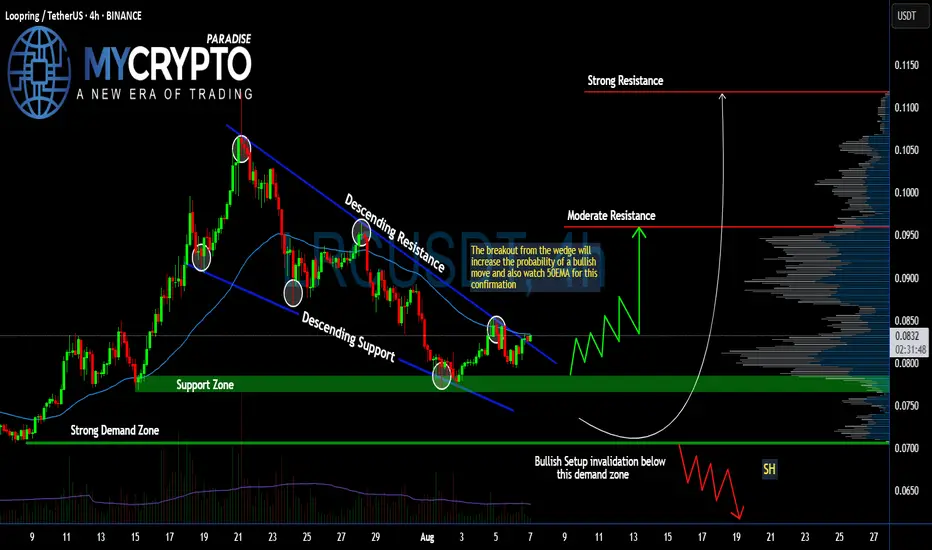
💎#Loopring ( CAPITALCOM:LRC ) has been moving within a descending wedge pattern for weeks, with price consistently making lower highs and lower lows—clearly respecting both descending resistance and support levels. However, we are now starting to see signs of change as it retests the upper trendline.
💎A breakout above the descending resistance is about to occur, and it’s doing so right around the 50EMA, which adds further confluence for a possible bullish move. This move is increasing the probability of a short-term trend reversal.
💎The support zone around $0.078–$0.082 is the key region to watch now. If bulls can hold above this zone and reclaim it as a base, we could see a breakout continuation toward the moderate resistance at $0.096. Should momentum build up from there, the next big target is the strong resistance at $0.1118—a level marked by historical seller interest and significant volume profile resistance.
💎However, if #LRCUSD falls below the strong demand zone at $0.0706, this entire bullish setup becomes invalid. That breakdown would suggest the market isn't ready yet, and could trigger another wave down toward fresh lows.
Stay patient, Paradisers. Let the breakout confirm, and only then do we strike with conviction.
MyCryptoParadise
iFeel the success🌴
Cryptosignals
AVAX Has Been Quiet for Too Long! Don’t Miss What Comes NextYello, Paradisers! Have you been ignoring #AVAX because of its sideways chop? That might be a costly mistake, because what’s forming now could be the foundation of a major trend reversal that catches most traders completely off guard.
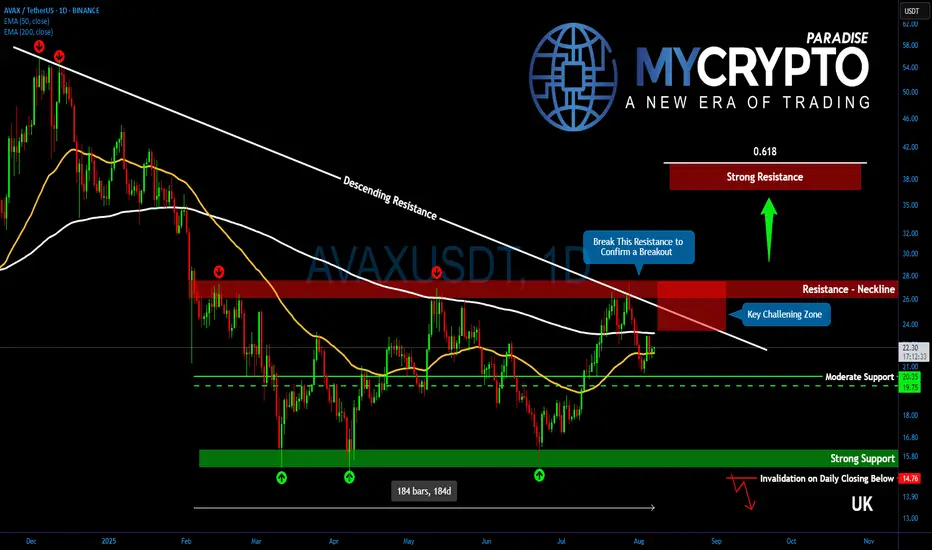
💎After an extensive downtrend, AVAX has been trading sideways for nearly 184 days, signaling the market is in accumulation mode. This long consolidation is beginning to take shape as a possible reversal base, and when it breaks, it could break hard.
💎Right now, #AVAXUSDT is battling a complex resistance zone between $23.50 and $27. This region is packed with overlapping technical barriers, many of which date back to December 2024, adding to its significance. It's a make-or-break zone.
💎Once $27 is broken with strong volume confirmation, the stage will be set for a powerful breakout, with upside potential targeting the next major resistance between $36 and $39.20. This zone aligns perfectly with the 61.8% Fibonacci retracement, which is historically where larger moves tend to conclude or stall.
💎On the downside, support remains solid between $20.30 and $19.75. This band has been a reliable support/resistance flip during the range and continues to act as the primary defense zone.
💎Adding fuel to the bullish outlook is the potential golden cross formation between the EMA 50 and EMA 200. If this confirms, it would add serious momentum to any breakout and attract trend-followers back into the market.
Paradisers, strive for consistency, not quick profits. Treat the market as a businessman, not as a gambler.
MyCryptoParadise
iFeel the success🌴
ADA Just Broke Out... But Will It Hold or Collapse From Here?Yello Paradisers, are you ready for what Cardano is about to do next? After weeks of being trapped in a falling wedge, #ADA has finally broken out and this move could either be the start of something big or just another fakeout to trap late buyers.
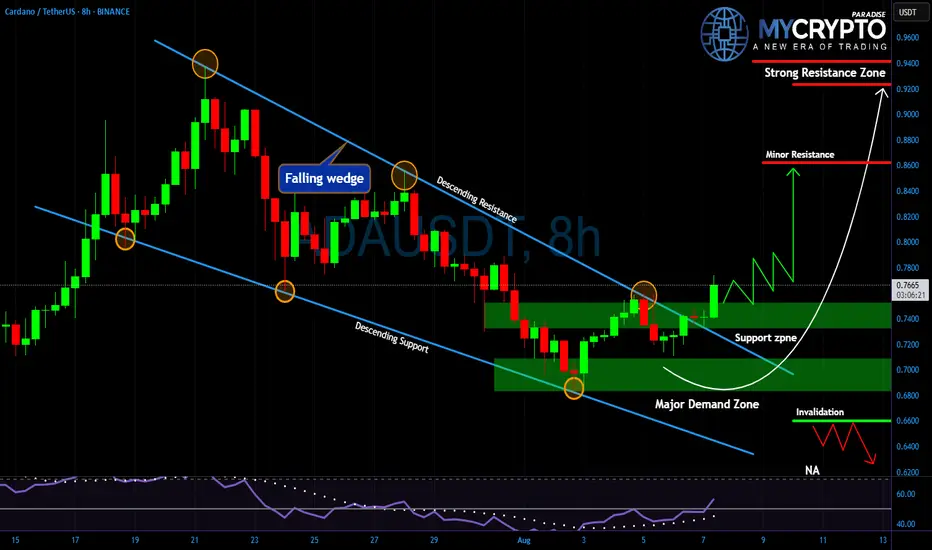
💎Price has now closed above the descending resistance, confirming the breakout of the falling wedge structure. The 0.7300–0.7450 zone is currently acting as the first area of support. This level needs to hold in order to maintain bullish momentum, or the entire setup could be invalidated. Below that, the major demand zone between 0.6700 and 0.7100 remains critical if #Cardano slips into that range, we’ll be watching for either a bounce or signs of a deeper breakdown.
💎On the upside, the first short-term target sits at 0.8600 where minor resistance is expected, but the real battle will take place between 0.9300 and 0.9500 a strong resistance zone where many traders will be looking to take profits or re-enter shorts. Momentum indicators are showing early strength, with RSI recovering and confirming renewed buyer interest.
💎If bulls can maintain control above the breakout zone, #ADA could enter a healthy consolidation phase before launching into the next leg up. However, a drop below 0.6600 would completely invalidate the current structure and shift the bias back to the downside so risk management remains essential here.
🎖Strive for consistency, not quick profits. Treat the market as a businessman, not as a gambler.
MyCryptoParadise
iFeel the success🌴
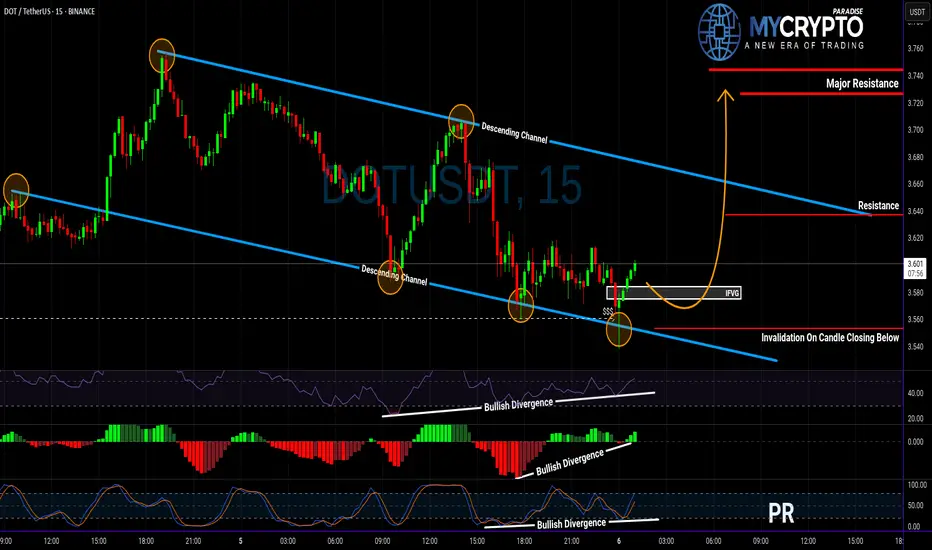
DOT About to Explode or Collapse? Read This Before Entering!Yello Paradisers, are you watching DOT closely? Because this setup could either give aggressive traders a golden entry—or wipe out the impatient ones 👀
💎DOTUSDT is showing strength after sweeping liquidity and now sitting right at the supportive trendline of its descending channel. What’s catching our attention is the clear bullish divergence on RSI, MACD, and Stoch RSI, which together boost the probability of a bullish breakout from here.
💎If we get a pullback, the IFVG zone (Inverse Fair Value Gap) below offers a clean setup for a high RR (risk-to-reward) trade. That would be a more strategic entry for patient traders. But for those who trade more aggressively, the current price is already offering a decent RR setup—just remember, this is not advisable for beginners. Patience and discipline remain key, especially in uncertain zones like this.
💎However, if DOTUSDT breaks down and closes a candle below our invalidation level, the bullish scenario is completely off the table. In that case, the smartest move is to step aside and wait for better confirmation before making any decisions.
🎖Strive for consistency, not quick profits. Treat the market as a businessman, not as a gambler.
MyCryptoParadise
iFeel the success🌴
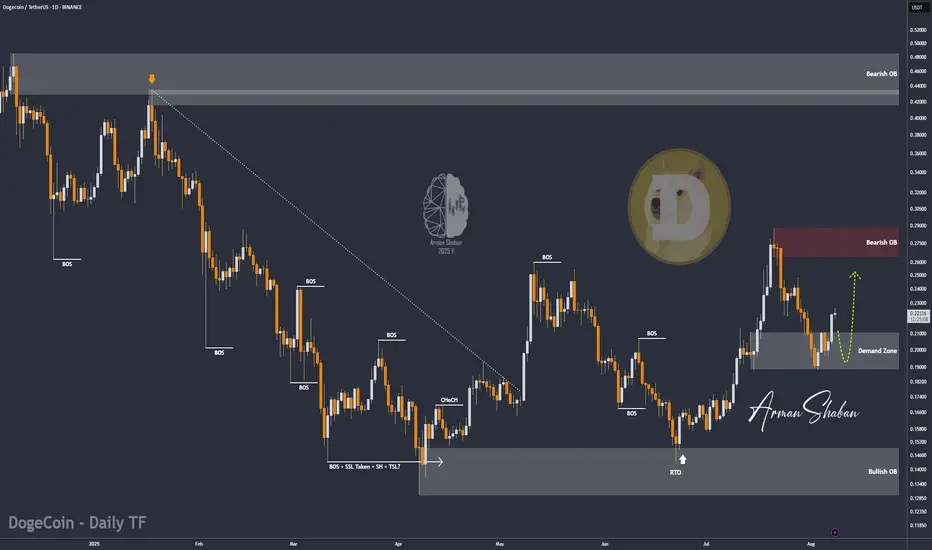
DOGE/USDT | DOGE Up 20% – Next Targets: $0.24, $0.287 & Beyond!By analyzing the Dogecoin chart on the daily timeframe, we can see that, as expected, the bullish reaction has continued, and DOGE is now trading around $0.226. This analysis has delivered over 20% returns so far. The next targets are $0.24, $0.287, $0.32, $0.41, and $0.70. Hope you’ve made the most of this move, and stay tuned for the upcoming updates!
Please support me with your likes and comments to motivate me to share more analysis with you and share your opinion about the possible trend of this chart with me !
Best Regards , Arman Shaban
Bitcoin Ready for Takeoff - $150K Target Ahead! MARKETSCOM:BITCOIN is showing impressive strength after successfully retesting its May high and bouncing back with conviction. This level, along with the 50 EMA, is currently acting as a strong support zone. Holding above this area signals that buyers are in control, and this zone now serves as a major support for the ongoing bullish trend.
At the moment, CRYPTOCAP:BTC is facing minor resistance in the $115K–$116K range. A decisive breakout above this level is likely to trigger strong momentum, opening the doors for a new all-time high. Once this resistance is cleared, our previous projection of $150K comes into play as the next major target.
For now, it’s crucial for MARKETSCOM:BITCOIN to hold the current support zone to maintain the bullish structure. As always, traders should manage risk effectively and place stop-losses to protect their capital in case of unexpected volatility.
Follow Our Tradingview Account for More Technical Analysis Updates, | Like, Share and Comment Your thoughts

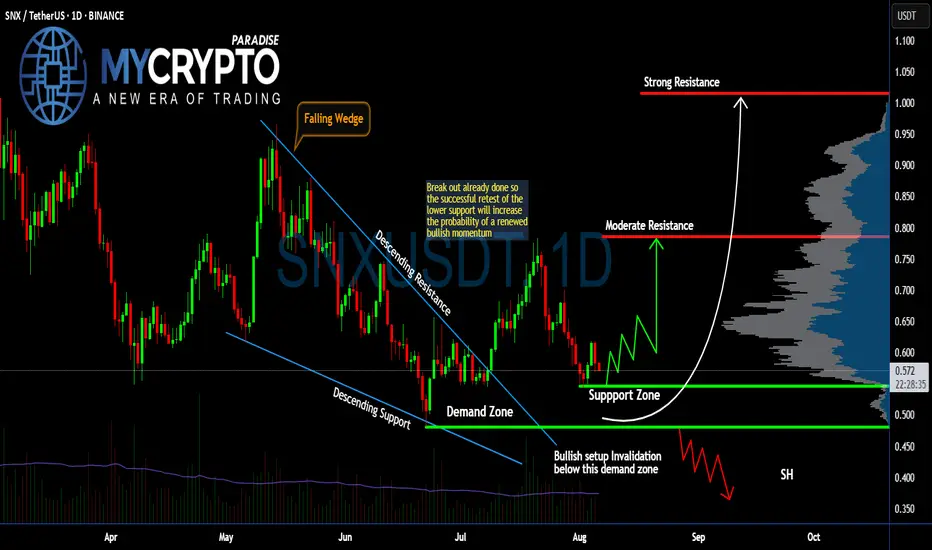
Can #SNX Bulls Sustain the Current Momentum? Watch it CloselyYello, Paradisers! Is this #SNX setup just another fakeout in disguise, or is the market quietly setting up for a major bullish momentum shift? Let’s dissect what’s really happening on #SNXUSDT:
💎After moving through a falling wedge pattern for months, #Synthetix has already broken out above the descending resistance, signaling an early shift in trend. However, the real move hasn’t yet begun—a proper retest of the support zone between $0.50–$0.54 is what we’re watching for now.
💎This support zone aligns with the prior wedge breakout and also overlaps with a visible demand area, making it a key region where buyers could step in again. If bulls defend this area successfully, we expect a renewed rally toward the moderate resistance level at $0.78.
💎From there, the next upside target lies at the strong resistance around $1.01—a level with heavy volume profile resistance and previous seller activity. But that level will only come into play if the bulls reclaim momentum with conviction.
💎On the flip side, if #SNXUSD breaks below $0.48, which is our bullish invalidation level, the setup collapses and opens the door for a deeper drop toward the $0.40–$0.35 zone, where short-sellers are likely to pile in.
Stay patient, Paradisers. Let the breakout confirm, and only then do we strike with conviction.
MyCryptoParadise
iFeel the success🌴
TLM Ready for Breakout or Breakdown?Yello Paradisers, are you ready for what could be the final squeeze before TLM makes its next big move? After weeks of bleeding inside this descending channel, the price is now pressing hard against the upper boundary and a decision is coming fast.
💎#TLMUSDT has bounced from a clear support zone around $0.00470 and is currently showing bullish signs with a confirmed break of structure. But for any continuation to the upside, we must see a clean breakout above the descending resistance now acting as the barrier around the $0.0049–$0.0050 area. If that happens, there’s a clear path toward the minor resistance at $0.0056, and potentially a full swing toward the strong resistance zone near $0.0062.
💎However, if #TLM gets rejected here, the price is likely to revisit support, and any break below $0.0042 would invalidate the current bullish setup and confirm weakness returning to the market.This is not the time to trade emotionally. The chart is giving us a clear structure and until the breakout is confirmed, anything else is just noise.
Stay focused, wait for the confirmation, and trade like a pro.
MyCryptoParadise
iFeel the success🌴

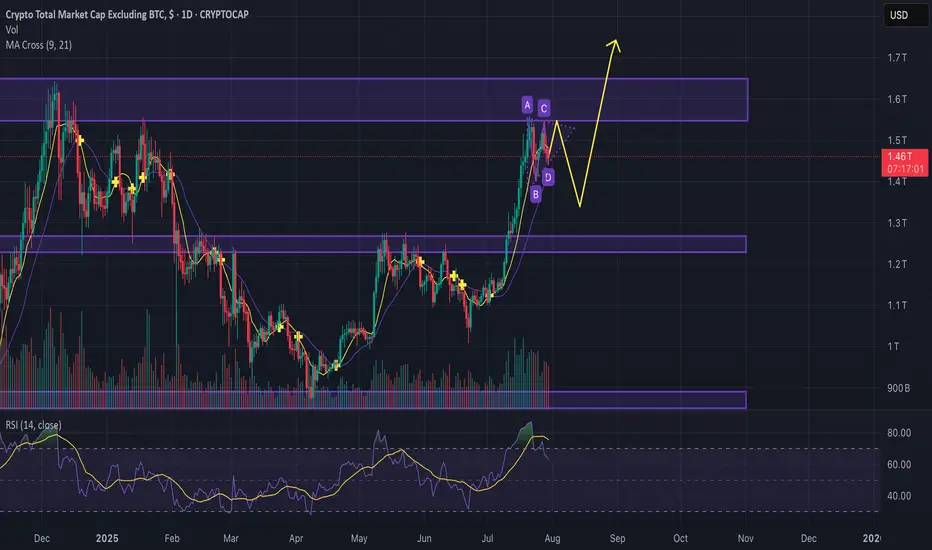
Altcoins Recovering: TOTAL3 Bounces from Key Support ZoneIn my previous analysis on TOTAL3, I mentioned that I'm working with two possible bullish scenarios for altcoins. It now seems we're firmly in Scenario #2.
📉 The price dropped exactly into the highlighted support zone, then yesterday we saw a clean recovery and reversal starting right from that area — a textbook technical reaction.
📈 At the time of writing, TOTAL3 sits at $986B, and a break above the $995B–$1T resistance could trigger a new leg up for altcoins.
🎯 Short- and mid-term targets remain:
• $1.08T (recent top)
• $1.15T
• Potential for new all-time highs if momentum builds
✅ As long as price holds above the $920–$930B support zone, bulls remain in control. This keeps the door open for selective altcoin entries — ideally, projects with real structure, strong tokenomics, and clear momentum.

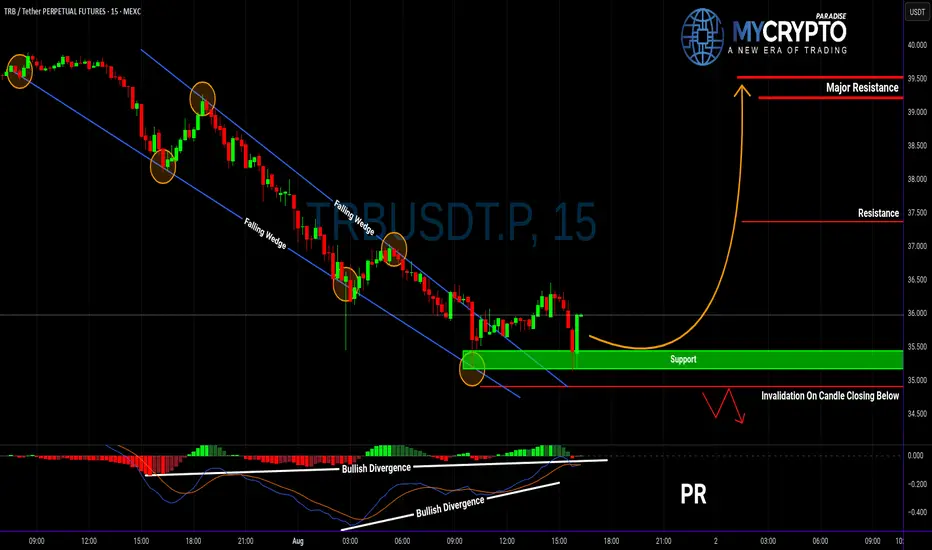
TRBUSDT at Major Decision Point: Breakout or Breakdown Ahead?Yello Paradisers! Is TRBUSDT quietly setting up for a bullish breakout, or is it luring in early buyers before a harsh reversal? With price action unfolding near a key support zone, hidden bullish divergence forming, and the structure still technically intact, it’s time we pay close attention before making any decisions.
💎Currently, TRBUSDT remains in a bullish market structure and is trading near an important support area. Price action is also following a well-defined resistance trendline, which continues to limit upside moves. The presence of hidden bullish divergence suggests potential underlying strength, and this area could act as a springboard for the next move up. However, the lack of volume and broader market indecision means this is a zone where both opportunity and risk are high.
💎Given this context, consolidation is very likely here. For more conservative traders, it would be wise to stay patient and let the structure play out before entering. This is not the time to rush into trades without confirmation. For more aggressive traders, there may be intraday opportunities around this support zone, particularly on lower timeframes, but this approach requires strict risk management. Beginners are strongly advised to avoid trading on lower timeframes at this stage, as the price action remains highly reactive and misleading moves can occur easily.
💎If the price builds a fresh bullish structure from this level, it would significantly increase the probability of continued upside. The current zone also offers favorable risk-to-reward potential, with setups delivering more than a 1:3 ratio. That said, if the price breaks down and closes candle below the defined invalidation zone, our bullish outlook becomes invalid. In that case, the best course of action would be to step aside and wait for a new structure to form, rather than trying to force entries in uncertain conditions.
🎖Strive for consistency, not quick profits. Treat the market as a businessman, not as a gambler. Stay focused on high-probability setups, protect your capital, and let the market come to you. That’s the only path to long-term success in this game.
MyCryptoParadise
iFeel the success🌴

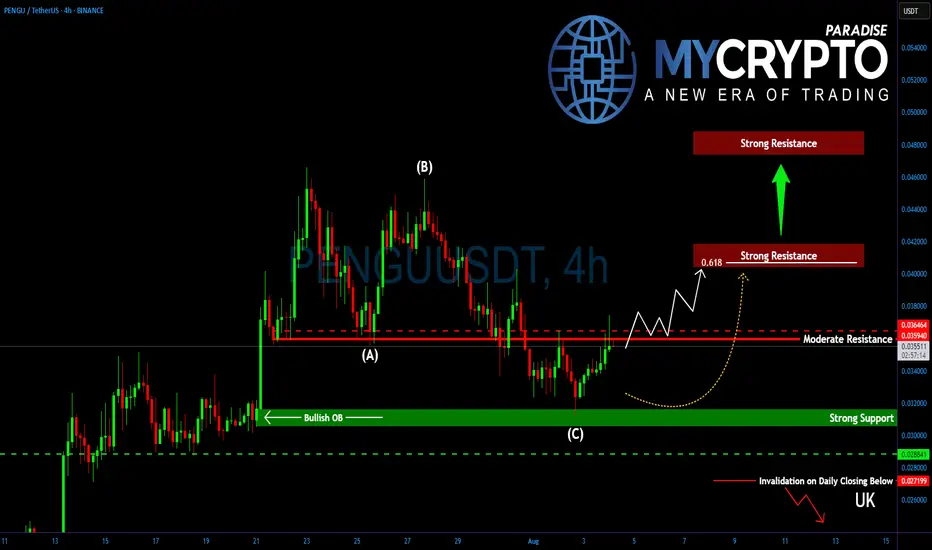
Is PENGU About to Explode or Fake Out Everyone Again?Yello, Paradisers! Have you been watching #PENGUUSDT after its recent dip? Because if you haven’t, you might be missing out on a potentially explosive setup forming right now…
💎After placing a major high around $0.0460, PENGU entered a textbook ABC corrective wave. But that correction looks to be over now, and what’s emerging could be the beginning of a powerful bottoming structure.
💎#PENGU is currently facing a critical short-term resistance at $0.0360–$0.0364, a level that bulls must flip to ignite a stronger recovery. If they succeed, all eyes shift toward the 61.8% Fibonacci retracement at $0.0405, a major confluence level that aligns with a key horizontal resistance between $0.0405 and $0.0415. Expect heavy action here. Bulls will likely face real pressure at this zone.
💎However, and this is where it gets interesting, if PENGU breaks above $0.0415 with strength, then momentum could pick up fast, paving the way for a fresh rally towards new yearly highs between $0.0480–$0.0494.
💎On the flip side, support remains solid between $0.0312 and $0.0302. This zone isn’t just an ordinary support, it also holds a bullish order block (OB), offering extra protection and confluence. This is where the market is quietly showing signs of strength while the majority are distracted elsewhere.
Paradisers, strive for consistency, not quick profits. Treat the market as a businessman, not as a gambler.
MyCryptoParadise
iFeel the success🌴
ETH/USD – Critical Reversal Zone?
### 🚀 ETH/USD – Critical Reversal Zone?
**🔍 ETH Futures Multi-Model Signal | Consensus: LONG | Confidence: 77%**
---
**🧠 Key Highlights (DS + OA Model Consensus):**
* **Price:** \$3,375 → Trading *below* EMA9/SMA20 = short-term bearish, but hitting strong **support zone**
* **Support:** \$3,248 (Bollinger Lower) & \$2,987 (SMA50)
* **Resistance:** \$3,487 (EMA21), \$3,620 (SMA20)
* **Volume:** -10.3% (5D) → Selling **weakening**
* **RSI:** 49.5 → Neutral but oversold on short-term
* **MACD:** Bearish crossover, but showing **divergence**
* **Volatility:** Bollinger width 9.18% = **Breakout Setup**
---
### 📈 Trade Setup – Conditional LONG
| Entry | Stop Loss | Target | R/R | Confidence |
| ------- | --------- | ------- | ------ | ---------- |
| \$3,375 | \$3,229 | \$3,690 | 1:3.24 | 77% ✅ |
🪙 **Trade Type:** Scale-in (50% @ \$3,375, 50% @ \$3,275)
📊 **Take Profits:**
* TP1: \$3,485 (EMA21)
* TP2: \$3,590 (SMA20)
* TP3: \$3,690 (Weekly VWAP Anchor)
---
### ⚠️ Risk Dashboard
* 🚨 BTC < \$58K → Setup invalid
* 📉 No Open Interest Data – monitor liquidation triggers
* 🧠 Max Position Risk: **1.25%** | Use hard stop-loss
* ⏰ Entry Timing: **London Open (8:00 GMT)**
---
### 💬 TL;DR
ETH is sitting in a **high-confluence reversal zone**. Weak sell volume, macro bullish trend, and volatility contraction signal a potential bounce. 📊 **Risk-defined long** setup favored by both models.
🧠 “Smart money doesn’t chase — it positions early.”
---
📌 **#ETH #CryptoTrading #ETHUSDT #Futures #BreakoutSetup #BollingerBands #MACD #RSI #DeFi #Ethereum #CryptoSignals #TradingView**

BTCUSD – Is the Correction Over? Key Support Holding so FarLast week was a red one for Bitcoin, with price declining day after day, and losses accelerating into Thursday and Friday.
However, yesterday’s low around 112K landed perfectly at a strong confluence support: a key horizontal level aligned with the ascending trendline from April.
Despite the drop, the broader structure remains firmly bullish. So far, this move looks like a normal correction within an uptrend — nothing more.
Looking ahead, I expect a reversal from this support. If bulls can reclaim the 117.5K–118K zone, the path toward a new all-time high opens up again.
🔍 Bias: Bullish
🎯 I consider this current level a good swing trade opportunity, with at least a 1:2 risk–reward potential.

Is TRBUSDT About to Explode or Fake Out Everyone Again?Yello Paradisers! After weeks of quiet price action, is TRBUSDT finally gearing up for a real breakout—or is this just another trap before the next leg down? Let’s break it all down, because the next move could catch many traders on the wrong side.
💎TRBUSDT has recently broken out of a falling wedge pattern, accompanied by a clear bullish divergence—an encouraging sign that momentum may be shifting in favor of buyers. This type of setup historically carries a higher probability of a bullish move, especially if the breakout holds above key support levels. However, the entry strategy here is critical.
💎Ideally, we want to see a minor pullback. If that happens, it could offer a solid bounce opportunity from well-defined support zones, giving a favorable risk-to-reward setup. This is the scenario where patient traders will find the highest probability entries. On the other hand, aggressive traders might consider entering from current levels, but they must understand that doing so offers a less favorable risk-to-reward ratio. Jumping in too early without a clear confirmation could expose you to unnecessary risk, especially if the market reverses quickly.
💎More importantly, we have a clearly defined invalidation level. If TRBUSDT breaks below that level and closes a candle beneath it, this would invalidate the current bullish setup completely. In such a case, the best course of action would be to step aside and wait for a new structure or more reliable price action to form. Forcing trades in uncertain territory is how capital is lost and confidence shaken.
Strive for consistency, not quick profits. Treat the market as a businessman, not as a gambler. Protecting your capital and waiting for high-probability opportunities is what separates professional traders from the rest. Patience here could be the difference between a calculated win and a costly mistake.
MyCryptoParadise
iFeel the success🌴
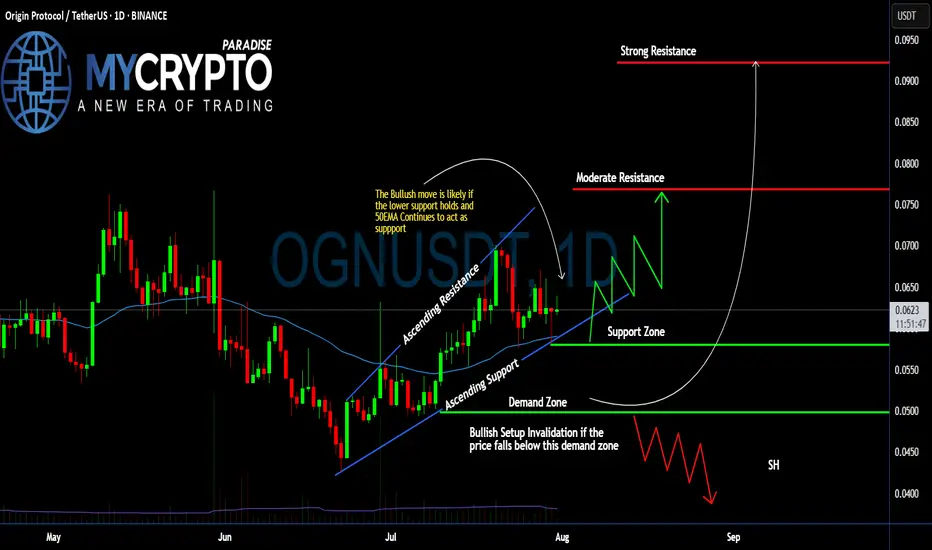
#OGN Ready For a Massive Bullish Move | Must Watch For BullsYello, Paradisers! Is #OriginProtocol about to explode to the upside, or is this a bull trap in disguise waiting to liquidate the impatient? Let’s break down what’s brewing on #OGNUSDT:
💎After forming a clean ascending channel, #OGN has been respecting both the ascending resistance and ascending support levels. Price is currently trading just above the 50 EMA, which has been acting as a dynamic support line since early July. This structure shows clear buyer interest around the $0.058–$0.062 zone—an area that aligns with volume cluster support.
💎The bullish scenario remains valid as long as #OGNUSD holds above the demand zone between $0.0499–$0.0580, and especially if it stays above the 50 EMA. As long as this structure is maintained, we could see a bounce toward the moderate resistance level at $0.076, where previous sellers stepped in and price stalled.
💎If buyers can break through that moderate resistance with strength and rising volume, the next key target lies at $0.092, which aligns with a strong resistance level and high-volume node on the visible range. This area is likely to trigger a reaction, so traders should remain agile.
💎However, if price breaks down below the demand zone, this would invalidate the current bullish setup and open the door for a potential move back toward the $0.045–$0.040 area. A broader shakeout would likely accompany this and could trap many late long entries.
Stay patient, Paradisers. Let the breakout confirm, and only then do we strike with conviction.
MyCryptoParadise
iFeel the success🌴
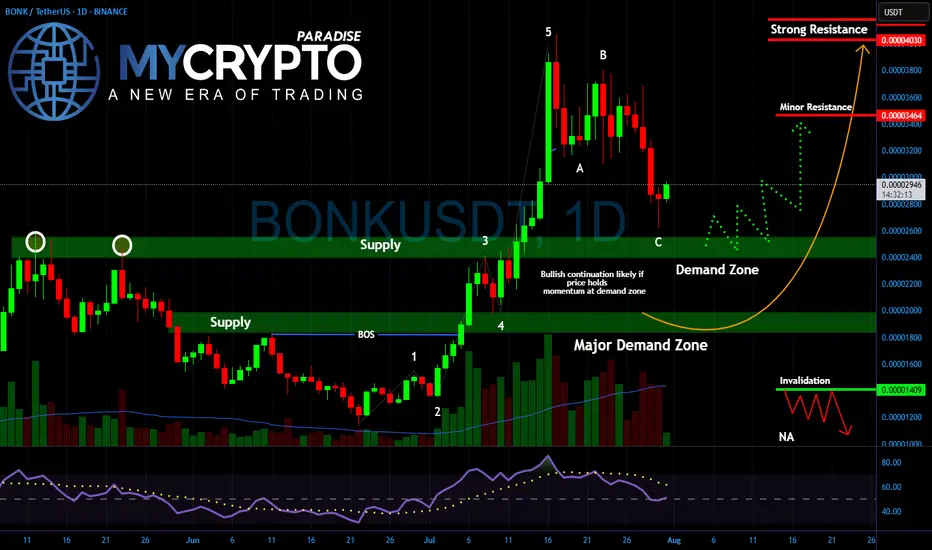
BONK About to Break Out or Break Down?Yello Paradisers! Are you ready for the next explosive move in #BONK? After nailing the last rally and spotting the impulsive 5-wave structure early, we’re now entering a critical phase — and what happens next could decide whether BONK flies or collapses.
💎The recent pullback has followed a clean A-B-C corrective structure, landing perfectly into the key demand zone between 0.00002600 and 0.00002200. This zone now acts as the battlefield between smart money buyers and weak-handed sellers. Price action is slowing down, volume is drying up, and RSI is resetting all classic signs of a potential bullish continuation. But if buyers fail to step in with conviction, the market could easily sweep lower to test the major demand zone closer to 0.00001800.
💎As long as price holds this area and confirms a reversal with follow-through momentum, we could see #BONK heading back toward 0.00003460 as the first stop, and possibly a retest of the 0.00004030 resistance. However, if price closes below 0.00001409, that would invalidate the bullish setup and confirm a deeper corrective phase.
Patience and strategy win the game, Paradisers! The market is designed to shake out weak hands before the real move happens.
MyCryptoParadise
iFeel the success🌴
BINANCE COIN (BNBUSD): Bullish Continuation Ahead
BNB is going to resume growth after a retest of a recently broken structure.
A bullish breakout of a resistance line of a bullish flag provides a strong bullish confirmation.
I think that the price will go up to 844 level.
❤️Please, support my work with like, thank you!❤️

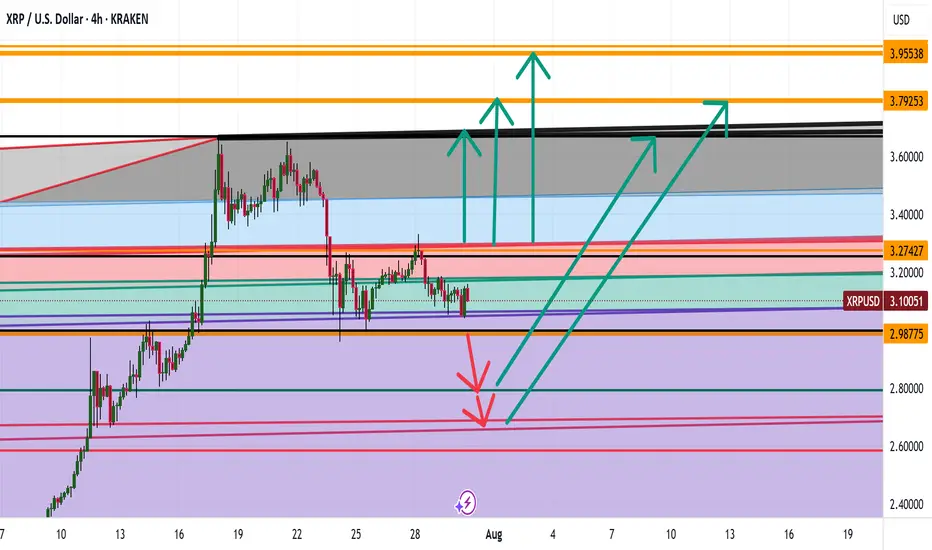
XRP WHERE ARE WE HEADED ? LEVELS TO LOOKOUT FORHey trading fam
So XRP is a fun one but based on BTC correcting and what we are seeing there are a couple thesis's that we currently have for it
Thesis 1: We break south from 2.98 lows: Levels to look out for:
2.80
2.70
2.68
Thesis 2: We break the highs of 3.29: Levels to look out for:
3.65
3.79
3.99
Trade Smarter Live Better
Kris
Is altcoin season over before it even started?Guys,
Gonna break down the situation on the chart to see where we can go next with the altcoins.
We see the key resistance levels and now we moving in kinda bullish pennant, but considering descending volumes we can easily test the support line and go back to the 1.25T. (maybe even lower)
After that, seems like we can try to go back and break the 1.64T resistance zone and previous ATH.
Anyway current market is going to be way more different from previous cycles, because huge institutions can feel nice only in hyper volatile, so divide your strategy between short, mid and long term investments to take profits.
Good trades and share your thoughts down to see what others think.
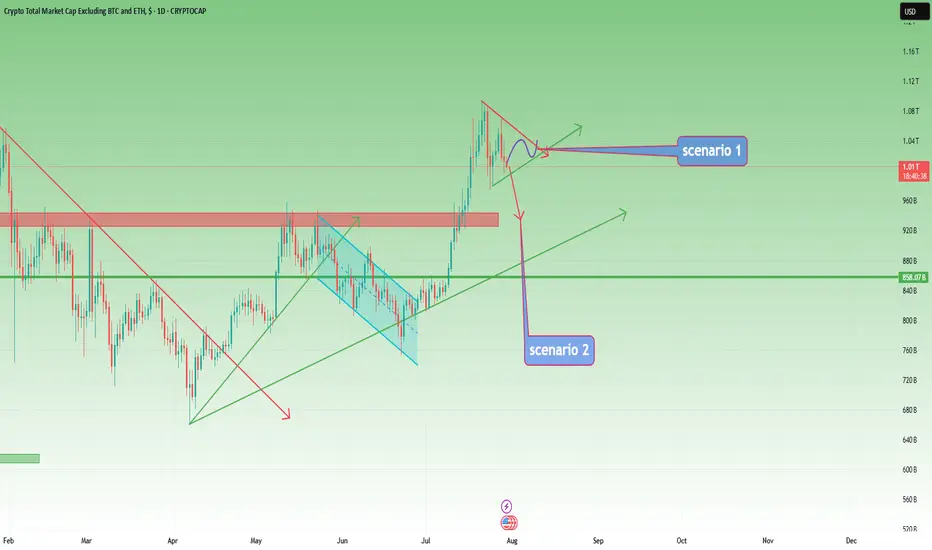
TOTAL3 – Still Bullish, But Waiting for Clarity
In my previous analysis on TOTAL3, I mentioned the high probability of a correction, but also noted that I didn’t expect the 925–940B zone to be reached.
And indeed, price reversed early — finding support around 975B before moving higher.
However, after a push up to 1.07T, the market has started to pull back again.
📊 Current Outlook – Two Scenarios I’m Watching:
Bullish Triangle:
Price may continue to consolidate into a symmetrical triangle, then resume the uptrend from there.
Deeper Pullback into Support:
The market could retest the 925–940B zone, a key support area, before bouncing back up.
⚠️ Bearish Reassessment?
Of course, if price breaks back below 925B and stays there, we’ll have to reconsider the bullish case.
But for now, the trend remains intact, and there’s no technical reason to panic.
📌 My Plan:
I already hold a bag of alts, and I’m not adding for now.
I’ll wait until the pattern becomes clearer — whether it’s a triangle breakout or a dip into support.
Until then, I’m sitting comfortably on what I already hold.
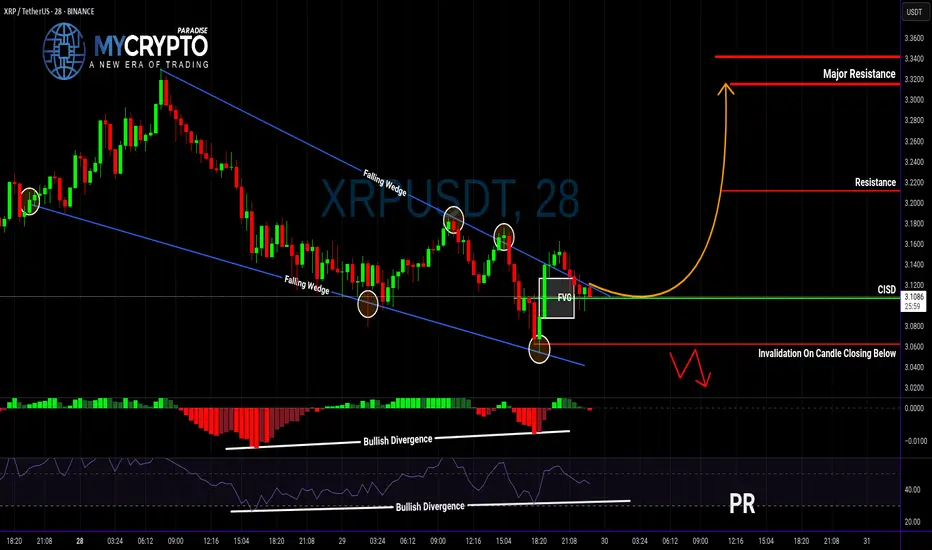
XRP Breakout Could Be a Trap… Or the Start of Something Big?Yello, Paradisers — are you about to buy into a fake breakout or position yourself right before a major move? Let’s break it down before emotions take over.
💎XRPUSDT has officially broken out of a falling wedge — a classic bullish reversal structure. What makes this breakout even more interesting is that it's supported by bullish divergence on both MACD and RSI, plus a Change In State of Delivery (CISD). All these technical signals combined significantly increase the probability of a bullish continuation.
💎Now, if you’re a disciplined trader looking for a safer entry with a higher risk-to-reward ratio, the smart move is to wait for a potential pullback to the CISD level. That would set up an opportunity offering a risk-to-reward of over 1:2.55 — not something you want to ignore.
💎But don’t get too comfortable…
💎If the price breaks down and closes below our invalidation level, the entire bullish idea is off the table. In that case, it’s wiser to stay patient and wait for clearer price action to develop. No emotional entries — only strategic moves.
🎖Strive for consistency, not quick profits. Treat the market as a businessman, not as a gambler. That’s how you’ll get inside the winner circle.
MyCryptoParadise
iFeel the success🌴
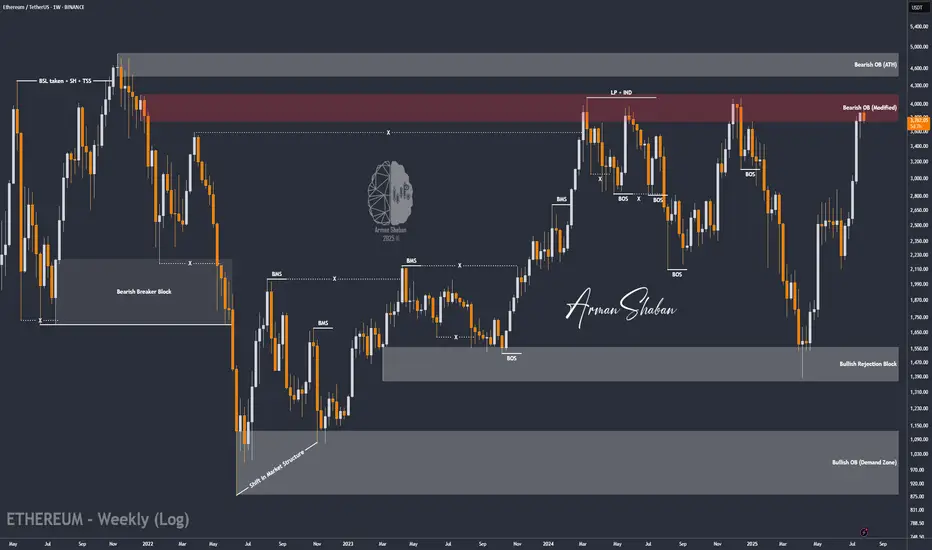
ETH/USDT | at a Crossroads – Hold Above $3440 or Sharp Fall!By analyzing the Ethereum chart on the weekly timeframe, we can see that after reaching $3940 and touching the key supply zone, ETH entered a slight correction and is currently trading around $3756. The key question now is whether it can hold above $3440 by the end of the week and push past $4000. If it does, we can expect another bullish leg toward $4100 and $4470. However, if the $3440 support fails, a sharp decline may follow — so this level is critical.
Please support me with your likes and comments to motivate me to share more analysis with you and share your opinion about the possible trend of this chart with me !
Best Regards , Arman Shaban
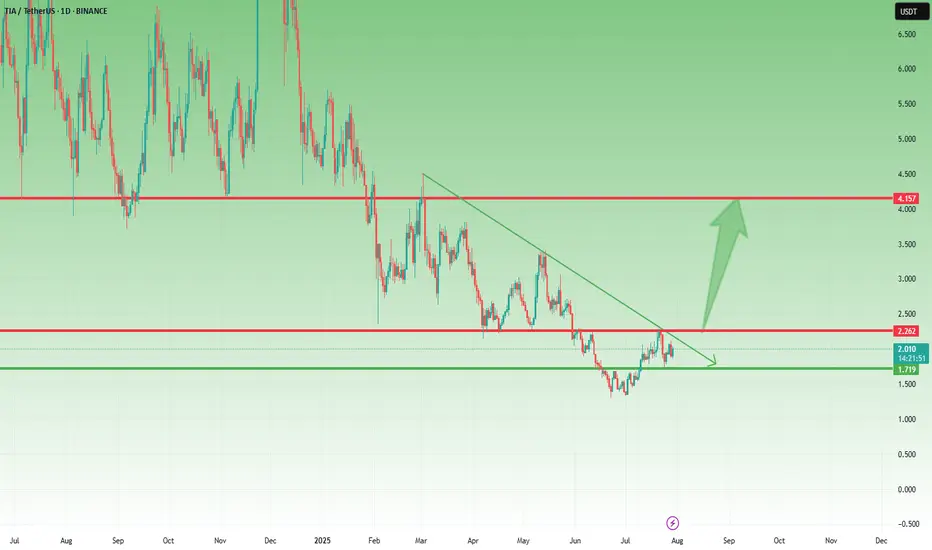
TIA Holding Support – Break Above $2.20 Could Trigger Big MoveLast week, I mentioned that TIA could be preparing for a move and that buying dips around $1.75 might be a good opportunity.
Well, price dropped exactly into that support zone, bounced slightly, and is now consolidating, which could be the calm before the next wave.
________________________________________
📌 Here’s what I’m watching:
• The $2.10–$2.20 zone is now a confluence resistance area (horizontal + descending pressure)
• A break and daily close above this level could trigger a strong leg up, with the next major target around $4.00
________________________________________
📈 Bias remains bullish
As long as $1.70 holds, this setup stays valid, and dips continue to be buyable.
________________________________________
🎯 Trading Plan:
• Looking to buy dips toward $1.80–1.85
• Acceleration expected only above $2.20
• Bearish invalidation only below $1.70
________________________________________
Conclusion:
TIA is respecting structure perfectly. If it breaks above $2.20, we could be looking at a potential double in price toward $4.