ETH Rejection Incoming? Don’t Fall for This Bull TrapYello Paradisers, are you watching how ETH is reacting right now at this key zone? This could either turn into a textbook bearish setup… or catch everyone off guard. Let’s break it down 👇
💎ETHUSDT is currently hovering at a critical resistance area, perfectly aligned with both a key Fibonacci retracement zone and the 200 EMA—classic confluence. What makes it even more concerning is the bearish divergence, which is strengthening the probability of a downside rejection from this level.
💎To add fuel to the fire, the price action has just taken liquidity (inducement) above the previous highs, another bearish signal that supports the idea of a potential reversal from here.
💎However, this bearish bias will be fully invalidated if ETH manages to break and close a candle above the resistance zone. That kind of price action would suggest strength from buyers and a likely continuation to the upside.
💎In that case, it’s wiser to stay patient and wait for a cleaner setup at a better price. Rushing into a trade at this stage, especially in a moment of indecision, is not how pros operate.
If you want to be consistently profitable, you need to be extremely patient and always wait only for the best, highest probability trading opportunities.
MyCryptoParadise
iFeel the success🌴
Cryptosignals

JASMY: Will You Catch the Breakout or Get Caught in the Trap?Yello Paradisers, did you catch the textbook pattern quietly forming on JASMY while most of the market remains distracted? Because what comes next could catch the majority off guard.
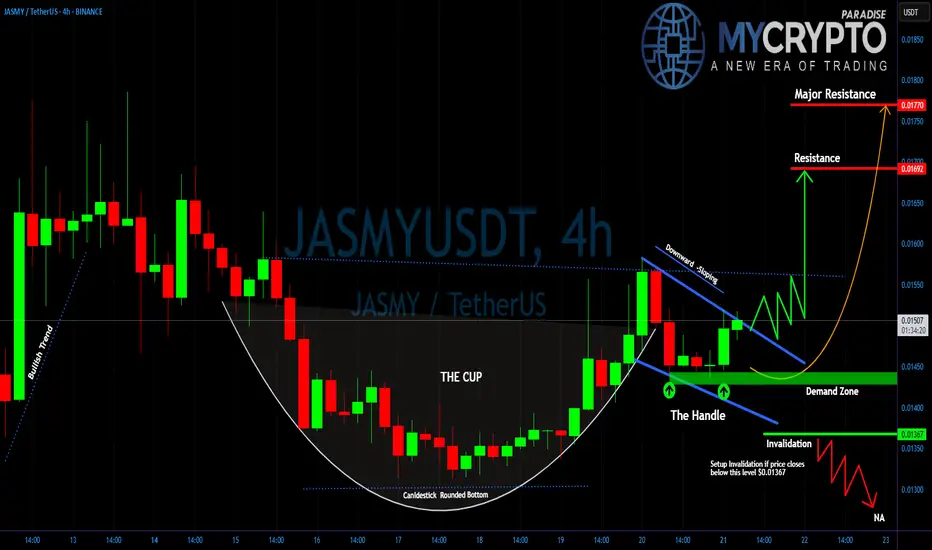
💎#JASMYUSDT is currently forming a classic Cup and Handle pattern. After a strong impulsive move, the price retraced in a rounded bottom structure, completing what now looks like the cup. The current consolidation has created the handle a downward-sloping corrective move that’s showing early signs of exhaustion.
💎What adds even more strength to this setup is that the price is now trading above both the 50 EMA and 200 EMA on the 4H timeframe. This signals a solid bullish bias and confirms that the overall momentum remains in favor of the bulls. When the price holds above both moving averages during a consolidation phase, it often indicates that a strong continuation move is brewing.
💎The price is also respecting a well-defined demand zone between 0.01430 and 0.01450. As long as this area holds, the probability of a bullish breakout remains high. A break above the descending handle resistance will be the first true confirmation.
💎If that breakout is supported by volume and sustained price action, we expect a move toward the first resistance at 0.01698. Beyond that, the final target for this pattern lies at the major resistance zone around 0.01785, where significant selling pressure could return. However, discipline is key. If JASMYUSD breaks below 0.01367, the handle structure would be invalidated.
Stay focused, Paradisers. Be the hunter, not the hunted
MyCryptoParadise
iFeel the success🌴
APT Is Squeezing Into a Reversal Pattern at a Key Weekly Level!Yello, Paradisers! Is #APT quietly gearing up for one of the cleanest reversal plays we’ve seen in weeks?
💎After a long, relentless downside trend, APT is now starting to show signs of life. The price action is compressing inside a classic falling wedge pattern, and more importantly, this is happening right at a weekly key level — the kind of setup that usually leads to significant shifts when confirmed.
💎What’s adding more weight here is the emergence of a bullish divergence on the indicators, suggesting that while price has been making new lows, momentum has already begun to turn. That’s often one of the first early signs of a coming reversal and it’s starting to gain strength.
💎#APTUSDT is now pressing against a decisive resistance zone. The price is testing the 12-hour EMA-50, currently sitting around $5.33, and just slightly above that, the wedge breakout trendline stands at approximately $5.45. These two levels are acting as the immediate gatekeepers for a bullish shift.
💎Breaking through both of these zones will be crucial. If the bulls succeed, we can expect a push toward the $7.00 – $7.35 region — a zone where short-term traders may look to take profits. However, if the momentum continues, the bigger step lies ahead.
💎A sustained breakout could carry APT to the pattern target of $8.75 – $9.25 area. This is a strong resistance zone and this is where things get more challenging. The resistance in this range is reinforced by multiple technical confluences, including the 50% Fibonacci retracement, which often acts as a magnet but also a serious barrier during recoveries.
💎On the flip side, support remains solid. Immediate support is at $4.95, while beneath that, APT sits on a major structural base that has historically held firm. Sellers will need serious volume to crack below this foundation and for now, that pressure isn’t there.
Paradisers, strive for consistency, not quick profits. Treat the market as a businessman, not as a gambler.
MyCryptoParadise
iFeel the success🌴

#HBAR Current Setup Showing Warning Signs | What's Next?Yello Paradisers! Is #HBAR teasing one last move up before everything collapses? Let’s break down what this suspicious structure on #Hedera is telling us:
💎#HBAR is currently trading at $0.183, sitting just beneath a heavy resistance zone around $0.190–$0.200. Price has been unfolding inside a clear Ending Diagonal structure—one of the most deceptive patterns in technical analysis. Wave 5 is still technically in play, but momentum indicators and volume behavior are telling a different story.
💎Volume has been steadily declining even as the price has been climbing, which is never a good sign this deep into a wedge pattern. On top of that, the RSI is pushing into overbought territory, showing that buyers are pushing the market higher, but with weakening strength behind them.
💎The resistance zone above current price is absolutely key. If #HBARUSD manages to break above the red zone and sustain momentum above $0.200, this would invalidate the current bearish setup and could open the door for an impulsive extension toward $0.220 and even higher. However, that scenario currently remains the less likely one unless we see a clear and strong breakout above the zone backed by volume.
💎Until then, bears are in control of the probabilities. The market structure favors a reversal from the Ending Diagonal, and if that plays out, the move could unfold quickly. First, we’ll be watching how price reacts at $0.142, which is the first major support and likely target if the wedge breaks down. A confirmed close below that level would likely lead to a continuation of the drop, with the next strong support zone near $0.125. This area has acted as a solid demand level previously and is also the region where the Volume Profile starts to spike again.
Play it safe, respect the structure, and let the market come to you!
MyCryptoParadise
iFeel the success🌴

ETH Bulls Might Have a Shot – Tight Range Before the Breakout📅 What just happened on ETH?
Ethereum recently printed a local bottom just below 1400 – a level that felt unthinkable just a few months ago. But as it often happens in crypto, the unexpected became reality.
💡 What came next?
From that low, ETH bounced strongly, signaling the start of a natural correction. While I personally don’t believe this is the final bottom, I do see opportunity on the upside.
🧐 What the chart tells us:
Sharp reversal from under 1400
Quick drop but failed continuation lower
Current tight consolidation, which often leads to breakout setups
🧠 My view:
Right now, this looks like a temporary bottom, and until proven otherwise, I’m interested in buying the dip. As long as the structure holds, bulls might have the upper hand short-term.
🎯 My Trading Plan:
Looking to go long, with 1800 as my target.
Risk-Reward? I’m aiming for at least 1:2, so I’ll be waiting for the right entry signal before jumping in.

FARTCOIN/USDT.P – Smells Like a Clean Short Entry’s cooking, and this setup is dripping with RR juice. Let's break it down:
📍 Entry Gameplan:
Short Zone: 1.0660 – 1.0710
SL: 1.1195 (tight and right above the wick)
TP1: 1.025
TP2: 0.9835
TP3: 0.9055 (send it 💨)
Why I Like This Setup:
That choch ➝ BOS combo? Chef's kiss.
Price tapped into supply and reacted fast = strong sellers present
Beautiful RR — no overcomplications, just structure, imbalance, and timing
This thing's been cooking sideways long enough. Now that it’s broken structure and filled its pockets with early buyers, we might finally see a solid dump.
Let’s see if FART delivers the gas.

Why Dogecoin Just Reached a MAJOR Price Floor in 2025!Dogecoin (DOGE), the beloved meme cryptocurrency, has just reached a critical demand zone at $0.151—its strongest weekly demand level in years! This key price floor signals a major opportunity for investors, as historical data suggests a strong bullish reaction could follow.

BITCOIN - Bullish Double BottomHello Traders !
The BTC price formed a double bottom pattern.
Currently, The neckline is broken !
So, I expect a bullish move🚀
______________
TARGET: 88700🎯

FINAL LEG OF THE ZIGZAG CORRECTION ?Yello, Paradisers! Are we about to see the end of this correction, or is there still one more shakeout coming? Let’s break it down.
💎The market is currently unfolding within a Zigzag Correction (A-B-C) pattern, and we appear to be in Wave C the final leg of this structure. Wave A has already played out with a sharp downward move, followed by Wave B, which acted as a countertrend rally. Now, Wave C is in progress, forming the last phase of this corrective cycle.
💎Since this is a 5-3-5 Zigzag Correction, the third wave of Wave C has already developed, meaning the market is nearing a critical Demand Zone at 4.0283. This level is a strong support zone where a potential reversal could occur. If the price reacts positively from this area, it could mark the end of the correction and signal the beginning of a new bullish phase, starting Wave 1 of the next uptrend.
💎However, if the price remains trapped between the Moderate Support and Moderate Resistance zones, we may see an extended period of sideways consolidation before any decisive move. A key confirmation to watch is the RSI approaching oversold conditions, which would indicate that downward pressure is weakening and the probability of a bullish reversal is increasing.
As always, Paradisers, the key to profiting in this market is waiting for high-probability setups. If this correction is indeed ending, the next move could be explosive. Stay sharp, stay disciplined, and trade smart!
MyCryptoParadise
iFeel the success🌴

Is #XLM Setting Up for a Bull Trap Before a Major Drop?Yello, Paradisers! Is XLMUSD gearing up for a breakout, or is this just a classic liquidity grab before the next major dump? Let’s break it down.
💎Right now, #XLMUSDT is testing a minor resistance at $0.28464, a level where price has repeatedly struggled to push higher. While there is a possibility of a breakout, the presence of strong liquidity around the unmitigated supply zone at $0.31917 suggests that any move higher could be a trap before a significant drop. If price does manage to break above this resistance, traders should be cautious it’s likely just a liquidity grab before a larger move to the downside.
💎Once the price reaches the unmitigated supply zone, a rejection is expected, leading to a downward move toward the key support zone at $0.22699. This level has historically been a strong demand area where buyers could step in, potentially causing a temporary bounce or consolidation before any further downside.
💎As CRYPTOCAP:XLM moves lower, it’s crucial to watch volume activity. If the decline happens with high volume, it will confirm strong selling pressure and increase the likelihood of a deeper drop. However, if the price approaches $0.22699 with low volume, it could indicate a lack of seller conviction, leading to a short-term bounce before resuming the downtrend.
💎The EMA 200 continues to act as dynamic resistance, reinforcing the bearish outlook. As long as price fails to hold above $0.28464 or gets rejected from the supply zone, the bearish setup remains intact. In that case, a move toward $0.22699 and potentially even $0.19151 becomes highly probable. Watching volume reactions at these key levels will be essential to confirm the next move.
💎The only scenario that could invalidate this bearish setup is a strong close above $0.36172 with high volume. That would signal a potential shift in market structure and could indicate renewed bullish momentum.
Paradisers, patience and precision are key in this market. Let the levels guide you, trade strategically, and stay disciplined. Avoid emotional decisions this market punishes the impatient and rewards those who stay focused.
MyCryptoParadise
iFeel the success🌴

SOLUSDT Breakdown WarningYello Paradisers! Have you spotted what’s happening with SOLUSDT right now? A major breakdown just played out, and this could be the beginning of a much deeper bearish move that many are underestimating.
💎SOLUSDT has broken down from a rising wedge pattern—an important bearish structure that often signals upcoming downside pressure. Before the drop, it swept liquidity, a typical smart money move, and has now confirmed a bearish Change of Character (CHoCH). This combination significantly increases the probability of further decline.
💎If we see a pullback into the resistance zone—it could offer a strong short opportunity with good risk-to-reward ratio. That’s where professional traders start looking to position themselves carefully.
💎However, this bearish idea has a clear invalidation point. If price breaks out and closes a candle above that invalidation level, then the bearish outlook becomes void. In such a case, it’s wiser to stay patient and wait for more precise, high-probability setups to develop.
🎖Strive for consistency, not quick profits. Treat the market as a businessman, not as a gambler. Stay disciplined, Paradisers, and wait only for the cleanest, most reliable trading opportunities. That’s how you make it in this game.
MyCryptoParadise
iFeel the success🌴

Where Can We Rebuy OM? (1W)After the heavy drop, it became evident that a bearish trend had started, and the price is now seeking high-liquidity (buy) zones.
Based on the chart, the green zone stands out as the best area for a potential rebuy — it could launch the price upward by 100% to 500%.
Reaching this zone may take several weeks or even months.
A weekly candle closing below the invalidation level would invalidate this outlook.
For risk management, please don't forget stop loss and capital management
Comment if you have any questions
Thank You

Bitcoin’s Breakout Blueprint: Eyeing $92KAs of April 20, 2025, Bitcoin (BTC) is trading around $84,500, having recently tested the $92,000 level multiple times. This price point is significant, serving as both a psychological barrier and a technical resistance level.
Technical Analysis:
Resistance and Support Levels: Bitcoin has encountered resistance near $92,000, a level that has been tested repeatedly. A sustained move above this could open the path toward $100,000 and potentially $108,000, the previous all-time high from December 2024. On the downside, support is observed around $85,650, aligning with the 200-day EMA. Further support lies at $78,000 and $74,500, marking previous consolidation zones.
Chart Patterns: The formation of a bullish pennant on the daily chart suggests potential for an upward breakout. If confirmed, this pattern could propel BTC toward $137,000 by Q3 2025.
Volume and Momentum: Recent trading volumes have been moderate, with a slight uptick during price advances, indicating growing buyer interest. Momentum indicators, such as the RSI, are neutral, leaving room for further price movements in either direction.
Fundamental Factors:
Institutional Inflows: Significant capital inflows into Bitcoin ETFs, exceeding $70 billion, have been observed, reflecting strong institutional interest.
CryptoRank
Macroeconomic Environment: Liquidity injections by the U.S. Treasury, amounting to $500 billion since February 2025, have increased market liquidity, which historically correlates with Bitcoin price appreciation.
Halving Effect: The April 2024 Bitcoin halving event has reduced the supply of new BTC, a factor that has historically led to substantial price increases in subsequent months.
Mid-Term Outlook:
Considering the technical and fundamental factors, Bitcoin's mid-term target remains at $92,000. A decisive break above this level could lead to a retest of the $100,000 psychological barrier and potentially higher targets. However, failure to maintain support above $85,650 may result in a consolidation phase or a retest of lower support levels.
Investors should monitor key resistance and support levels, institutional investment trends, and macroeconomic indicators to assess Bitcoin's trajectory in the coming months.

BMT is a rockt ! (2H)It seems that a double bottom is forming, the previous bottom has been preserved, and an order block has formed, which has been broken to the upside. Additionally, a key level passes through this area.
On the chart, we also have a bullish CH (Change of Character). If the trigger line is broken, it will provide further confirmation for a bullish move.
As long as the demand zone holds, the price can move toward the targets.
However, the closure of a 4-hour candle below the invalidation level would invalidate this analysis.
Do not enter the position without capital management and stop setting
Comment if you have any questions
thank you

a river no trader wants to cross.NASDAQ:OM is teetering.
The waves down are forming — a river no trader wants to cross.
Downtrend confirmed.
Liquidity zones broken.
Fibs point to 0.23.
You’ve been warned.
🩸⚔️
**Technical damage is real:
•OBs (Order Blocks) flipped bearish
•FVGs (Fair Value Gaps) wide open below
•No real bullish reaction at key zones
•Momentum bleeding off every bounce**
I’ve seen this movie before:
• VIE:LUNA before the collapse
• SEED_DONKEYDAN_MARKET_CAP:SFP after it faked strength
• FWB:ACH melting after fake-outs
When the structure breaks this bad, it’s not a dip. It’s a landslide.
Early pain looks “small.”
Then you get trapped.
Water wears down rock by persistence, not violence.
Waves keep coming until your hope is underwater.
By the time it looks obvious, it’s too late.
Without a miracle reversal at 0.3700, the flow is down.
0.2329 is the magnet.
Maybe lower.
Respect the river, or get dragged.
🩸⚔️

Threshold Network(T) Analysis: From Bear Trap to Bullish TrendAs long as Bitcoin ( BINANCE:BTCUSDT ) and Ethereum ( BINANCE:ETHUSDT ) are in a range, it is a good opportunity to take advantage of the movement of other tokens and take a look at their charts.
Today, I want to analyze the Threshold( BINANCE:TUSDT ) project for you, which has increased by +70% .
What Is the Threshold Network?
Threshold Network is a decentralized protocol that combines cryptography and privacy to power secure, permissionless applications. It enables users to protect their digital assets through threshold cryptography—where no single party has full control—supporting use cases like private key custody, privacy-preserving smart contracts, and tokenized Bitcoin on Ethereum (via tBTC).
Reasons for Price Increase:
Token Buybacks : Threshold Network is actively buying back T tokens from the market, potentially increasing demand and positively impacting the token's price.
Halting Treasury Sales : The project has stopped selling T tokens from its treasury, signaling confidence in the token's future value and reducing potential market supply.
BitcoinWorld
Reducing Operational Expenses : By streamlining operations to save costs, the project aims for long-term sustainability in the volatile crypto landscape.
-----------------------------------------------------
Technical Analysis:
Now let's take a look at the Threshold(T) chart on the Daily timeframe .
Can we still take advantage of the increase in the price of T Token or not!? Please Stay with me.
The Threshold(T) project is moving near the Heavy Support zone($0.0189-$0.0147) and has managed to break the Resistance lines with a high-volume candle , which could be good news for the continuation of the T token's bullish trend .
The Threshold(T) Project also created a Bear Trap , which basically moves in the opposite direction of the Trap after traps on the price chart with high momentum , which is what happened here as well.
In terms of Elliott Wave theory , the T token is currently completing 5 impulsive waves after completing a Zigzag Correction(ABC/5-3-5) , which seems like we should wait for the main wave 4 and then a re-increase .
I expect the T token to start rising again from the Potential Reversal Zone(PRZ) and give us at least +30% profit opportunity .
Note: If the T token goes below $0.016, we should expect further decline and possibly a break of the Heavy Support zone($0.0189-$0.0147).
Please respect each other's ideas and express them politely if you agree or disagree.
Threshold Analyze (TUSDT), Daily time frame.
Be sure to follow the updated ideas.
Do not forget to put a Stop loss for your positions (For every position you want to open).
Please follow your strategy and updates; this is just my Idea, and I will gladly see your ideas in this post.
Please do not forget the ✅' like '✅ button 🙏😊 & Share it with your friends; thanks, and Trade safe.

DOT About to Break Down? Don’t Fall for the TrapYello Paradisers! Could this "bullish" pump on DOTUSDT be leading traders straight into a bear trap?
💎DOTUSDT is currently forming an ascending channel, which is historically a bearish pattern. These setups often lure in breakout traders before reversing sharply, shaking out weak hands and triggering stop-losses.
💎The price is now approaching a critical resistance zone, where the Fibonacci golden pocket overlaps with the 200 EMA — a powerful confluence. If DOTUSDT grabs liquidity above the recent highs, it would significantly increase the probability of a bearish reversal from that region.
💎For safer, more conservative traders, the best strategy here is to wait for confirmation of a bearish pattern within this area. That would offer a stronger risk-to-reward ratio while allowing more control over trade execution. Patience pays, especially when the market tempts you with low-conviction breakouts.
💎However, if price breaks out and closes decisively above the invalidation level, then the entire bearish idea becomes invalid. At that point, it’s essential to step back and reassess the structure rather than forcing a trade.
Discipline is what separates professionals from gamblers. This setup demands patience, a level head, and an understanding of risk management.
MyCryptoParadise
iFeel the success🌴

Is #BNB About to Break Down or Not? Don't Get Caught Yello, Paradisers! Is #BNB teasing one last move up before the trapdoor opens? Let’s break down what this suspicious structure of #BinanceCoin is really telling us:
💎#BNBUSDT is currently trading around $589, which is right under 200 EMA resistance. The price has been developing inside a clear Leading Diagonal Formation. Here’s the twist: Wave 5 is still in progress, and there’s growing evidence that the move might fail before it even completes.
💎We’re seeing Bearish Divergence flashing on the MACD histogram, which historically signals fading momentum. This divergence could drag #BNBUSD down before Wave 5 finishes, causing an early breakdown of the entire structure. This would completely shift the market bias in favor of the bears.
💎Key resistance levels are stacked around $599, right under the 200 EMA. A confirmed breakout and hold above this zone would invalidate the bearish setup and open the door for a potential bullish extension above $620, but that scenario remains the less probable one for now.
💎Until then, all eyes are on support zones at $533 and the critical swing low at $471. If price closes below the diagonal’s lower boundary and drops beneath $533, it’s likely to trigger a heavy selloff toward the next major demand level at $471, which could form the next Swing Low.
Play it safe, respect the structure, and let the market come to you!
MyCryptoParadise
iFeel the success🌴

COW Analysis (12H)From the point where the red arrow is placed on the chart, the correction of COW has started. This correction appears to be a symmetrical pattern, and it now seems that we are at the end of wave H.
The green zone is where wave I could potentially end, offering a low-risk area for entry.
Targets are marked on the chart.
A daily candle closing below the invalidation level will invalidate this analysis.
For risk management, please don't forget stop loss and capital management
Comment if you have any questions
Thank You

Is crypto dead? NO! IP might save the day!Price Action Analysis
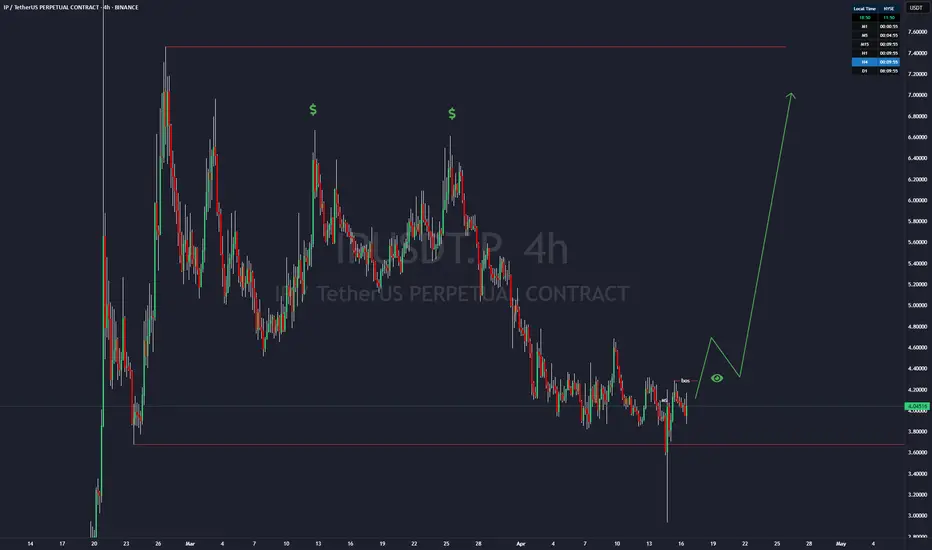
NYSE:IP recently declined to the $3.67 level, effectively sweeping external liquidity by triggering stop-loss orders below key support. This move was followed by a strong recovery, with price fully absorbing the bearish momentum and closing within the global trading range. This price action resulted in a Market Structure Shift (Change of Character, or ChoCH), indicating a potential reversal from bearish to bullish sentiment. The ChoCH suggests institutional buying interest, as the market rejected further downside and reestablished bullish structure.
However, caution is warranted. Bitcoin ( CRYPTOCAP:BTC ), a key market driver, may experience a corrective move lower, potentially influencing NYSE:IP ’s price action. As such, immediate entries are premature without further confirmation of bullish momentum.
Key Levels and Trade Setup
Break of Structure (BoS) at $4.28
The $4.28 level on the daily timeframe is pivotal, representing a potential Break of Structure (BoS). A decisive close above this level would confirm bullish continuation, signaling the start of a significant upward move. Should this occur, NYSE:IP is likely to target the following resistance zones:
$6.61: Initial target, likely aligning with prior swing highs or liquidity pools.
$6.98: Secondary target, potentially coinciding with a Fair Value Gap (FVG) or institutional sell-side liquidity.
$7.46: Final target, representing a high-probability zone for profit-taking.
Entry Confirmation
To ensure a high-probability trade, the following conditions must be met:
Daily BoS Confirmation: A clean break and close above $4.28 on the daily chart, supported by elevated trading volume.
4-Hour Timeframe Validation: A breakout above $4.28 on the 4-hour (4H) or higher timeframe, ideally accompanied by a bullish Fair Value Gap (FVG). An FVG forming on the 4H chart post-breakout would serve as an optimal entry zone, minimizing risk by aligning with institutional order flow.
Pullback to FVG: Post-breakout, a retracement to a 4H bullish FVG (e.g., $4.20–$4.25) that holds as support would confirm the setup for a long position.
Trade Execution
Set Alerts: Configure price alerts at $4.28 to monitor for a daily or 4H breakout. Ensure alerts trigger on a candle close above this level to confirm BoS.
Risk Management: Risk no more than 1–2% of trading capital per trade. Position size should be calculated based on a stop-loss placed below the FVG or recent swing low (e.g., $4.00–$4.10), targeting a minimum risk-reward ratio of 5:1.
Exit Strategy: Take partial profits at $6.61 (50–70% of position) and trail stops for the remaining position toward $6.98 and $7.46, monitoring for signs of rejection or bearish structure at these levels.
Bitcoin Correlation
Given CRYPTOCAP:BTC ’s influence on altcoin price action, monitor its key levels closely. A potential corrective move in CRYPTOCAP:BTC could lead NYSE:IP to retest lower supports (e.g., $3.85 or $3.67). Set a secondary alert at $3.85 to watch for a bounce in case of a broader market pullback. Conversely, a stabilization or bullish breakout in CRYPTOCAP:BTC would enhance the likelihood of NYSE:IP ’s bullish setup materializing.
Conclusion
NYSE:IP presents a compelling technical setup, with a ChoCH at $3.67 signaling a potential bullish reversal and $4.28 as the critical level for BoS confirmation. Traders should set alerts at $4.28, await a clean 4H or daily breakout with FVG formation, and execute entries with disciplined risk management. Monitoring CRYPTOCAP:BTC ’s price action is essential to avoid adverse market-wide corrections. This setup offers a high-probability opportunity for significant upside, provided the outlined conditions are met.
BNB/USDT: Key Support Zone Holds Potential for Bullish ReversalThe BNB/USDT market recently bounced from the 560 support level, a notable swap zone that has acted as a key turning point in past price action. The current pullback from the downward trendline appears to be directing price back toward this historically significant support area.
On the weekly timeframe, a bullish candle has formed, while the daily chart shows a pattern of higher lows, pointing to growing buying pressure. If the price revisits the 550–560 zone, a bounce is likely, potentially sparking a bullish move. With technical signals aligning across multiple timeframes, this zone stands out as a prime area of interest. The next target is the resistance zone around 613

XLM Is About to Trap Thousands of Traders ?Yello Paradisers are you prepared for the next major move on XLM, or are you walking straight into the bull trap? We’re now approaching a critical decision point on XLMUSD that could shake out a lot of traders who are only reacting instead of planning. Here's exactly how we're playing it, step by step.
💎#XLMUSDT is currently trading inside a descending channel. As of now, we see a high-probability scenario where the price gets rejected from the descending resistance, setting up an ideal short opportunity with the current structure still favoring sellers. Should this rejection play out, we expect a breakdown of the moderate support level, with our target set at the $0.1970 zone.
💎Adding more weight to this bearish outlook is the fact that XLM is trading below both the 50 EMA and 200 EMA. This technical alignment confirms broader weakness in the trend and reinforces that any breakout attempts at this stage are likely to be reactive rather than sustainable simply small retracements within a dominant bearish macro setup.
💎However, if price fails to respect the descending resistance and pushes higher, our next major decision area is the supply zone at $0.2537. At that point, as always, we’ll wait with full discipline for confirmation. We’ll be watching closely for clear bearish reversal patterns, such as an Evening Star or a Shooting Star, before taking action. Only a strong and confirmed breakout above the $0.2537 level would invalidate our bearish outlook and shift the market structure into bullish territory.
Stay focused, Paradisers. Be the hunter, not the hunted.
MyCryptoParadise
iFeel the success🌴

BITCOIN (BTCUSD): Potential Scenarios Ahead of Powell Speech
Bitcoin is consolidating for 5 days within a narrow range on a daily.
Today's Powell speech can be a trigger for a strong bullish/bearish movement.
Depending on the today's rhetorics, here are potential scenarios.
Bullish
If the price breaks and closes above the resistance of the range (86500),
we can expect upward movement to 87500 resistance.
Bearish
If the price breaks and closes below the support of the range (82500),
Bitcoin may drop way lower and reach 79600 level.
Wait for a breakout and then follow the market.
❤️Please, support my work with like, thank you!❤️
