SOLUSDT | Elliott Wave Projection – Next big Move Incoming 50%+BINANCE:SOLUSDT
The chart is probably currently developing a five-wave impulsive structure (1)-(2)-(3)-(4)-(5), suggesting a potential bullish movement towards the 174-175 USD resistance zone before a larger correction unfolds.
📈 Bullish Setup:
- A corrective A-B-C structure seems complete, with a potential impulsive wave (1)-(5) forming.
- Price is reacting at a strong demand zone, initiating Wave (1) upwards.
- Possible target for Wave (5) lies near **174-175 USD**.
📉 Bearish Continuation Afterwards
- After reaching the projected high, expect a sharp rejection and reversal.
- The final bearish target lies within the "End of Bear" zone (~108-109 USD).
---
### 🔹 Key Levels to Watch:
✅ First Bullish Target: ~174-175 USD
⚠️ Critical Support Zone: 108-109 USD
---
### 📌 **Trading Plan:**
1️⃣ Long Opportunity: If price respects the current support, target Wave (3)-(5) completion near 174 USD.
2️⃣ Short Confirmation: If price rejects at resistance, a larger bearish wave is expected.
3️⃣ Final Bear Target: 108-109 USD zone for possible long-term support.
🚨 Risk Management:
- Stop-loss below 111 USD for longs.
- Wait for confirmation before shorting after rejection.
💬 What do you think? Will SOL hit 175 USD before the final drop? Comment below!
Cryptosignals

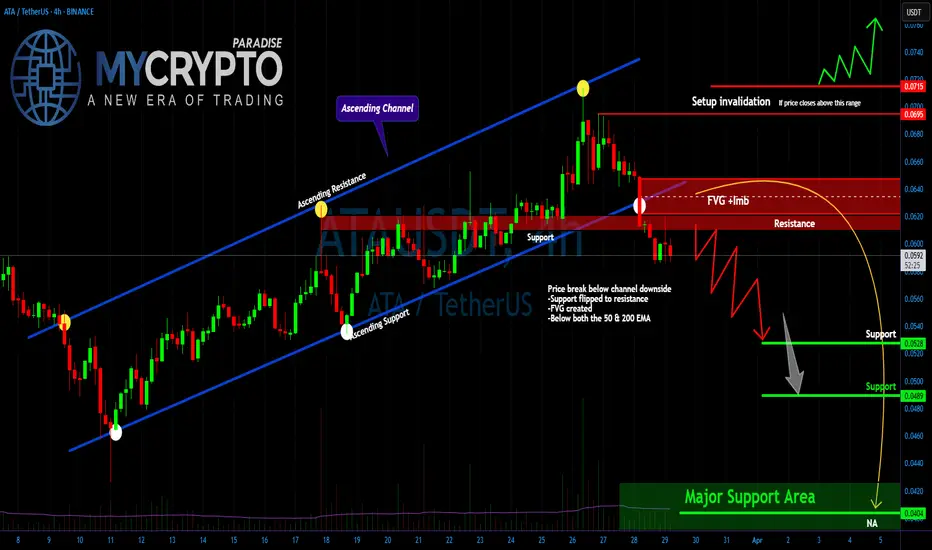
Is TAOUSDT About to Dump Hard? Yello, Paradisers! Are you paying close attention to this subtle shift on TAOUSDT? Because what we’re seeing right now could easily trap late bulls before the real drop even begins…
💎TAOUSDT is currently displaying clear signs of a potential bearish reversal. We’ve observed a bearish Change of Character (CHoCH) developing from the 1H Fair Value Gap (FVG), which is a strong early indication of weakening bullish momentum. To add to this, price has also broken down below the 50 EMA, a technical signal that increases the probability of further downside movement. When both of these elements align, it’s often a precursor to a more significant pullback.
💎If TAOUSDT revisits the recent Fair Value Gap, the trade setup becomes even more attractive, offering a stronger risk-to-reward ratio. That would be the optimal level for entry. However, even from current price levels, the trade still offers a 1:1 risk-to-reward opportunity. While not ideal, it remains viable for more aggressive traders.
💎That said, the entire bearish setup becomes invalid if the price breaks out and closes a candle above the current resistance zone. In such a scenario, it would be wise to step back and wait for more reliable price action to develop before making any further decisions.
Strive for consistency, not quick profits. Treat the market as a businessman, not as a gambler.
MyCryptoParadise
iFeel the success🌴

ALGO Ready to Break Out—or Fake Out? Watch This Critical ZoneYello, Paradisers! have you been watching #ALGOUSD’s recent moves closely—or are you about to miss the bounce that could catch 90% of traders off guard?
💎After topping out in December 2024, ALGO entered a clear corrective phase. That correction just completed an ABC zigzag pattern right into a strong support region, slightly above its key weekly level—a zone where buyers historically step in.
💎#ALGOUSDT is showing clear bullish reactions between the 0.165–0.145 levels. More importantly, a complex bullish divergence is forming—on both RSI and MACD. This is your first warning sign that the bears are losing steam and bulls are ready to step back into control.
💎On the upside price must break and hold above the moderate resistance zone at 0.22 level. A successful reclaim here would not only validate the divergence but also represent a deviation reclaim, where price recovers a previously broken support level.
💎If this reclaim is successful and supported by volume, the next key zone to monitor is between 0.25 and 0.275. This region carries particular significance, as it aligns with both the descending trendline resistance and the 25% Fibonacci retracement. It is a critical level that will likely determine whether the current bounce evolves into a sustained bullish leg.
💎Should buyers maintain momentum beyond that point, the next upside target lies between 0.365 to 0.380 levels.
Paradisers, strive for consistency, not quick profits. Treat the market as a businessman, not as a gambler.
MyCryptoParadise
iFeel the success🌴

SOL/USDT May SOL lose the weekly support? Key Level to buy!Hey traders! 👋 Let’s dive into the weekly chart for SOLUSDT.
📊 Current Price Action:
SOL is trading at $112.20, down 10.96% on the weekly chart. The price has been consolidating in a "Buying Zone" between the weekly support levels of $110.17 and $131.68. This zone has historically acted as a strong base, with the price bouncing from this area multiple times since late 2023.
🟢 Buying Zone and Support:
The current price is sitting in a critical "Buying Zone" between $110.17 and $131.68. This area has acted as a springboard for previous rallies, and if SOL holds above $110.17, it could be a good opportunity for accumulation. A break below $110.17, however, might lead to further downside toward the next support at $80.18 or even $54.00.
🎯 Target:
If SOL manages to break through the $195.71 resistance, the next major target is its previous ATH at $260. I’ve projected a potential move to $295.71, which would be a 95.71% increase from the current price of $112.20. This target aligns with the historical price structure and Fibonacci extensions.
⚠️ Risk Management:
Keep an eye on the $110.17 support. A weekly close below this level could signal bearish momentum, potentially driving the price toward lower supports. On the upside, watch for a strong breakout above $195.71 with high volume to confirm the bullish scenario.
What do you think about SOL’s setup? Are you bullish or bearish on Solana? Let’s discuss in the comments!
#SOLUSD #Solana #Crypto #TechnicalAnalysis #Breakout

PEPE Ready to Dump? This Key Zone Could Trigger a Sharp ReversalYello Paradisers — did you catch the recent shift on PEPEUSDT? If not, now’s the time to zoom in, because the setup is looking primed for a big move, and you don’t want to be caught on the wrong side.
💎PEPEUSDT has broken out of Ascending Channel & shown a clear bearish CHoCH (Change of Character), confirming a shift in market structure. Following that, we’ve now seen a proper pullback. Currently, the price is sitting right at a critical resistance zone.
💎What makes this zone especially significant is the confluence of technical factors stacked at the same level — the 200 EMA, a Fair Value Gap (FVG), and the Fibonacci Golden Zone are all present. This combination significantly increases the probability of a bearish move from here.
💎If PEPE breaks out and closes a candle above our invalidation level, the entire bearish idea gets invalidated.
🎖Paradisers; the next 6–9 months will be juicy for some and painful for others. Discipline, patience, robust strategies, and trading tactics are the only ways you can make it long-term in this market.
MyCryptoParadise
iFeel the success🌴

ENA About to Collapse or One Last Rally Before the Fall?Yello, Paradisers! Is ENA about to crash hard, or is a sneaky rally waiting to trap late bulls? Read this before making your next move!
💎#ENAUSDT has recently formed a Change of Character (CHOCH) while leaving behind a supply zone and an imbalance. Currently, we expect an upside correction toward $0.4333 and $0.4507, but this move is likely to be short lived. If the price taps these levels and faces strong resistance expect a sharp rejection, especially with the descending trendline and EMA 50 acting as barriers to bullish momentum. This setup suggests ENA is in a prime position for further downside unless it breaks above the supply zone.
💎If #ENAUSD fails to break the supply zone, a rapid sell-off toward the $0.34 support zone is highly likely. A visible gap imbalance further increases the probability of the price filling the gap before any potential reversal. Volume analysis also shows a clear surge in bearish activity, confirming strong selling pressure in the market.
💎The $0.34 level remains the most crucial support where buyers may attempt to step in. However, if this fails to hold, the next major demand zone sits around $0.30, where a deeper correction could unfold. Until a significant bullish breakout occurs, the risk of further downside remains high.
💎If the price manages to break above the supply zone, it would invalidate the bearish setup and could fuel a stronger rally. However, as long as the descending trendline and EMA 50 continue to hold back bullish momentum, the bearish outlook remains intact.
💎Will ENA hold support or break down further? Drop your thoughts in the comments! Are you positioning yourself for a move, or are you waiting for confirmation? Let’s discuss!
Stay sharp, Paradisers! The market rewards patience, discipline, and strategic thinking. Trade smart.
MyCryptoParadise
iFeel the success🌴

CTK/USDT in Danger? Key Levels That Will Decide the Next MoveYello, Paradisers! Is CTK/USDT on the verge of a major breakdown, or will bulls make a comeback? Let’s dive in!
💎#CTKUSDT has broken below its ascending channel, signaling a potential trend shift. Right now, the $0.41 - $0.42 level, which previously acted as strong support, has turned into resistance. This is a critical area if buyers fail to reclaim it, the selling pressure will likely continue. Adding to the bearish outlook, price is trading below both the EMA 50 and EMA 200, further confirming that sellers remain in control.
💎A fair value gap (FVG) near $0.41 could act as a magnet for a short-term bounce, but unless price reclaims this level with strength, the downtrend remains intact. If the rejection plays out, the next target to the downside is $0.3484, with a deeper drop potentially reaching the major support zone at $0.3091.
💎On the flip side, a break above the major supply zone at $0.4631 would completely invalidate the bearish setup and open the door for another strong rally. However, as it stands, the market structure favors further downside, and a rejection at resistance could accelerate the decline.
MyCryptoParadise
iFeel the success🌴

Major Breakdown Confirmed! Is a Bigger Dump Incoming? Yello, Paradisers! Did you catch this critical shift in price action? A major breakdown has occurred, flipping previous support into resistance and confirming a trend reversal from bullish to bearish. This shift has reinforced selling pressure, with price now trading below both the 50 & 200 EMA, signaling a strong bearish trend.
💎The market is currently testing resistance at $0.619. If this level holds, the probability of a significant drop increases. A Fair Value Gap (FVG) has also formed, indicating price inefficiency that may get filled before the next leg downward. If selling pressure remains dominant, a zig-zag decline toward lower support levels is likely. The key downside targets to watch are $0.0528, followed by $0.0489, with a major support zone resting at $0.0402.
💎Recent price action further supports the bearish bias. The last five candles have upper wicks, indicating strong rejection at higher levels. Volume is gradually declining, suggesting short-term consolidation before the next significant move. A bearish engulfing pattern has also emerged, reinforcing the likelihood of further downside.
💎To invalidate the bearish setup, price must close above the $0.0695 - $0.0715 range. A decisive breakout above this level would signal a possible trend reversal. Until that happens, the bias remains bearish, with expectations of continued downward momentum unless resistance is broken convincingly.
Stay patient, stay disciplined, and always wait for the highest probability setups. Those who follow the plan and avoid emotional decisions will be the ones who come out on top. Be a PRO!
MyCryptoParadise
iFeel the success🌴
XRPUSDT.P — Is This the Beginning of the Next Pump?
BINANCE:XRPUSDT.P is bouncing back with style — and this long setup is giving off real “king of the charts” vibes. Look at that clean risk-to-reward!
Entry: 2.0905 USDT
Stop-loss: 2.0574 USDT
Take-Profit: 2.2238 USDT
R:R Ratio: 3.28
Why this setup matters:
Confirmed bounce off intraday support
Momentum shift with bullish engulfing candle
Targeting a clean resistance level for optimal exit
Tight stop, juicy upside — exactly what scalpers and day traders crave. Add to watchlist and get ready to trail that stop if momentum holds.

BTC/USDT: Range-Bound Movement with Rebound Potential from Key SThe BTC/USDT market recently tested last week’s high but pulled back after encountering resistance near the 89,000 level. On the daily timeframe, the latest candle formed a doji, signaling weakening selling pressure.
The price has reached the two-week low, where underlying liquidity may trigger a bounce—especially around the psychological 80,000 level. With the market consolidating after recent sell-offs, a move toward the 85,000 area is possible. A monthly doji close is also anticipated, reflecting the broader indecision. The next upside target is the resistance zone around 84,000

Market Moves & Token Trends – Analysis with Me!Hi everyone, I hope you're all having a fantastic weekend!
To receive a token analysis , please follow the format below and leave your request in the comment section:
Example:
Project Name: Bitcoin
Token Symbol: BTC
Important Notes:
I will analyze a maximum of 20 tokens.
Each follower is allowed to submit one analysis request.
Once submitted , your token analysis will be shared directly below your comment .
Looking forward to your requests! 😊
If you found this helpful, please hit the ✅ Like Button ✅ (It fuels my energy) 💪 and Share it with your friends! Let’s grow together! 🙏😊
Wishing you health, wealth, and success! 🚀💸

#HIVEUSDT is maintaining a bearish structure📉 Short BYBIT:HIVEUSDT.P from $0.2424
🛡 Stop loss $0.2455
🕒 1H Timeframe
⚡️ Overview:
➡️ The POC (Point of Control) is at 0.2527, marking the area with the highest trading volume and now acting as major resistance.
➡️ The 0.2455 level serves as local resistance — price has already started to decline from that zone.
➡️ Price BYBIT:HIVEUSDT.P is steadily moving lower and staying below volume clusters, confirming the bearish structure.
➡️ A breakdown below $0.2424 could lead to acceleration toward target zones.
🎯 TP Targets:
💎 TP 1: $0.2399
💎 TP 2: $0.2379
💎 TP 3: $0.2366
📢 Watch for confirmation of the $0.2424 breakdown — it’s key for continuation.
📢 If price reclaims $0.2455, the short setup becomes invalid.
BYBIT:HIVEUSDT.P is maintaining a bearish structure — expect quick target reaction if the signal confirms.

APEUSDT: Will This Major Resistance Trigger a Sharp Rejection?Yello Paradisers, have you spotted what’s brewing on APEUSDT? We’re sitting at a critical zone—one that could either trigger a steep drop or trap late shorts before a breakout. Here's why this level demands your full attention.
💎APEUSDT is showing strong bearish potential, currently trading inside a rising wedge pattern accompanied by bearish divergence. What's even more crucial is that this price action is unfolding right at a key resistance zone, reinforced by both the 0.618 Fibonacci level and the 200 EMA. This confluence of technical factors significantly increases the probability of a bearish rejection from here.
💎If APEUSDT consolidates around this level and begins forming clear bearish structures—such as an M-pattern, a bearish CHoCH (Change of Character), a Head & Shoulders, or even an Inverse Cup & Handle—the bearish case strengthens further. This would also allow for a tighter risk setup, improving the risk-to-reward ratio for traders who are patient and precise.
💎On the flip side, if the price breaks and closes decisively above the invalidation level, this will invalidate the bearish setup entirely. In that scenario, the smart move would be to wait for a new structure or a clean retest before making any trading decisions.
🎖This is the only way you will make it far in your crypto trading journey. Be a professional—stick to your plan, reduce your risk, and never chase the market. Timing and discipline are what separate consistent traders from the rest. Stay sharp, Paradisers.
MyCryptoParadise
iFeel the success🌴

TON/USDT: Bullish Continuation Builds Above Key Breakout ZoneThe TON/USDT market is maintaining its upward momentum after breaking out of a consolidation phase, currently testing the psychological level of 4.00. Although a pullback toward the support level and upward trendline remains possible, the breakout and close above the consolidation zone suggests that this area may now act as support.
On the daily timeframe, a bullish engulfing candle has formed, reinforcing the presence of strong buying pressure. If the market retests and holds above the breakout zone, further upside is likely. The next key target is the resistance zone around 4.40, with potential to extend toward the 4.50–4.80 range

AVAX Is Approaching a Make-or-Break Level — What Comes Next?Yello, Paradisers! Is #AVAX finally waking up after months of bearish slumber, or is this just another bull trap? After moving within a well-defined descending channel for weeks, we are now seeing the first real shift in structure: AVAXUSDT has just broken above its 12-hour EMA convincingly for the first time since November 2024. This development may be a strong early signal of a potential corrective move to the upside.
💎At the moment, #AVAXUSDT is testing a critical resistance at the $23.50 level, which lines up with the descending trendline that has capped price since December 2024. A breakout above this zone would significantly increase bullish momentum, with the next target likely at $27.35 — a key area of moderate resistance that could temporarily halt upward movement.
💎However, $27.35 is not expected to be an easy level to break. Sellers will likely defend this zone, potentially causing short-term volatility. But if bulls manage to flip it into support, the path opens toward the $31.20 to $34.00 region. This higher resistance area is even more significant as it aligns with the 50% Fibonacci retracement level — a major technical barrier where many traders will be looking to take profits or fade the rally.
💎On the downside, AVAX has established a strong support range between $19.50 and $18.80. If this short-term support fails, we then look to the weekly support zone between $16.20 and $15.00, which continues to serve as a long-term base structure. As long as AVAX holds above this broader support, the larger bullish outlook remains intact.
Paradisers, strive for consistency, not quick profits. Treat the market as a businessman, not as a gambler.
MyCryptoParadise
iFeel the success🌴

ARB/USDT: Bearish Pressure Builds Below Key ResistanceThe ARB/USDT market recently tested support before rebounding toward the psychological 0.400 level, forming what appears to be an ABC pullback, often a signal for an upcoming retracement. Price has moved above last week’s high, which may indicate a liquidity grab before a potential drop.
When comparing the current bullish pullback to previous stronger bearish moves, the broader momentum appears to favor the bears. If the market fails to break through the channel boundary, trendline, and the 0.420 resistance, a move lower is likely. The next target is the support zone around 0.3500

Warning: BCHUSDT Is Approaching a Dangerous Trap ZoneYello, Paradisers! Are you ready for what could be the next classic fakeout setup? BCHUSDT is heading straight into a high-probability reversal zone, and if you’re not paying attention, this could turn into another painful reminder of how quickly things change in crypto…
💎BCHUSDT is currently showing signs of weakness as it moves toward a major resistance zone. This area is reinforced by a 4H Fair Value Gap (FVG) and the critical 0.618 Fibonacci retracement level — both of which have historically acted as strong reversal points.
💎Adding to the confluence, we’re spotting clear bearish divergence on the chart, which further increases the likelihood of a downward move from this level.
💎If BCHUSDT taps into our resistance zone, we’ll be monitoring for bearish price action confirmation.
💎Ideal patterns to validate the setup include: M-formation, Head & Shoulders, Inverse Cup & Handle.
💎These patterns can help us reduce our stop-loss exposure and improve the overall risk-to-reward ratio — patience will be key here.
💎On the flip side, if price breaks out and closes above our invalidation level, the bearish setup will be completely invalidated. In that scenario, it’s smarter to wait for new, more favorable price action before making any trading decisions.
🎖This is the kind of moment that separates disciplined traders from the emotional ones. Don’t rush in blindly — timing, confirmation, and strategic entries are everything if you want to win consistently in this game.
MyCryptoParadise
iFeel the success🌴

LINK/USDT: Strong Momentum Points to Higher TargetsThe LINK/USDT pair has shown strong bullish momentum on the 1-hour timeframe, breaking above both the 15.00 level and a downward trendline. On the daily chart, four consecutive bullish candles reflect persistent buying pressure.
Recent movements suggest an ABC pattern is unfolding, hinting at a potential push toward the 17.00 resistance level. With momentum building, the market may soon test this zone, barring any negative news that could prompt a sell-off. A pullback may occur short term, but the overall outlook remains bullish, with a mid-term target at the resistance zone around 16.45

TRX/USDT: Consolidation Holds with Upside PotentialThe TRX/USDT market recently saw a false breakout below a key support level, followed by a rebound toward the upper boundary of the channel. On the broader timeframe, the price has been in a two-month consolidation, forming a range near the 0.2200 support, which has held firm through multiple tests.
This consistent rebound highlights the significance of the 0.2200 level, suggesting it may continue to act as a launch point for upward movement. A retest of the trendline is possible, with potential for the price to approach the channel's upper boundary. The next target is the resistance zone at 0.2370

PEPE/USDT:BUY LIMITHi friends
You can see that after the price fell in the specified support area, buyers came in and supported the price and created higher ceilings and floors.
Now we can buy at the specified levels with capital and risk management and move with it to the specified targets.
*Trade safely with us*

SOLANA (SOLUSD): Bullish Reversal Confirmed
It looks like Solana is ready to return to a bullish trend.
We see multiple strong price action confirmations after
a test of a significant daily support.
The price formed the ascending triangle on that, and violated
both its neckline and a resistance line of a falling wedge pattern.
Looks like the market can reach 180 level easily soon.
❤️Please, support my work with like, thank you!❤️

ANKR/USDT Will Bulls Take Control or Are We Heading Lower?
Yello Paradisers! Are we about to see #ANKRUSDT break out, or is another rejection incoming? Let’s break it down this is a crucial moment in the market, and you don’t want to miss it.
💎Right now, the 4-hour chart shows SEED_DONKEYDAN_MARKET_CAP:ANKR sitting above the EMA 50, signaling a short-term bullish push. But don’t get too excited just yet—price is still below the EMA 200, which keeps the overall market bias neutral to bearish. For the bulls to take over, a clean breakout above the EMA 200 resistance is needed. If ANKR fails here, we could see another test of the supply zone between 0.02019 - 0.02271, followed by a potential pullback toward the 0.01504 support level.
💎Now, zooming out to the 1-day chart, the picture gets even more interesting. The price is still trading below both the EMA 50 and EMA 200, confirming that the bigger trend remains bearish. What does this mean? Any bullish moves on the 4-hour chart could just be temporary retracements within a larger downtrend. With this structure, selling pressure is still dominant, and unless we see a major reversal, further downside remains on the table.
💎So, what’s the key takeaway? Short-term bullish opportunities exist, but they’re facing strong resistance from the EMA 200 and supply zone. Meanwhile, the longer-term trend remains bearish, meaning any failure to break higher could increase the risk of a deeper drop possibly toward the 0.01294 support area.
Patience and precision are key in these conditions wait for strong confirmation before making your moves.
MyCryptoParadise
iFeel the success🌴

ADAUSDT Flashing Bearish Signals – Is a Drop Incoming?Yello, Paradisers! Are we about to see a strong rejection on ADAUSDT? Let’s break it down.
💎ADAUSDT has filled the Fair Value Gap (FVG) and formed a double top with bearish divergence. Notably, the right top is slightly above the left, signaling a liquidity grab. Following this, we’ve seen a Change of Character (CHoCH) to the bearish side, increasing the probability of a downside move.
💎If ADAUSDT retraces from this level, it will strengthen a high-probability bearish setup from the 1-hour FVG, where the 0.5 Fibonacci level aligns—offering an attractive risk-to-reward (RR) opportunity for shorts.
💎However, if price breaks and closes above the 0.786 Fibonacci level, our bearish outlook will be invalidated. In that case, it would be best to step back and wait for stronger confirmation before taking action.
🎖 Patience and discipline win the game, Paradisers! Don’t chase—wait for the best setups and protect your capital like a pro.
MyCryptoParadise
iFeel the success🌴
