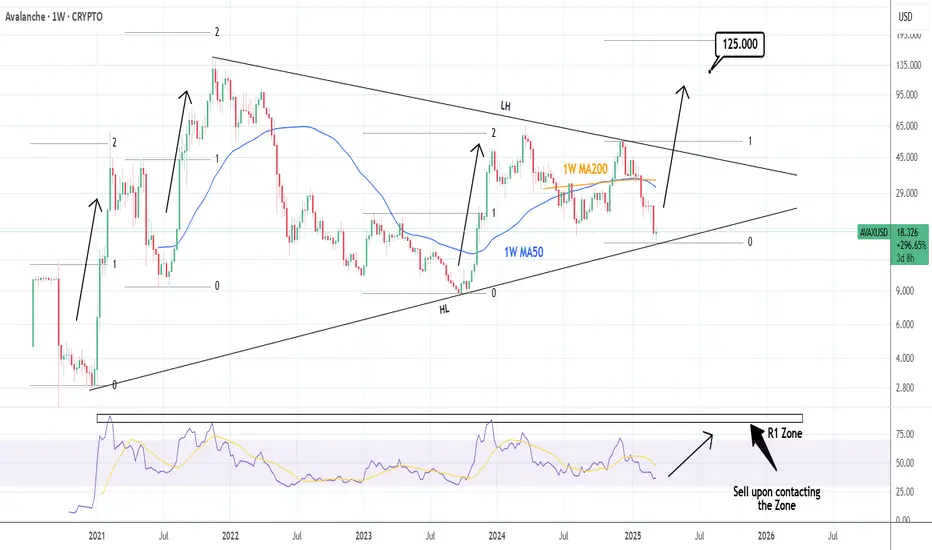
AVAXUSD: Could target $125 by the end of this CycleAvalanche is bearish on its 1D technical outlook (RSI = 38.910, MACD = -2.280, ADX = 35.079) but the bullish dynamics should start accelerating now as the price hit the HL trendline of December 2020. This is the bottom of the multi year Triangle pattern and with the 1W RSI as low as the August 5th 2024 bottom, we expect the final rally of this Bull Cycle to start. Technically it should break above the LH trendline as all Bull Cycle rallies hit (or came close to) their 2.0 Fibonacci extension. Buy and aim for slightly below it (TP = 125.000).
## If you like our free content follow our profile to get more daily ideas. ##
## Comments and likes are greatly appreciated. ##
Cryptosignals
HBAR Hanging by a Thread! A Breakdown Could Be Brutal!Yello, Paradisers! Is #HBAR about to crumble under selling pressure? The charts are flashing red flags, and bulls are barely holding on! Let’s break it down.
💎#HBARUSDT is clinging to a crucial support zone between $0.1900 – $0.1785—a level that has held strong since December 2024. However, with repeated tests, this support is starting to weaken, signaling potential trouble ahead. Sellers are building pressure, and if bulls fail to defend the $0.1750 level, HBAR could face a sharp drop toward $0.1500, where a short-term short-squeeze might offer some temporary relief.
💎However, if selling momentum persists, the decline could extend further, dragging HBAR down to the $0.1300 – $0.1175 zone, where higher time-frame supports are present. This area is more likely to trigger strong short-covering and attract fresh buying interest, potentially setting the stage for a recovery.
💎On the upside, bulls are trapped under heavy resistance at $0.24, with a critical barrier at $0.26 – $0.275. Until this level is broken with conviction, HBAR remains vulnerable to further downside.
Paradisers, as always, patience and precision are key in this market. This isn’t a time for reckless trades—let the levels guide you, trade strategically, and stay disciplined.
MyCryptoParadise
iFeel the success🌴

Warning: DSYNC Is on the Edge—A Huge Drop Could Be Next!Yello, Paradisers! Are we about to witness another major leg down for #DSYNC? The price action is flashing clear warning signs, and if you’re not paying attention, you might get caught on the wrong side of the trade.
💎#DSYNCUSDT has been in a consistent downtrend since forming a double top, and the technicals are pointing to more downside ahead. The pair is now shaping a descending triangle, a well-known continuation pattern that signals further bearish movement.
💎Right now, 0.1850 is the key battleground. DSYNC is breaking below this critical support level, and if sellers hold this breakdown, an accelerated drop could follow in the coming hours. The first major support lies at 0.1415, where some profit-taking may occur, but it’s unlikely to stop the overall decline. Below this level, the final target zone between 0.1215 and 0.1115 becomes the most significant area of interest, as this is where the pattern’s full downside projection concludes and stronger support is expected.
💎At the same time, DSYNC is already turning 0.1850 into a resistance, reinforcing the bearish momentum. Higher up, another resistance at 0.2120 will make it even harder for bulls to regain control. For any meaningful recovery, buyers need to push past the stronger resistance zone between 0.255 and 0.2720, but as long as this area holds, sellers remain firmly in control.
💎Adding to the downside pressure is the death cross between the EMA-50 and EMA-200, a strong bearish signal that suggests the trend remains aggressively negative. Without a decisive reclaim of key levels, DSYNC is vulnerable to further losses.
Paradisers, as always, patience and precision are key in this market. This isn’t a time for reckless trades—let the levels guide you, trade strategically, and stay disciplined.
MyCryptoParadise
iFeel the success🌴

ATOMUSDT Nearing a Breakdown – More Pain Ahead?Yello, Paradisers! Is ATOMUSD gearing up for a deeper decline, or can the bulls pull off a breakout reversal? The latest price action suggests a major move is coming let’s break it down.
💎#ATOMUSDT remains in a strong downtrend, repeatedly rejecting from the key resistance trendline and the 200 EMA. The latest attempt to break above the supply zone $4.445 was firmly rejected, reinforcing bearish control. Sellers continue to dominate, keeping the price below the $4.445 supply zone, making ATOM vulnerable to further downside. Until this level is reclaimed, the trend remains bearish.
💎The next key downside target is the $3.740 support zone, where a temporary relief bounce could occur. However, if selling pressure persists, ATOM could drop further toward the $3.482 major support, a historically strong buying area.
💎For the bulls to regain control, #ATOM must break above $4.445 and push beyond the 200 EMA near $4.80. However, a true trend reversal will only be confirmed if ATOM closes above $5.90, invalidating the bearish setup.
Stay patient, Paradisers! The market rewards discipline. If we see confirmation, we take action. If not, we wait. Trade smart, not fast!
MyCryptoParadise
iFeel the success 🌴

XRPUSDT: A Massive Move Is Coming – But Will It Be Up or Down?Yello, Paradisers! Are we about to see an explosive breakout in XRP, or is a deeper pullback lurking around the corner? Let’s break it down.
💎XRPUSDT has formed a falling wedge alongside a bullish divergence, signaling a potential upside move. Adding to the bullish case, we also see an inverse head & shoulders pattern forming underneath – a combination that significantly increases the probability of a breakout.
💎For a high-probability bullish confirmation, we need a breakout and candle close above the falling wedge.
💎That said, if price retraces deeper, we should be watching the major support zone for a potential bounce. A bullish I-ChoCH on lower timeframes will serve as the key confirmation for a reversal.
💎The invalidation level? If XRPUSDT breaks down and closes candle below the major support zone, this bullish setup will be completely invalidated.
🎖Stay sharp, Paradisers. The next move will decide everything! As always, discipline and patience will separate the winners from the crowd. Be strategic, trade smart, and wait for the highest probability setups.
MyCryptoParadise
iFeel the success 🌴

ZILUSDT at a Breaking Point: Deeper Drop or a Surprise Reversal?Yello! Is ZILUSDT about to sink further, or are the bulls preparing for a comeback? The price action is flashing critical signals, and a major move is brewing traders, stay sharp.
💎#Zilliqa remains under heavy bearish pressure, struggling to reclaim the key $0.01503 resistance level. The price is trading below both the 50 and 200 EMAs, reinforcing the downtrend and showing that sellers are still in control. If GETTEX:ZIL fails to hold above the current trendline, it will likely retest $0.01278, where a rejection could send it lower. Until $0.01503 is reclaimed and sustained, the risk of further downside remains high.
💎The next major support sits at $0.01032, where a temporary bounce could occur. This is a crucial level, as it marks a strong historical support zone. However, if selling pressure persists, ZIL could drop further to $0.00879, a key accumulation area where bulls might step in—or where the bearish trend could deepen even further.
💎For the bulls to regain control, it must reclaim $0.01503 and break past the supply zone. A sustained push beyond this level, backed by strong buying momentum, could hint at the start of a trend reversal. However, a true shift in momentum will only be confirmed if ZIL closes above $0.01503, reclaims the 200 EMA, and invalidates the current bearish setup.
Patience is everything, traders. The biggest profits come from waiting for confirmation, not chasing every small move. Play it smart and stay disciplined only the prepared will win in the long run.
MyCryptoParadise
iFeel the success 🌴

VETUSDT on the Edge – Is a Major Breakdown Coming?Yello! Is VETUSDT on the verge of a bigger drop, or could a reversal be in play? The price action is signaling a critical moment, and traders need to stay sharp. A major move is brewing let’s analyze the setup.
💎#VETUSD remains under strong bearish pressure, repeatedly rejecting from the descending trendline and key supply zone. Price is also trading below the 200 EMA, reinforcing the bearish momentum and signaling that sellers remain in control. Until VET reclaims $0.02695, the risk of further downside remains high.
💎The next major support level to watch is $0.02117, where a temporary bounce could occur. However, if selling pressure continues, VET is likely to push lower toward $0.01906, a historically strong accumulation zone. This level will be crucial either it holds as a buying opportunity, or we see deeper downside continuation.
💎For the bulls to regain control, it must reclaim $0.02695 and break past the supply zone. A sustained push beyond $0.025, combined with strong buying momentum, could indicate the start of a recovery. However, a true trend reversal will only be confirmed if NYSE:VET closes above $0.02695 and reclaims the 200 EMA, invalidating the bearish setup and signaling bullish strength.
Patience is key, Paradisers. The market rewards those who wait for confirmation instead of chasing every move.
MyCryptoParadise
iFeel the success 🌴

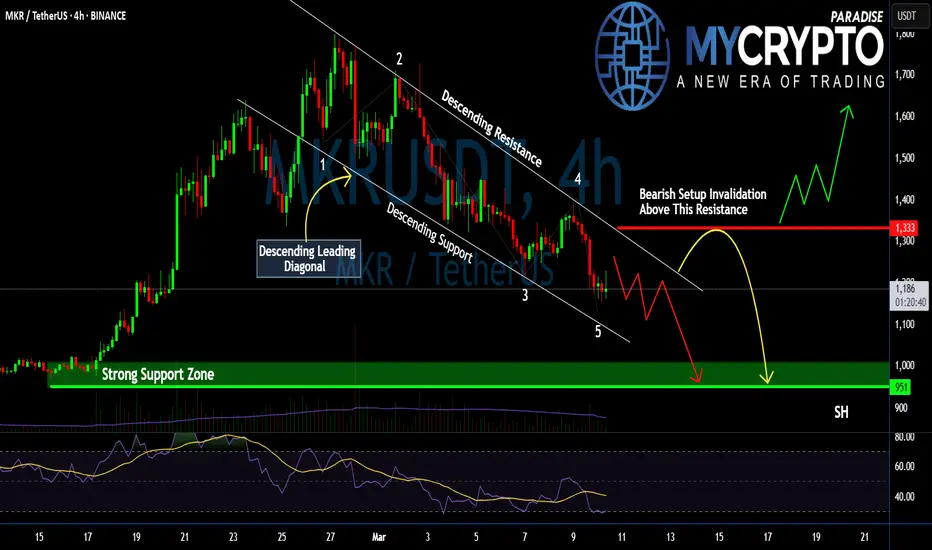
#MKR Bears in Control: Is a Breakdown Inevitable or Not?Yello, Paradisers! Is #MKR setting up for another leg down, or will the Bulls finally step in? The structure is clear; this could get ugly unless something changes soon. Let’s break down the #Maker setup:
💎#MKRUSDT is forming a Descending Leading Diagonal, a classic bearish pattern within a larger zigzag correction. This structure suggests that sellers remain in control, with each bounce being met by renewed selling pressure.
💎Price is currently reacting off the descending support near $1,160. While a short-term bounce toward $1,250 - $1,300 is possible, it remains within the bearish framework. The critical resistance to watch is at $1,333—a breakout above this level would invalidate the bearish setup and signal a shift in momentum.
💎If the bearish structure holds, the next leg down could take us to the strong support zone at $1,000 - $950. This is where buyers will have their last real chance to defend the trend. A failure to hold this level could open the door to a deeper correction.
💎RSI remains weak, showing no strong bullish divergence, signaling that momentum is still in favor of the sellers. The volume is declining, meaning the recent price action lacks strong buying conviction.
Strive for consistency, not quick profits. The market rewards discipline and patience—trade smart, Paradisers!
MyCryptoParadise
iFeel the success 🌴
Bulls in Trouble! Sonic Rejected Again—Lower Lows Incoming?Yello, Paradisers! Is #Sonic about to take another dive? The latest price action suggests trouble for the bulls. After failing to reclaim key support, the downtrend is back in full force.
💎#SUSDT continues to reject from a historically strong resistance at $0.63 – $0.65, a level that has repeatedly proven difficult to break. This latest rejection is only accelerating the downside, putting lower targets into play.
💎The sellers are initially aiming for the $0.46 – $0.44 levels, a strong support zone where we could see some short-covering as traders take profits on their positions. This level has provided temporary relief in the past, making it a key area to watch.
💎However, if sellers maintain control and the bearish momentum continues, the price could dip even further into the $0.3850 – $0.3740 zone. This area has historically acted as a strong support base, attracting significant buying pressure that could fuel a potential reversal.
💎For bulls to regain control, they must reclaim the $0.63 – $0.65 zone, a strong resistance level. However, with descending resistance reinforcing this area, breaking out won’t be easy. Until then, the trend remains bearish, and lower levels are in play.
Stay patient, Paradisers! The market always rewards discipline. If we see confirmation, we take action. If not, we wait. Trade smart, not fast! 🎖
MyCryptoParadise
iFeel the success 🌴

CPOOL Struggling to Hold—Will Bears Push It Even Lower?Yello, Paradisers! #CPOOL has been struggling to gain bullish momentum, and the risk of further downside is increasing. Let’s break it down.
💎#CPOOLUSDT has been stuck in a descending channel since its highs back in December 2024, and so far, the bears remain in control. As long as bulls fail to break out of this structure, the price will continue trending downward.
💎Recently, CPOOL bounced off the descending support at $0.1750, and looks in a position to be pushing towards $0.2160 and potentially $0.2500. But don’t get too excited just yet—this move remains within the bearish structure, and sellers are likely to step in again.
💎If the bears regain momentum, expect a breakdown below support, accelerating towards $0.1540, with key support levels waiting at $0.1250 - $0.1130. This is where weekly support could kick in, potentially leading to a higher time-frame reversal.
💎For bulls to take full control, CPOOL needs to reclaim and hold above $0.2850 - $0.3050. If that happens, we could be looking at the beginning of a strong bullish trend, with new highs on the horizon.
Strive for consistency, not quick profits. The market rewards discipline and patience—trade smart, Paradisers!
MyCryptoParadise
iFeel the success 🌴

AVAX Breakdown Incoming? Key Levels to Watch Now!Yello, Paradisers! Is AVAXUSDT about to take another dive, or are the bulls finally ready to step in? Let’s break it down!
💎#AVAXUSDT remains firmly in a downtrend, struggling to gain bullish momentum while continuously rejecting key supply zones. Recently, the price tapped into the imbalance zone around $21.5, but sellers smacked it right back down a clear sign that bears are still in control.
💎Adding to the bearish case, a descending trendline and moving averages are acting as resistance, keeping price action suppressed. The structure continues to form lower highs and lower lows, reinforcing downside momentum.
💎If Avalanche retests the $22.5 supply zone and faces rejection, another leg down toward $18.956 is likely, with the next major support sitting at $17.523. Right now, if the price closes below the 50 EMA, there’s a strong probability it will directly target our projected support levels. A failure to attract strong buying interest at these levels would confirm further downside continuation.
💎However, if AVAX manages to break through the $22.5 supply zone, our focus shifts to the next major resistance at $24.136. A breakout above this level with strong volume could invalidate the bearish setup, potentially pushing price toward $24 - $25. A confirmed move past $24.136 would shift momentum bullish, opening the door for a rally toward $26 and beyond.
Stay sharp, Paradisers! The market rewards patience and discipline. If we get confirmation, we act. If not, we wait. Trade smart, not fast! 🎖
MyCryptoParadise
iFeel the success 🌴

#Bitcoin $BTC OutlookCRYPTO:BTCUSD is testing a 2 years old uptrend channel lower wedge extending since 2023 where #BTC price was ~$25k. The wedge is ranging between ~$80k : ~$70k.
Key levels:
~$79k: kind of imminent today.
~$73.5k: The first and the nearest core demand, smart money is concentrated at this level "A bounce is anticipated from here"
~$70k: Is the last bulls haven, breakingdown will unlock the ~$60k mark.
Check my previous BTC analysis, I've been calling for the ~$80k : ~$70k since ATHs.
#AhmedMesbah

$ETH #Ethereum AnalysisCRYPTO:ETHUSD is currently testing a significant 5 years old lower wedge around ~$2000. Violating this wedge will drive the price down to ~$1600 and ~$1100. A bounce will push the price back to test ~$2500 and ~$2800.
DYOR before reacting to the market.
#AhmedMesbah

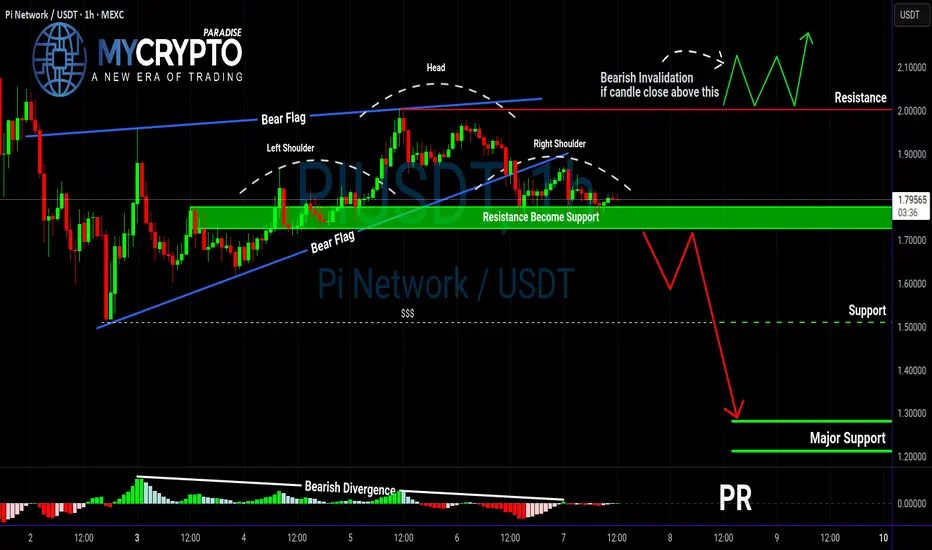
PIUSDT Breakdown Incoming? Bearish Patterns Are Stacking Up! Yello, Paradisers! Is PIUSDT about to break down hard? The charts aren’t looking great, and the confluence of bearish signals is something we can’t ignore.
💎PIUSDT has formed a bear flag on the higher timeframe, a classic continuation pattern that suggests further downside. This alone is already a bearish signal, but there’s more.
💎On the lower timeframe, we can see a head & shoulders pattern forming, along with bearish divergence. These factors together significantly increase the probability of a move to the downside.
💎In the case of PIUSDT breakdown and closes candle below the support zone, this will confirm the bearish setup and likely trigger selling pressure. A breakdown at this level would validate both the bear flag and the head & shoulders pattern.
💎If the price bounces from here, the bearish bias still remains, but there’s also a chance that the market is setting a trap within this range. This makes it a high-risk zone, so it’s better to avoid trading here until a clearer move develops.
💎However, If the price breaks and closes candle above the resistance zone, the bearish outlook will be completely invalidated. In that case, it’s smarter to wait for a more defined price action before making any moves.
🎖Patience is key, Paradisers. The market loves to shake out inexperienced traders before the real move happens. Stay disciplined, focus on high-probability setups, and trade like a pro. Only those who truly understand market cycles will capitalize in the end!
MyCryptoParadise
iFeel the success 🌴
$GIGA GIGACHAD Supernova!!!BME:GIGA GIGACHAD (MARKET CAP $144.77M --> $50Bil MC)
entry PTs 0.0065 - 0.01 - 0.014
Next Target PTs 5.19-12.14 and higherrr
Returns +345X fm $144.77Mil MC-805X
63LfDmNb3MQ8mw9MtZ2To9bEA2M71kZUUGq5tiJxcqj9

$SPX SPX6900 Supernova!SP:SPX SPX6900 (MARKET CAP $476.18M)
**We are early.** 🚀🌙 (**First 100Bil MC coin**)
Scale-in Now and again at entry PTs 0.05 - **0.38**
Next Target PT 23 — $22 Billion Returns 48X (Timeline: May-June)
Short term Target: PTs 107.14 - 148.22 — $100 Billion Returns 218X (Timeline: late 2025 and early 2026)
**--> Rebuy Mid-July**
Medium term Target: PT 1,073 — $1 Trillion Returns 2,185X (Timeline: Oct 2026)
**--> 83**
Long term Target: PT 56,060/56,120 — Flip $52.2 Trillion Returns 114,060X (Timeline: 2040)
SPX6900 is an advanced blockchain **cryptography **token coin capable of limitless possibilities and scientific utilization. 🚀🌙
The stock market cryptography blockchain token coin.

DOTUSDT at a Make-or-Break Level – Big Move Incoming?Yello, Paradisers! Is DOTUSDT on the verge of a breakout, or will the bears crush the momentum? Read on this is a critical moment!
💎#DOTUSDT is showing strong bullish momentum, bouncing off the demand zone above $4.582, signaling that buyers are stepping in and defending key levels. The market structure remains favorable for the bulls, but a crucial test is ahead.
💎The price is trading above both the 50 EMA and the 200 EMA, which is a strong indication that the uptrend is intact. Volume is increasing near demand zones, suggesting that buyers are actively supporting the price. This reinforces the strength of the trend, with green candles showing a strong buying push and minimal wicks, indicating low selling pressure.
💎If POLKADOT successfully breaks and holds above $5.00 with strong volume, the next upside target is $5.30, a major resistance zone. A decisive breakout here could open the door for an even stronger rally. However, if DOT fails to break $5.00 and retraces, the lower demand zone at $4.465 will be a key area to watch for a potential bullish rebound. A close below $4.215 would invalidate the bullish setup and shift momentum in favor of the bears.
Patience is key, Paradisers! If we see a confirmed breakout, we act. If not, we wait. Discipline is what separates traders from gamblers. Stay sharp and trade smart! 🎖
MyCryptoParadise
iFeel the success 🌴

Why I shorted BTC?In last weekend’s crypto analyses, I mentioned that many altcoins were in a support zone, with a strong chance of a reversal from that level.
Shortly after I published my analyses, the announcement regarding the federal crypto reserve was released, triggering a massive pump.
However, this surge was short-lived, and prices quickly retraced back to their initial levels. For me, this is not a good sign—when major positive news fails to sustain gains, it often signals weakness in the market.
Now, regarding Bitcoin: although its price remains above the announcement level, it has struggled to hold gains above the 91K support level and continues to break below it.
I don’t believe prices are dropping just to set up a massive bull run for everyone to buy in—this looks like a bearish signal to me.
As a result, I have shorted BTC and expect a decline to 75K. That said, with my stop-loss placed above the initial pump’s high, I’m currently running a 1:3 risk-reward ratio, which—regardless of the outcome—is ideal in my book.

ETHEREUM (ETHUSD): Bullish Continuation Confirmed
I think that ETHEREUM is going to rise.
A double bottom pattern formation on a key daily/intraday support
and a bullish breakout of its neckline show a strong buying interest.
The market is going to reach 2495 level soon.
❤️Please, support my work with like, thank you!❤️

SOLUSDT at Critical Resistance – Will Bears Take Over? Yello, Paradisers! Is SOLUSDT setting up for a major drop? The technicals are flashing warning signs, and you need to pay attention.
💎SOLUSDT has broken down rising wedge, showing a loss of bullish momentum. On top of that, a bearish divergence is appearing, and the price is currently testing key resistance at the 200 EMA—a combination that significantly increases the probability of a bearish move.
💎If SOLUSDT retests the resistance zone and the 200 EMA again, a double top formation could play out. But before jumping in, waiting for bearish confirmation is the smart move.
💎If price breaks above and closes a candle above the resistance, it will invalidate the bearish thesis. In that case, patience is key—waiting for clearer price action will be the best approach.
🎖Trading isn’t about guessing—it’s about waiting for high-probability setups and executing with discipline. Stay sharp, Paradisers, and remember: the market rewards patience, not impulsive moves.
MyCryptoParadise
iFeel the success 🌴

XRP at a Crossroads! Will the Bulls Hold the Line?Yello, Paradisers! Is #XRP gearing up for another breakout, or are we about to see a deeper pullback? The battle at key levels is heating up, and the next move will separate the winners from the losers.
💎#XRPUSDT’s recent hyper pump was triggered by its major support zone at $2.00 – $1.95, where buyers stepped in aggressively. However, the move became unsustainable, leading to a sharp move back lower. Now, XRP is holding above the $2.30 – $2.20 support zone—a critical level that bulls must defend to keep the momentum alive.
💎If buyers maintain control of this support zone at $2.30 to $2.20 over the next few hours, we could see a recovery back toward the $2.70 – $2.80 resistance zone. However, breaking through this level won’t be easy, as XRP still faces key obstacles ahead.
💎The descending resistance, which previously rejected price spikes, remains a major hurdle. A clean breakout above $2.85 with strong volume would confirm real bullish strength and open the doors for a retest of the strong resistance zone at $3.20 – $3.30 levels which is XRP's recent all-time highs and this is the region where sellers are expected to step in aggressively.
Stay patient, Paradisers! The market always rewards discipline. If we see confirmation, we take action. If not, we wait. Trade smart, not fast! 🎖
MyCryptoParadise
iFeel the success 🌴

LTCUSDT on the Edge – Major Breakdown or Fakeout?Yello, Paradisers! Is LTCUSDT on the verge of a major drop? The signs are stacking up, and if you’re not watching closely, you could miss a big move.
💎Right now, LTCUSDT is looking bearish as it forms an M-pattern near the resistance trendline of a descending channel. At the same time, a bearish divergence is confirming the weakness in momentum. On top of that, we’re seeing a triple-three wave pattern playing out, which further increases the probability of a downside move. All these signals combined suggest that sellers are gaining control.
💎If LTCUSDT breaks down and closes candle below the support level, the M-pattern will be validated, opening the door for a significant move lower.
💎However, if the price consolidates around this level without breaking down, the setup loses its strength, and in that case, it’s best to ignore it as a low-probability trade.
💎On the flip side, if LTCUSDT manages to break out and close candle above the resistance zone, the entire bearish outlook would be invalidated. In that scenario, waiting for fresh price action before making any moves would be the smartest approach.
🎖 Discipline and patience separate the pros from the amateurs. Stay sharp, Paradisers—trade only high-probability setups, and you’ll always stay ahead of the game!
MyCryptoParadise
iFeel the success🌴

POPCATUSDT is setting up for a potential long opportunity!
🚀 The price BINANCE:POPCATUSDT.P is testing a critical support level at 0.2056 USDT , and if bulls hold, we could see a strong upward push.
🔑 Key Levels:
Support:
- 0.2056 USDT – Key support, maintaining the trend.
- 0.2010 USDT – Deep liquidity zone for potential wicks.
Resistance:
- 0.2200 USDT – Short-term target for scalpers.
- 0.2774 USDT – Major resistance; breaking above could trigger a rally.
🚀 Trading Strategy:
Long Entry: On a clear bounce from 0.2056 USDT with volume confirmation.
Stop-Loss: Below 0.2010 USDT to avoid liquidity grabs.
Profit Targets:
- 0.2200 USDT – First take-profit for quick gains.
- 0.2500 USDT – Solid mid-term target.
- 0.2774 USDT – Full extension if momentum builds.
📊 Technical Outlook:
- The trend remains bullish as long as support holds.
- Increased volume at support suggests whale accumulation.
- A break below 0.2010 USDT may invalidate the bullish setup.
💡 What to Watch?
- Volume spikes = strong bullish interest.
- Retest of support with a strong bounce = long entry signal.
- Manage risk and avoid FOMO!
