XRP Approaching Critical Resistance—Breakout or Major Rejection?Yello, Paradisers! Is #XRP gearing up for a massive breakout, or is this just another bull trap? Let’s break it down before the market makes its move!
💎#XRPUSDT has been respecting a major ascending channel, holding firm at key support levels. The recent price action has even formed a morning star-like pattern around support, signaling a potential bullish push ahead. But here’s the catch—bulls need to clear the $2.80 resistance first to open the path toward $3.00–$3.10, a major battle zone that could either fuel the next rally or lead to another rejection.
💎If buyers manage to break through the $3.10 resistance, we could see an explosive move toward $3.50–$3.60, aligning closely with the 1.272% Fibonacci extension—a historically significant level where profit-taking could kick in.
💎On the flip side, XRP is still getting solid support from its ascending trendline, which has held strong since December 2024. As long as this structure remains intact, bulls remain in control, and dips will likely be seen as buying opportunities. However, if this support breaks, expect a deep pullback before the next leg up.
Remember, Paradisers, trading is a game of patience and discipline.
MyCryptoParadise
iFeel the success🌴
Cryptosignals

ADAUSDT Breakout Incoming or Another Fakeout?Yello, Paradisers! Are we about to see ADAUSDT explode, or is this just another trap for impatient traders? Let’s break it down!
💎ADAUSDT is looking solid after completing a proper double zig-zag corrective phase. The key to confirming the next move lies in breaking and closing a candle above the resistance level. If this happens, it significantly increases the probability of a bullish breakout. Why? Because ADA is still trading in the discount range of a descending channel, and we’re also seeing bullish divergence—a strong confluence signal for upside momentum.
💎However, if ADA pulls back or retraces further, the smartest play is to wait for inducement. Ideally, we want to see bullish structures form, such as a bullish I-CHoCH or well-known bullish patterns like a W formation or inverse head and shoulders on lower timeframes. If those confirmations appear, the probability of a bullish move shifts in our favor.
💎On the flip side, if ADA falls sharply or closes a candle below the support zone, it would invalidate our bullish scenario. This would likely extend the corrective wave into a deeper structure, signaling that it’s best to stay patient and wait for clearer price action.
🎖 Bottom line? The market is setting up for a major move—either a powerful breakout or a deeper retracement. Only those who wait for the right confirmations will come out on top. Stay disciplined, Paradisers! 🚀
MyCryptoParadise
iFeel the success🌴

BITCOIN (BTCUSD): Time For Correction
Bitcoin looks bearish after a bullish rally on the weekend.
The price reached a significant daily resistance and now is going to retrace.
Goals: 90000 / 88000
❤️Please, support my work with like, thank you!❤️

#VRUSDT continues its uptrend📈 LONG BYBIT:VRUSDT.P from $0.011718
🛡 Stop Loss: $0.011470
⏱ 1H Timeframe
⚡ Action Plan:
✅ BYBIT:VRUSDT.P price broke the resistance level and is consolidating above it, confirming a bullish scenario.
✅ The asset is trading above the POC (Point of Control) at $0.00862, indicating buyer dominance.
✅ Increasing volume on the breakout confirms the strength of the upward movement.
🎯 Target TP Levels:
💎 TP 1: $0.012110
📢 A breakout above $0.011718 will confirm the continuation of the uptrend.
📢 POC $0.00862 remains a key support zone.
📢 Rising volume at the breakout suggests a high probability of reaching target levels.
📢 Partial take-profit at TP1 ($0.012110) helps minimize risks in case of a pullback.
🚀 BYBIT:VRUSDT.P continues its uptrend – watch for upward movement and secure profits at TP!

Solana’s 60% Correction: Time to Buy the Dip?After reaching an all-time high around the $300 zone, Solana experienced a sharp decline of approximately 60%, dropping to a key support level above $120.
This pullback could present a strong buying opportunity for speculators anticipating a reversal toward $200.
Conclusion:
✅ Dips below $140 should be considered potential entry points.
✅ The setup becomes invalid if the price closes below $120 on a daily basis.
✅ A move toward $200 remains a reasonable and achievable target.

ICP Trading Plan: Buying Dips with a 1:3 Risk-Reward RatioLike most altcoins, ICP has been declining since December. At the beginning of February, it reached a key support level around $6. After this drop, the coin began to consolidate, but recent price action suggests a potential reversal to the upside.
A confirmed breakout above $7 would strengthen this outlook, potentially leading to a test of the psychologically significant $10 level.
I’m looking to buy dips in anticipation of this scenario, aiming for a minimum risk-to-reward ratio of 1:3.

BTC FOR SCALPERS AND DAY TRADERS *17500 POINTS **
Guys pls like, share and follow my ideas
Entry price ,stoploss and Target already marked in the chart itself FYI.
Thank You All

Bitcoin longReason for this trade is that price is very cheap and good support around here. Bitcoin long entry 79,414 Stoploss 78,750 target profit 120k or 200k or higher.

#QNT Ready For Bullish Rally Despite Bearish Market Sentiment Yello, Paradisers! Is #QNTUSDT About to Break Out, or Will Bears Keep It Trapped? Let's check the latest setup of #Quant and see what might happen next:
💎#QNT has been trapped inside this wedge for months, making lower highs and lower lows. #QNTUSD is showing signs of a potential breakout, but there’s one key resistance level above that could decide everything.
💎Bulls need to break above $115, which has been a major rejection point. A clean breakout here could trigger a rally towards $140-$160, where the next strong resistance zone is waiting. The MACD is showing higher highs while price made lower lows, a classic bullish divergence. This signals that momentum is shifting in favor of buyers.
💎Strong support is around $80-$85, where buyers have stepped in multiple times. Losing this level would lead to a drop to $61-$55, the next major support zone. The Bulls have defended both of these levels before, so they will probably do so this time, too.
💎However, if the bears drag the price below the $55-$61 support level, the bullish setup will be invalidated. In such a case, the bears will drag the price to down levels further.
Stay focused, patient, and disciplined, Paradisers🥂
MyCryptoParadise
iFeel the success🌴

HOOKUSDT Breakdown Incoming? Key Signals Point to Bearish Move!Yello, Paradisers! Is HOOKUSDT gearing up for a major drop? The current structure suggests a strong probability for further downside as the price follows a triple three-wave pattern within a descending channel.
💎HOOKUSDT recently faced strong resistance from multiple confluences: 50 EMA rejection, Key resistance zone, Descending channel’s trendline, Formation of an "M" pattern. These factors increase the likelihood of a wave Z move downward. However, for confirmation, we need a clear breakdown of the support level with a candle close below it and high volume.
💎The broader crypto market also leans bearish, but waiting for the actual breakdown will further strengthen our probability of a successful trade.
💎Invalidation? If the price bounces and closes candle above the resistance zone, the bearish outlook gets invalidated. In that case, it’s smarter to stay patient and wait for a stronger setup.
🎖 Discipline and patience are key, Paradisers! The market always rewards those who wait for the highest-probability trades. Stay sharp!
MyCryptoParadise
iFeel the success🌴

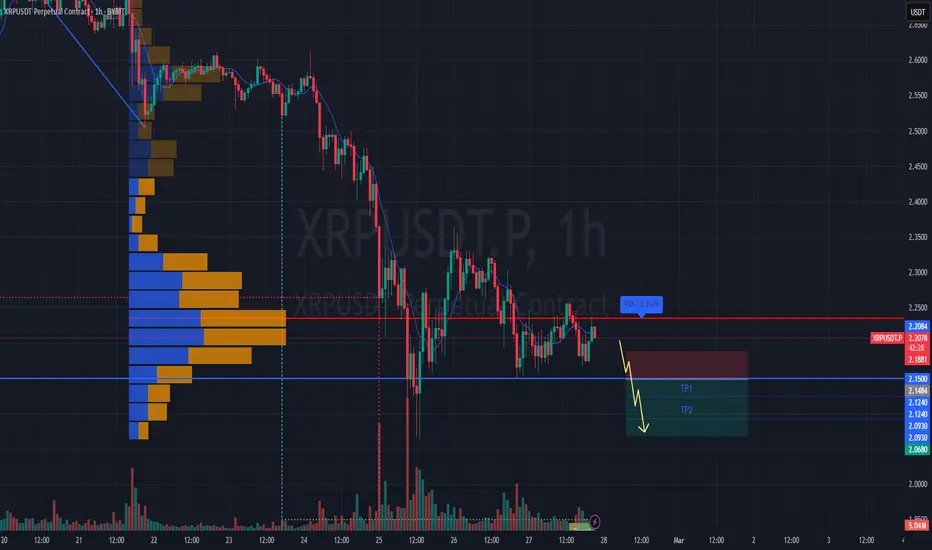
#XRPUSDT – Bearish Scenario, Expecting a Breakdown📉 SHORT BYBIT:XRPUSDT.P from $2.1484
🛡 Stop Loss: $2.1881
⏱ 1H Timeframe
⚡ Trade Plan:
✅ The BYBIT:XRPUSDT.P price is consolidating below POC (Point of Control) at $2.2119, indicating strong seller dominance.
✅ Attempts to push higher have been quickly rejected, suggesting buyer weakness.
✅ If the current support breaks, a strong downward move is likely.
🎯 TP Targets:
💎 TP 1: $2.1240
🔥 TP 2: $2.0930
⚡ TP 3: $2.0680
📢 A close below $2.1484 would confirm further downside movement.
📢 POC at $2.2119 is a major volume area, now acting as resistance.
📢 Increasing volume on the drop supports the bearish outlook.
📢 Taking partial profits at TP1 ($2.1240) is a smart risk-management strategy.
🚨 BYBIT:XRPUSDT.P remains under selling pressure – monitoring for confirmation and securing profits at TP levels!
Long Entry Signal for SUNDOG/USDT Based on the daily chart for SUNDOGUSDT on Bybit, here's a concise analysis:
MLR vs. SMA: The MLR (blue) is above the SMA (pink), indicating a bullish trend.
MLR vs. BB Center: The MLR is above the BB Center Line (orange), suggesting bullish momentum.
PSAR: The PSAR dots (black) are under the price, confirming a bullish trend.
Exception: There is no 200-period SMA available to guide us on the long-term trend, so proceed with caution.
Current Strategy: Since all entry conditions for a long position are met (MLR above SMA, MLR above BB Center, PSAR under price), you might consider entering a long position.
Stop Loss (SL): Set the stop loss at the current level of the PSAR dots to manage risk.
Monitor My Idea: Keep monitoring my idea for any changes in trend or for potential profit-taking opportunities.
Thank you !

Long Entry Signal for AGLD/USDTBased on the daily chart for AGLDUSDT on Bybit, here's a concise analysis:
MLR vs. SMA: The MLR (blue) is above the SMA (pink), indicating a bullish trend.
MLR vs. BB Center: The MLR is above the BB Center Line (orange), suggesting bullish momentum.
PSAR: The PSAR dots (black) are under the price, confirming a bullish trend.
Price vs. SMA 200: The price is above the 200-period SMA (red), supporting a long-term bullish trend.
Current Strategy: Since all entry conditions for a long position are met (MLR above SMA, MLR above BB Center, PSAR under price, price above SMA 200), you might consider entering a long position.
Stop Loss (SL): Set the stop loss at the current level of the PSAR dots to manage risk.
Monitor My Idea: Keep monitoring my idea for any changes in trend or for potential profit-taking opportunities.

Long Entry Signal for GRASS/USDT Based on the daily chart for GRASSUSDT on Bybit, here's a concise analysis:
MLR vs. SMA: The MLR (blue) is above the SMA (pink), indicating a bullish trend.
MLR vs. BB Center: The MLR is above the BB Center Line (orange), suggesting bullish momentum.
PSAR: The PSAR dots (black) are under the price, confirming a bullish trend.
Exception: There is no 200-period SMA available to guide us on the long-term trend, so proceed with caution.
Current Strategy: Since all entry conditions for a long position are met (MLR above SMA, MLR above BB Center, PSAR under price), you might consider entering a long position.
Stop Loss (SL): Set the stop loss at the current level of the PSAR dots to manage risk.
Monitor My Idea: Keep monitoring my idea for any changes in trend or for potential profit-taking opportunities.
Thank you!

Long Entry Signal for DEXE/USDT Based on the daily chart for DEXEUSDT on Bybit, here's a concise analysis:
MLR vs. SMA: The MLR (blue) is above the SMA (pink), indicating a bullish trend.
MLR vs. BB Center: The MLR is above the BB Center Line (orange), suggesting bullish momentum.
PSAR: The PSAR dots (black) are under the price, confirming a bullish trend.
Price vs. SMA 200: The price is above the 200-period SMA (red), supporting a long-term bullish trend.
Current Strategy: Since all entry conditions for a long position are met (MLR above SMA, MLR above BB Center, PSAR under price, price above SMA 200), you might consider entering a long position.
Stop Loss (SL): Set the stop loss at the current level of the PSAR dots to manage risk.
Monitor My Idea: Keep monitoring my idea for any changes in trend or for potential profit-taking opportunities.

OL/USDT Long Re-entry signal
On February 15th, we received an entry signal when the PSAR turned bullish. On February 18th, the PSAR was hit, signaling an exit. On February 22nd, the day closed above the initial entry level from February 15th. This gives us a potential opportunity to enter again since we had a close above the original entry signal. You can enter now or wait for the daily close; it’s your choice.
However, there is no 200-period SMA available to guide us on the long-term trend, so proceed with caution.
Stop Loss (SL): Set the stop loss at the current level of the PSAR dots to manage risk.
Monitor My Idea: Keep monitoring my idea for any changes in trend or potential profit-taking opportunities.
Thank you!

Long Entry Signal for PROM/USDTBased on the daily chart for PROMUSDT on Bybit, here's a concise analysis:
MLR vs. SMA: The MLR (blue) is above the SMA (pink), indicating a bullish trend.
MLR vs. BB Center: The MLR is above the BB Center Line (orange), suggesting bullish momentum.
PSAR: The PSAR dots (black) are under the price, confirming a bullish trend.
Price vs. SMA 200: The price is above the 200-period SMA (red), supporting a long-term bullish trend.
Current Strategy: Since all entry conditions for a long position are met (MLR above SMA, MLR above BB Center, PSAR under price, price above SMA 200), you might consider entering a long position.
Stop Loss (SL): Set the stop loss at the current level of the PSAR dots to manage risk.
Monitor My Idea: Keep monitoring my idea for any changes in trend or for potential profit-taking opportunities.

Long Signal Entry for ACH/USDT
Based on the daily chart for ACHUSDT on Bybit, here's a concise analysis:
MLR vs. SMA: The MLR (blue) is above the SMA (pink), indicating a bullish trend.
MLR vs. BB Center: The MLR is above the BB Center Line (orange), suggesting bullish momentum.
PSAR: The PSAR dots (black) are under the price, confirming a bullish trend.
Price vs. SMA 200: The price is above the 200-period SMA (red), supporting a long-term bullish trend.
Current Strategy: Since all entry conditions for a long position are met (MLR above SMA, MLR above BB Center, PSAR under price, price above SMA 200), you might consider entering a long position. You can enter now or wait for the close of the day, depending on your availability. Waiting for the close of the day would be preferred to confirm the trend.
Stop Loss (SL): Set the stop loss at the current level of the PSAR dots to manage risk.
Monitor My Idea: Keep monitoring my idea for any changes in trend or potential profit-taking opportunities.

Is SNXUSDT About to Make a Big Move? Yello, Paradisers! SNXUSDT has shown an ideal retracement, setting up a high probability for a bullish bounce from the current support zone.
💎There’s potential for a W-pattern formation here. If the price successfully breaks out and closes candle above the resistance level, this would significantly increase the likelihood of a bullish continuation.
💎However, while a bullish move is possible, the probability at this stage is relatively low, making it a scenario worth watching but not acting on just yet.
💎If panic selling or a deeper retracement occurs, the strong support zone below may offer a favorable bounce. To increase confidence in this setup, we need to see a bullish I-CHoCH (internal change of character) on lower timeframes.
💎On the flip side, if SNXUSDT breaks down and closes candle below the strong support zone, the bullish thesis will be invalidated. In that case, it’s best to remain patient and wait for more favorable price action to develop.
🎖Always remember, Paradisers, discipline and patience are the keys to consistent profitability. Avoid making emotional decisions and stick to your strategy. The market rewards the patient!
MyCryptoParadise
iFeel the success🌴

ARBUSDT at a Crossroads: Breakout or Rejection Incoming?Yello, Paradisers! Is ARBUSDT gearing up for a breakout, or will it face rejection? Let’s break it down.
💎#ARBUSD is currently testing a major descending trendline while hovering above key support zones at $0.4246. Buyers are showing strength, but the resistance ahead could dictate the next move.
💎If #Arbitrum breaks out and closes above the trendline and 200 EMA with strong volume, it will confirm a bullish push toward the supply zone at $0.4604 - $0.4946. This would signal a shift into a markup phase, with momentum favoring the bulls.
💎 If the price consolidates or struggles at resistance with weak volume, it could indicate hesitation. In this case, sideways movement or a rejection could follow, meaning it's best to wait for clearer confirmation before entering a trade.
💎If #ARB fails to break the descending resistance and closes below the demand zone at $0.4047, the bullish setup is invalidated, and further downside becomes the next likely scenario, aligning with the broader downtrend.
Discipline and patience win the game, Paradisers! If the breakout happens with strong volume, we strike. If hesitation or rejection appears, we wait. No need to force trades we move when the market moves.
MyCryptoParadise
iFeel the success 🌴

BITCOIN - BEARISH SCENARIOHello Traders !
On the daily time frame, The BTC price reached a strong support level (89000 - 92000).
So, Let's expect the Bearish Scenario📉
if the market breaks the support level and closes below that,
We will see a huge bearish move📉
__________
TARGET: 74500🎯

PEPEUSDT: A Massive Move Incoming?Yello, Paradisers! Is PEPEUSDT gearing up for a breakout, or will it crumble under pressure? Let's break it down.
💎PEPEUSDT has formed an ending diagonal with a clear 5-wave structure and bullish divergence, increasing the probability of an upcoming bullish move. But here's the catch—it all depends on key levels and volume confirmation.
💎If PEPEUSDT breaks out and closes a candle above resistance with strong volume, it will signal strength and increase the likelihood of a continued bullish push.
💎If price consolidates with weak volume, it’s better to stay on the sidelines—especially with the broader crypto market looking bearish for now. No need to force trades.
💎However, If PEPEUSDT breaks down and closes below the support zone, it completely invalidates the bullish setup. In this case, stepping aside is the best move.
🎖 Discipline and patience always win in this market, Paradisers. If the market gives confirmation, we strike. If not, we wait. Trade smart!
MyCryptoParadise
iFeel the success 🌴

#TRUMPUSDT – Bearish Scenario, Expecting a Downward Breakout📉 SHORT BYBIT:TRUMPUSDT.P from $12.492
🛡 Stop Loss: $12.785
⏱️ 1H Timeframe
⚡️ Trade Plan:
✅ The BYBIT:TRUMPUSDT.P price continues to decline after a recent sharp drop.
✅ The chart shows that the asset is consolidating below POC (Point of Control) at $13.105, indicating seller dominance.
✅ The price is testing a support level, and a breakdown could trigger a stronger bearish move.
🎯 TP Targets:
💎 TP 1: $12.305
🔥 TP 2: $12.110
⚡️ TP 3: $11.966
📢 A close below $12.492 would confirm the downward move.
📢 POC at $13.105 is a key volume area that now acts as resistance.
📢 Increasing volume on the decline supports the bearish trend.
📢 Securing partial profits at TP1 ($12.305) is a risk-management strategy.
🚨 BYBIT:TRUMPUSDT.P remains under pressure – monitoring for a confirmed breakdown and securing profits at TP levels!
