Will #TIA Continue to Soar or Bears Can Halt it? Must Watch Yello, Paradisers! Will we see #TIA continue to soar from here, or can bears halt its momentum? Let's see the latest setup of #Celestia to see what's going to happen:
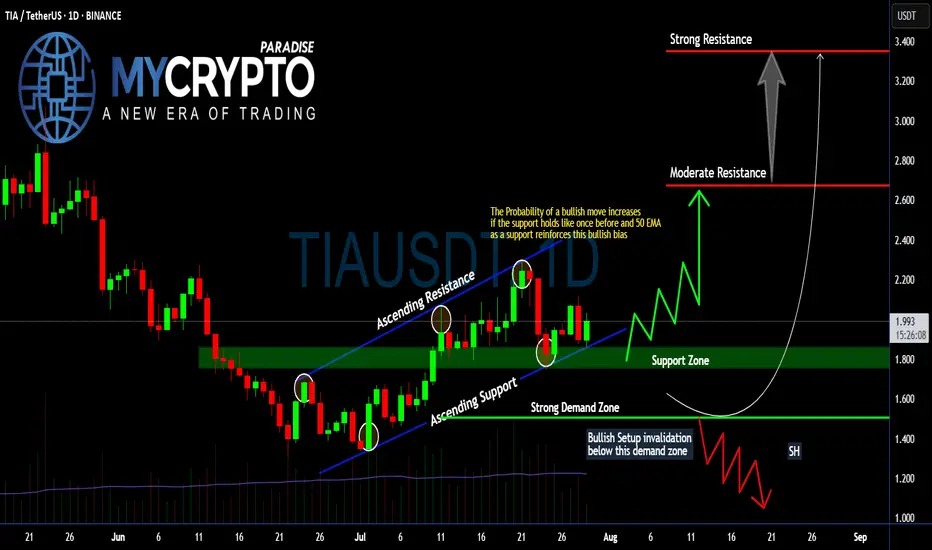
💎Following a textbook ascending channel structure, #TIAUSDT has been respecting both its ascending resistance and ascending support, with each touchpoint confirming trader participation and growing confidence. Price is currently holding above the 50 EMA and within a crucial support zone between $1.80–$1.90—an area that previously triggered a strong impulse move to the upside.
💎The probability of a bullish continuation increases significantly as long as the #TIAUSD respects this support zone and the 50 EMA acts as dynamic support. If this level continues to hold, we expect a move toward the moderate resistance around $2.67, the key area where sellers previously stepped in aggressively.
💎But that’s not all—if bulls gain momentum and break above $2.67 with strong volume, the next price magnet becomes the $3.34 level, where strong resistance and high-volume node overlap. This level would likely be the point of exhaustion unless broader market momentum takes over.
💎However, caution is critical here. If price breaks below the strong demand zone around $1.507, this invalidates the bullish structure entirely and opens the door for a swift move down toward the $1.20–$1.00 range, where a potential market shakeout could occur. Remember, a failed bullish setup often becomes a powerful bear trap for undisciplined traders.
Stay patient, Paradisers. Let the breakout confirm, and only then do we strike with conviction.
MyCryptoParadise
iFeel the success🌴
Cryptosignals
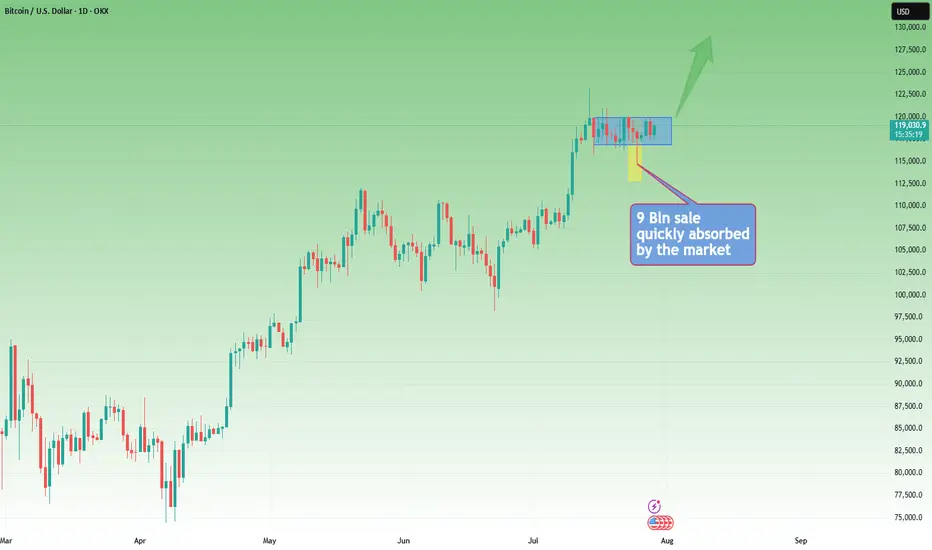
Rectangle Consolidation + Bull Trend = BTC Setup for ATHYesterday, Bitcoin dipped and recovered again, following last week's sharp spike down, triggered by the $9B Galaxy Digital sale on behalf of a Satoshi-era investor.
________________________________________
🧠 Why is this important?
Despite being one of the largest BTC sales in history, the move only caused a temporary spike down.
That’s a clear sign of market strength and strong interest on dips.
________________________________________
📉📈 Current Technical Context:
• If we ignore the spike, price is consolidating in a tight rectangle
• That’s typically a continuation pattern
• The broader trend remains strongly bullish
📌 Put all of that together, and we have at least 3 reasons to expect upside continuation
________________________________________
🎯 Key Levels:
• Break + daily close above $120K → likely leads to a new ATH and a potential test of $130K
• Invalidation only comes with a break below $114K
________________________________________
Conclusion:
BTC just absorbed a massive $9B sell without blinking.
As long as $114K holds, I'm bullish and expecting continuation.
Next leg could (and I hope it will) be explosive. 🚀
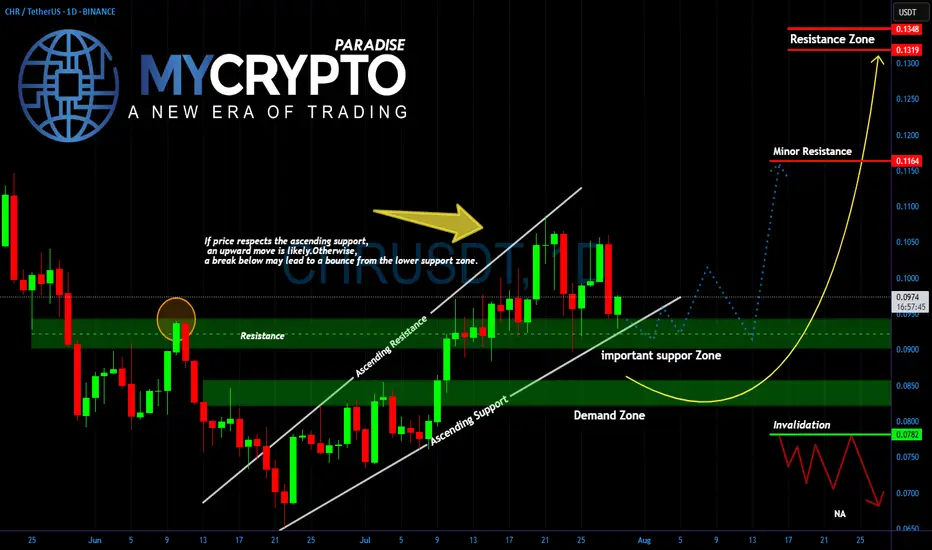
CHR Is About to Explode or Collapse Are You Ready for the Next BYello Paradisers, did you notice how #CHRUSDT is now testing the exact zone we warned about earlier? After weeks of climbing inside a clean ascending channel, the price is now sitting right on top of a critical support area. This is no coincidence what happens here will determine the next major wave.
💎The structure remains bullish as long as #CHR respects the ascending support trendline and the horizontal zone around 0.0900. This region, previously a strong resistance, is now acting as key support. If the bulls step in from here, we could see a sharp rebound toward the minor resistance near 0.1169. A confirmed breakout above that could open the path toward the upper resistance zone between 0.1320 and 0.1351.
💎But don’t get too comfortable. A clean break below this support zone would shift momentum back to the downside, dragging price toward the deeper demand area between 0.0840 and 0.0800. If the structure fully collapses and price breaks below 0.0782, we’d treat that as a clear invalidation of the bullish case, and a much lower range could open up.
For now, CHR remains in a waiting zone. It’s the reaction here that will give us the signal. Let the price come to you don’t chase it.
MyCryptoParadise
iFeel the success🌴
From Hype to Hesitation: What’s Next for Pump Fun ($PUMP)?Today, I want to break down the recent developments and fundamentals of Pump fun ( BYBIT:PUMPUSDT ) and its token PUMP — a project that initially launched with strong hype but is now facing serious investor concerns .
What is Pump fun?
Pump fun is a memecoin launchpad that allows users to launch and trade memecoins in a gamified, simplified environment. The idea was to create a frictionless way for anyone to generate and speculate on meme tokens, leveraging viral growth and community culture.
Its native token, PUMP , was introduced via an ICO priced at $0.004, with 12.5% of the total 1 trillion supply offered during the sale.
Latest Updates – Past 24 Hours Recap
PUMP Crashes Over 50% After ICO :
The token initially spiked to $0.0068 on launch day (July 16) , but has now dropped over 50%.
This is roughly 14% below its ICO price , creating concerns for short-term investors.
Founder Confirms No Airdrop Anytime Soon:
In a livestream with ThreadGuy , project founder Alon Cohen confirmed:
“ The airdrop is not going to be taking place in the immediate future. ”
While the team still plans to deliver an airdrop, Alon emphasized it must be well-executed and meaningful, not rushed for hype.
The current focus is on long-term growth and ecosystem sustainability, not short-term incentives.
Mixed Investor Sentiment:
High-profile trader Machi Big Brother ( Jeffrey Huang ) reportedly increased his long position in PUMP — even though he’s down over $5.8M on his position.
Meanwhile, two wallets linked to private sale investors dumped over 1.2B PUMP at $0.003 , taking a combined loss of $1.19M.
Declining Volume and Market Cap:
Trading volume has dropped significantly.
PUMP has lost over 40% of its value in the past 7 days.
Short-term holders appear uncertain, while the project team asks for patience and long-term vision.
Fundamental Outlook:
Pump fun’s future now heavily depends on:
The real utility of the platform as a meme coin incubator.
The team’s ability to regain trust after delaying the airdrop.
Whether new features or hype can revive volume and user engagement.
-------------------------------
Now, let's examine the PUMP token from a technical analysis perspective
From the outset, I must say that due to the small number of candlesticks that create the PUMP token, technical analysis may be a bit difficult , but we will use technical analysis tools to analyze this token.
The PUMP token seems to be moving in a descending channel since the beginning of its correction (over -50%) until now, we need a second price bottom to confirm the descending channel.
I expect the PUMP token to rise from the Potential Reversal Zone(PRZ) and near the Support lines to $0.0029(+15%) . PUMP Token increase can also be from the bottom of the ascending channel .
Second target: the upper line of the ascending channel.
Cumulative Long Liquidation Leverage: $0.002810-$0.002530
Cumulative Short Liquidation Leverage: $0.003498-$0.00327
Note: Stop Loss(SL): $0.002391
Please respect each other's ideas and express them politely if you agree or disagree.
Pump fun Analyze (PUMPUSDT), 1-hour time frame.
Be sure to follow the updated ideas.
Do not forget to put a Stop loss for your positions (For every position you want to open).
Please follow your strategy and updates; this is just my Idea, and I will gladly see your ideas in this post.
Please do not forget the ✅' like '✅ button 🙏😊 & Share it with your friends; thanks, and Trade safe.

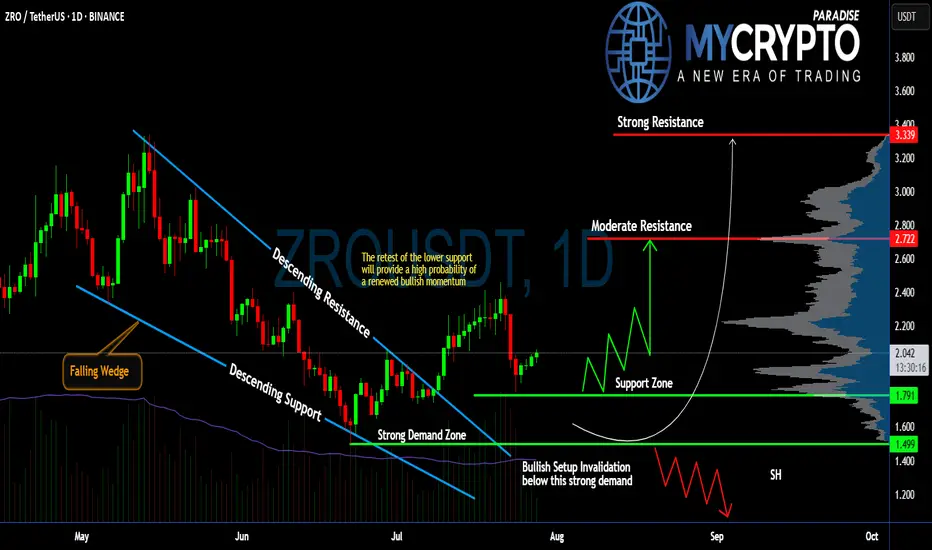
Will #ZRO Continue to Climb or Not? Must Watch For BullsYello, Paradisers! Are we witnessing the beginning of a powerful bullish reversal on #ZROUSDT, or is this just a fakeout setup? Let’s dissect this setup of #LayerZero:
💎After weeks of consistent bleeding, #ZRO has printed a classic falling wedge pattern, often a precursor to bullish reversals. This wedge has now been broken to the upside, with price currently trading around $2.037, suggesting renewed buyer interest following the breakout from descending resistance.
💎What’s crucial here is the retest of the wedge’s descending support, which aligns perfectly with a strong demand zone between $1.499 and $1.791. As long as #ZROUSD respects this zone, the probability of a bullish continuation remains high. This zone also serves as a clear invalidator for the setup—if price closes below $1.499, the bullish thesis will be off the table.
💎From here, if bulls can maintain control, we’re eyeing a potential move toward the moderate resistance at $2.722. That’s the first real hurdle where profit-taking or short interest could spike. A clean break above that level would open the path to the strong resistance around $3.339, where a heavy supply zone is likely to cap further upside.
💎Until then, we expect a series of zigzag corrections above the support zone before any sustained push higher. However, be cautious, losing the $1.499 support turns the structure bearish and could drag the price toward the $1.20 region, or lower.
Stay patient, Paradisers. Let the breakout confirm, and only then do we strike with conviction.
MyCryptoParadise
iFeel the success🌴
CARDANO (ADAUSD): Bullish Move Ahead!
ADA is testing a key daily support cluster.
I think the market is going to bounce from that
and continue growing.
Next resistance - 0.97
❤️Please, support my work with like, thank you!❤️

GOAT Looks Bullish (12H)It seems that a wave A of a higher-degree structure has completed, and the price is forming a triangle at the bottom, preparing for an upward movement in the form of either a wave B or a new impulse wave. Since this wave belongs to a higher degree, we expect the upcoming bullish wave to take time and show a significant upward retracement.
Try to avoid entering during pumps, and instead focus on entries during price corrections.
As long as the green zone holds, the price has the potential to move upward.
A daily candle closing below the invalidation level will invalidate this outlook.
For risk management, please don't forget stop loss and capital management
When we reach the first target, save some profit and then change the stop to entry
Comment if you have any questions
Thank You

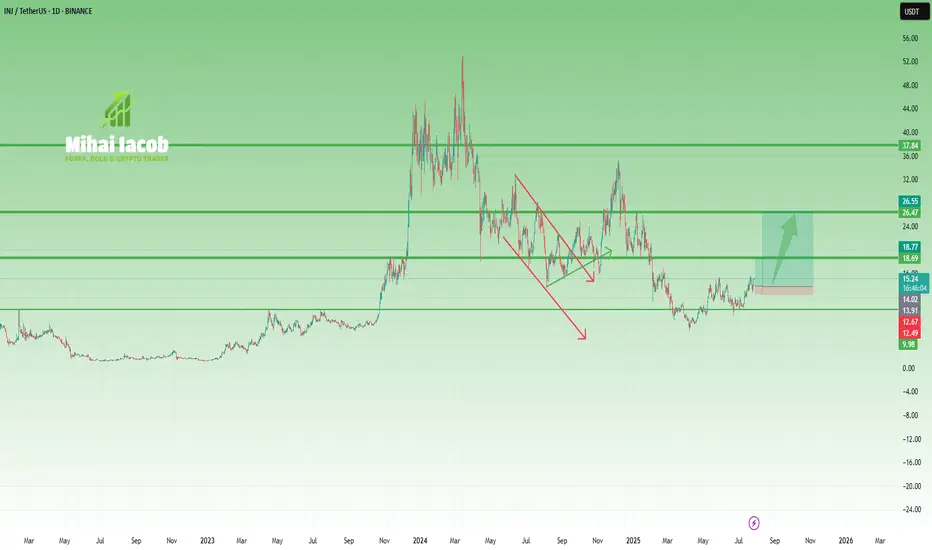
INJ – From Overhyped to Reasonable OpportunityA year and a half ago, INJ was in full hype mode, with fantasmagorical predictions of $200+, even though the coin had already done a 40x move.
(And not to brag—but at that moment, with INJ trading around $40, I said that $10 was far more likely than $200. It actually dropped to $6.5...)
Fast forward to today, and things are starting to look more constructive—at least, if you're not aiming for the moon:
🔹 After the local low at $6.5, price formed a small inverted Head & Shoulders
🔹 Then it confirmed new support at $10, a key psychological level and neckline zone
🔹 Now it's pressing into the $15.5 resistance
From my perspective, the setup is starting to favor the bulls.
If we get a clean breakout above $15.5, the next resistance is around $20, but I wouldn’t be surprised to see a push to $25–26, or even slightly above $30, if momentum builds.
📌 Not a hype call.
It’s a realistic technical setup, built on structure—not dreams.
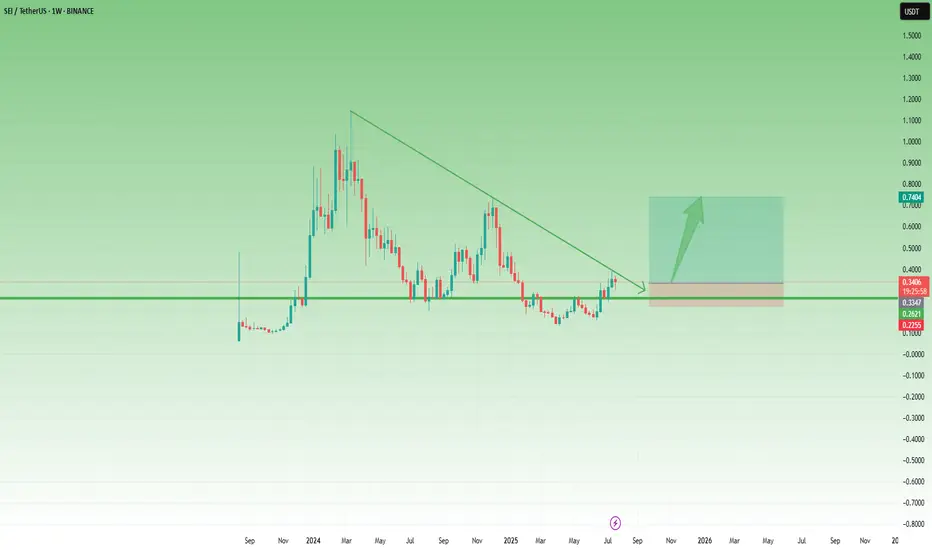
SEI Breakout Setup: Buy the Dip Before the Next Leg UpAfter the low around 0.13 in April, SEI started to recover, and although the first attempt to reclaim the 0.25–0.26 zone failed in mid-May, that key area—a former support from last year—was finally broken at the end of June.
Now, this previous resistance has turned into support, and even though gains have so far been capped by the falling trendline, price is consolidating above support – which could be a sign of bullish pressure building.
If we get a clean break above this descending trendline, momentum could accelerate, opening the way for a push toward the 0.75 resistance.
This is exactly the scenario I’m working with.
I'm looking to buy dips, with an ideal entry around 0.30, while keeping in mind that a move below 0.25 would invalidate the setup.
✅ Risk-reward? With a stop below 0.25, this setup offers a 1:4 R:R, and even a realistic chance at a 2x trade, which would be quite reasonable under current market conditions.
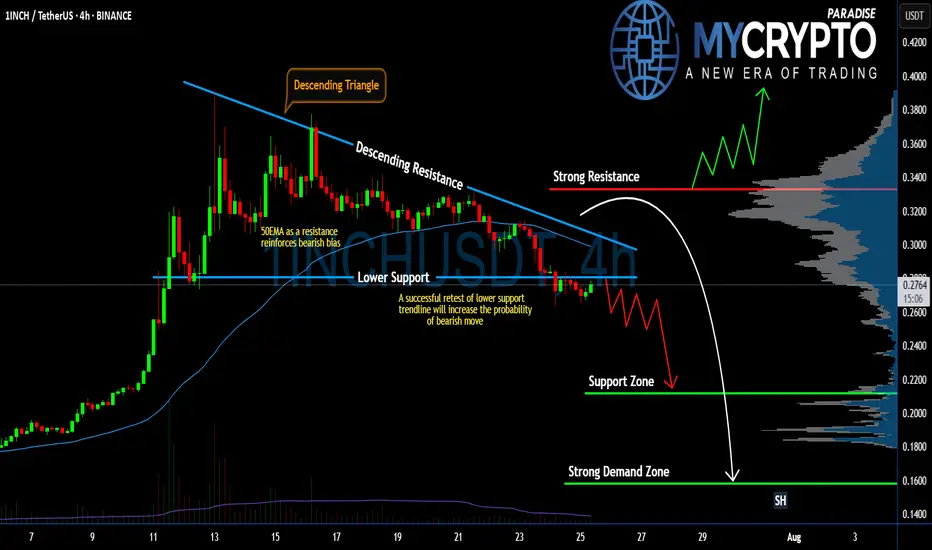
#1INCH Setup Favors Bears | Can Bears Pull it Down Further? Yello Paradisers! Are you prepared for what might be the next big move on #1INCHUSDT? The #1INCHNetwork is flashing clear warning signs:
💎#1INCH is currently trading inside a Descending Triangle, a pattern that historically favors bears. The price has broken down the lower support and is coming to retest it. If #INCHUSD retests the lower support and doesn't enter the descending triangle, the probability of the bearish pressure will increase.
💎The 50 EMA is acting as a strong dynamic resistance, reinforcing the bearish bias. Every attempt to reclaim higher levels has been rejected, and as long as we remain capped below the descending resistance, bulls are at a clear disadvantage.
💎A successful retest of the lower support trendline will significantly increase the probability of a breakdown. If this triangle finally breaks to the downside, we should be watching the $0.2116 support zone as the first key level to catch any temporary reaction.
💎But the real danger — and opportunity for patient traders — lies lower. If $0.2116 fails, the next strong demand zone sits at $0.1582, which could be the level where real buyers finally step back in. Until then, any bullish scenario remains invalid unless the price breaks and closes above the strong resistance at $0.3332.
Trade smart, Paradisers. This setup will reward only the disciplined.
MyCryptoParadise
iFeel the success🌴
BITCOIN (BTCUSD): Recovery Starts
Bitcoin is going to rise from a key daily support.
After a liquidity grab, the market shows a clear strength,
forming a double bottom on an hourly time frame.
I expect a bullish movement at least to 117100
❤️Please, support my work with like, thank you!❤️
I am part of Trade Nation's Influencer program and receive a monthly fee for using their TradingView charts in my analysis.

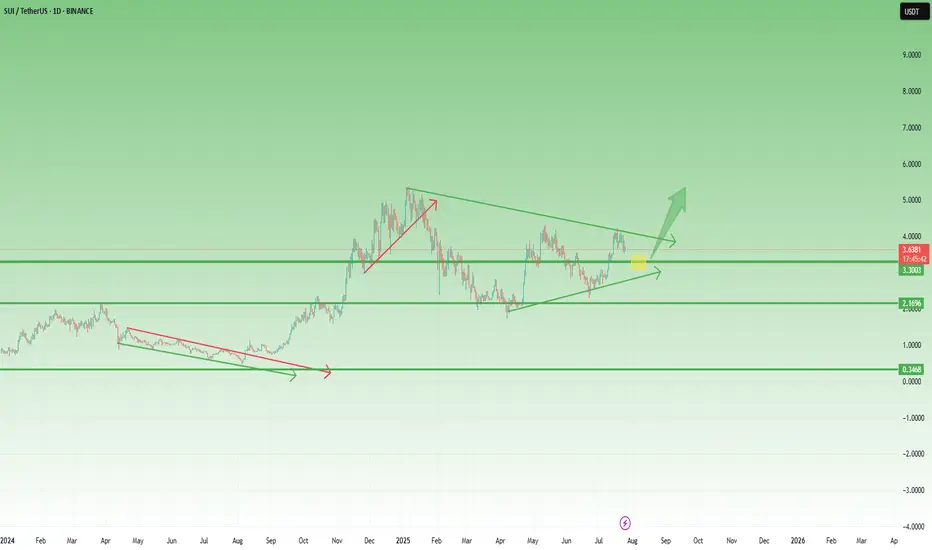
SUI – Preparing for a Breakout? Symmetrical Triangle in PlaySince the beginning of the year, SUI has been consolidating inside a classic symmetrical triangle — marked by higher lows and lower highs, a sign of tightening price action and growing pressure.
This kind of structure doesn’t last forever.
Usually, it ends with a strong breakout — especially if supported by volume.
🔍 What to watch:
- A break above the upper trendline could trigger a strong move, with potential targets in the $5 area and even a new ATH, if altcoins enter a real revival phase.
- On the flip side, $2.80 remains the key support level.
As long as it holds, bulls remain in control of the structure.
📍 My game plan:
I’m watching the $3.25 area as a potential buy zone —a great spot inside the pattern, offering tight risk and strong upside if the breakout comes.
Until then, it’s all about patience.
Pressure is building. The triangle is tightening.
And the market is waiting for a reason to move.
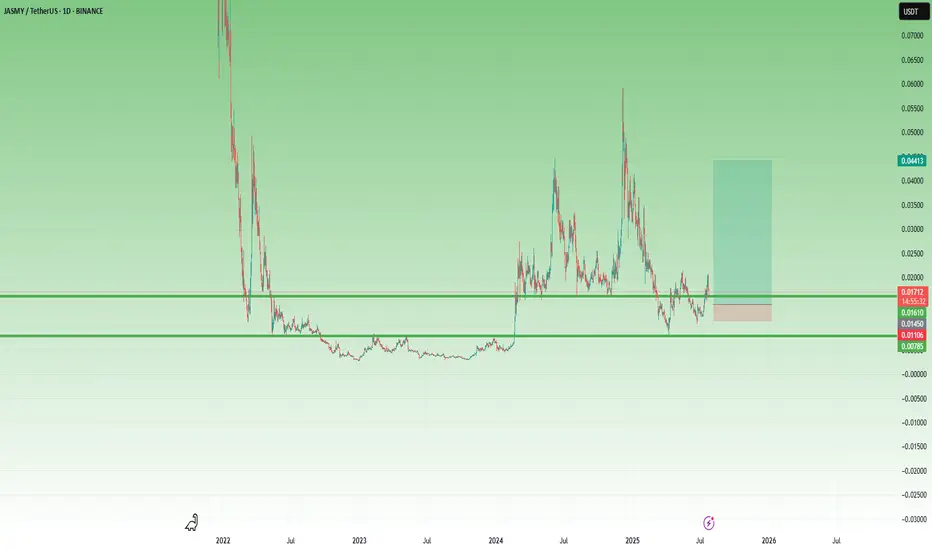
JASMY – A Volatile Setup with x3 Potential 🔸 After bottoming out at 0.003 and spending over a year in accumulation, JASMY finally broke above the key 0.008 resistance zone in February 2024. That breakout triggered a series of explosive moves – but just as violent were the drops that followed.
🔸 What stands out:
• The first post-breakout spike found a new support at 0.015.
• Then came a second vertical move toward 0.06, followed (of course) by a brutal drop.
• But… 0.008 held, and by late June, the chart printed a higher low, showing that buyers became interested.
📍 Right now, the price has reclaimed the 0.015 zone and is trying to stabilize above it. If this level holds, it could become the new base for the next wave.
💡 My plan?
This is very speculative, but I like the setup.
I’m looking to buy around 0.015–0.016, with clear negation below 0.010.
Target? Around 0.045, for a potential x3 move and a tasty 1:8 risk/reward.
⚠️ I’m not the guy who repeats the cliché “ only trade what you can afford to lose, ”
but seriously – this one is for clubbing money, not summer vacation money.
Let the volatility work in our favor. 🚀
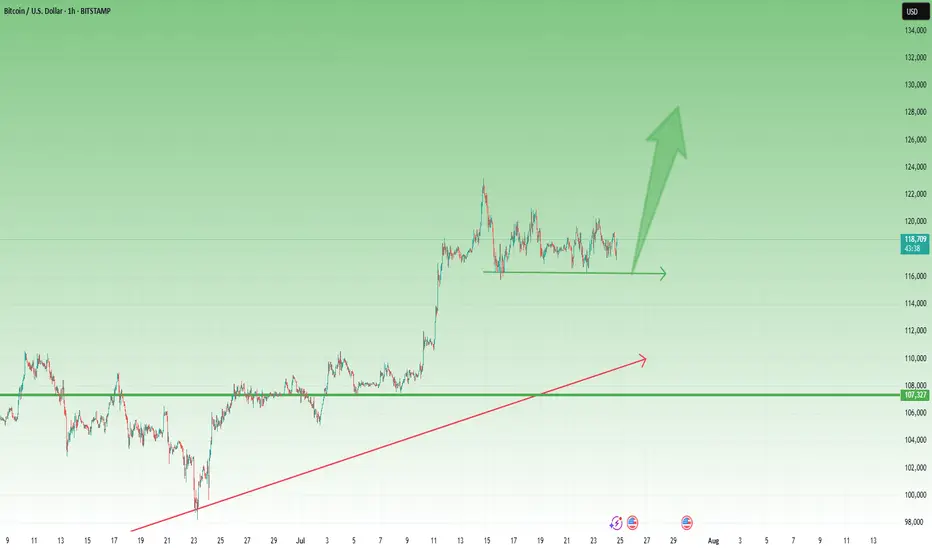
BTCUSD – Bulls Still in Control After New ATH 🔸 After the new All-Time High printed 10 days ago, Bitcoin entered a consolidation phase. So far, the market looks healthy and seems to be waiting for a trigger to continue the uptrend.
🔸 A clear support zone has formed around 116k, and as long as this level holds, bulls remain in full control of the market.
📉 For short-term traders and speculators:
Buying dips near 117.5k could offer solid risk/reward setups, with a target around 125k in case of a breakout.
Let’s see if the market gives us the trigger we’re waiting for. 🚀
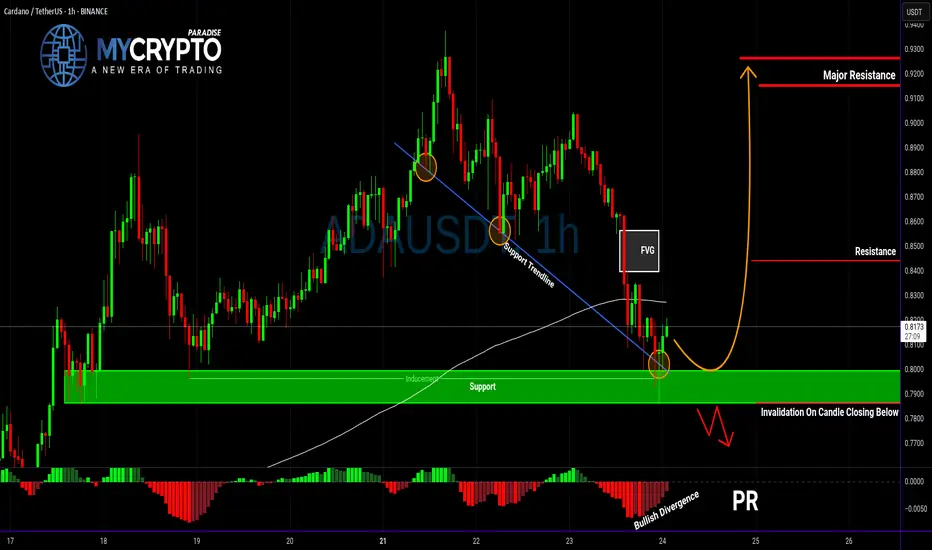
ADA About to Explode or Collapse?Yello Paradisers — is ADA gearing up for a breakout, or are we walking straight into a bull trap? After the recent pullback, the market is throwing mixed signals, but this setup is becoming too important to ignore. Here’s what we’re seeing right now on ADAUSDT.
💎ADA is currently showing positive signs of strength after a solid retracement. Current support zone is not only a historical price pivot, but it's also aligned with a supportive trendline, the 200 EMA, and a developing bullish divergence on the chart. All these factors combined are increasing the probability of a short-term bounce — but that doesn't mean we go in blind.
💎For aggressive traders, entering at the current price might make sense, especially if you’re targeting the first resistance level. However, it’s important to note that this entry offers a relatively limited reward compared to the risk — roughly a 1:1 risk-reward ratio — so it’s crucial to size your position accordingly and keep tight control over your stop loss.
💎If you're looking for a cleaner setup with a better risk-to-reward profile, patience is key. A more favorable scenario would be waiting for a proper pullback and a confirmed retest of the support zone. Ideally, you want to see a strong bullish candle at the support level to signal continuation — that’s when the setup shifts from average to high-probability.
💎But be cautious. If the price breaks down and closes a candle below our support zone, the entire bullish idea becomes invalid. In that case, it’s much wiser to step back and allow the market to develop more structure before re-engaging. Forcing trades in uncertain conditions is where most traders lose, and we don’t want to be part of that crowd.
🎖Strive for consistency, not quick profits. Treat the market as a businessman, not as a gambler. Be patient, Paradisers — only those who follow structured strategies and risk management will thrive in the long run.
MyCryptoParadise
iFeel the success🌴
ZRX Just Broke Out… But Is It a Bull Trap Before a Collapse?Yello Paradisers did you catch that breakout from the falling wedge, or are you about to get faked out like the rest?
💎#ZRX/USDT has finally broken out of its descending resistance after weeks of compression. While this is a promising signal, this move alone is not enough. What really matters now is how price behaves on the retest. We're watching closely for a pullback either into the previous wedge resistance or directly into the key demand zone between $0.205 and $0.215. That area needs to hold if the bulls want to keep momentum on their side.
💎The structure remains valid as long as we stay above the $0.180 level. A break below that zone would completely invalidate this bullish setup and open the door to a deeper drop. On the upside, if buyers step in with volume, the path toward $0.260 and possibly $0.300 becomes much more realistic.
💎This is not the moment to chase. Let retail traders jump in too early our job is to position smartly, not emotionally. Watch the retest, measure the reaction, and act only when the market confirms.
This is where most retail traders get trapped, they chase the move too late or panic-sell too early. Don’t be that trader. Stay focused. Be precise.
MyCryptoParadise
iFeel the success🌴

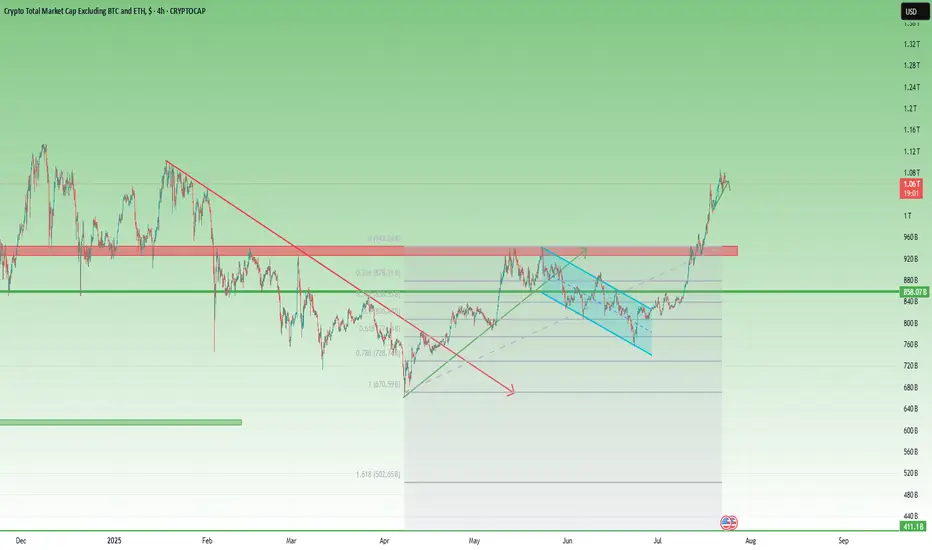
Total3 – Back Above 1T, but Will It Offer a Second Chance?📈 What happened since April?
After the sharp low in early April, Total3 began to recover steadily.
Toward the end of the month, it broke above the falling trendline that had been holding since January — a key technical shift.
This triggered a strong recovery rally, pushing total altcoin capitalization (excluding BTC & ETH) to the 930–940B resistance zone.
📉 Then came the pullback…
Price printed a double top near resistance, followed by a drop — but not a bearish one.
Instead, the correction was orderly, forming a bullish flag, with the low landing right on the 61.8% Fibonacci retracement. Classic healthy structure.
🚀 The latest breakout
Earlier this month, Total3 launched a very impulsive leg up, reclaiming the 1 trillion level with strength.
At the time of writing, we’re trading back above 1T, and momentum remains on the bulls’ side.
However, the chart does look a bit overextended in the short term, suggesting a correction could follow soon.
🧭 Trading Plan – Will We Get a Retest?
The textbook play would be to wait for a deep pullback toward previous support levels.
BUT – I don’t believe we’ll get a full retest of the breakout. Altcoins may stay elevated or correct only modestly.
Instead, I’ll be watching the 1T zone and slightly below — that’s where I’ll look to load up on interesting altcoins.
📌 Conclusion:
Total3 has broken structure, reclaimed key levels, and is showing classic bullish continuation behavior.
The market may not offer you the perfect entry — but small dips near 1T could be all we get before another move higher. 🚀
Be prepared. Don’t wait for perfection in a market because rarely gives it.
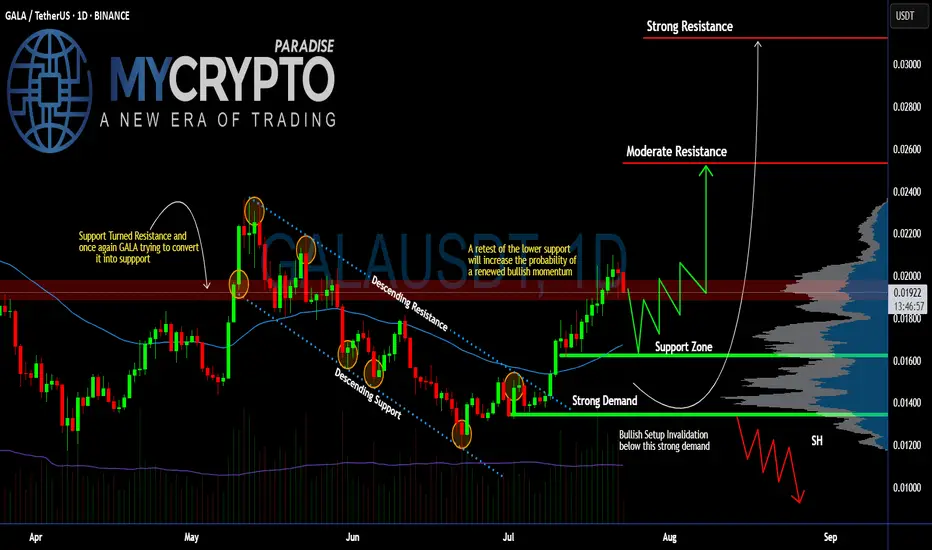
Can #GALA Sustain the Current Bullish Momentum or Will it Fall?Yello, Paradisers! Is this #GALA pullback just a healthy retest before another explosive rally, or are we about to see a deeper drop that will wipe out impatient bulls? Let’s break it down:
💎After weeks of trading inside a descending channel, #GALAUSDT finally broke above the descending resistance, sparking renewed bullish momentum. The breakout has pushed the price toward the $0.020 zone, but now #GALA has encountered a resistance zone (previously support). The question remains: will GALA maintain this level or revisit lower supports before proceeding higher?
💎The current structure shows #GALAUSD attempting to convert its previous resistance into new support around $0.018–$0.020. A clean retest of this support zone would significantly increase the probability of a sustained bullish continuation. The 50EMA acting as support and positive macro trend in crypto market reinforces our bullish bias.
💎If buyers remain in control, the first upside target is the moderate resistance at $0.0253. However, the major profit-taking and strong selling pressure are expected near the $0.0312 zone, where the strongest resistance lies. A successful break and hold above this level would confirm a more aggressive bullish trend.
💎On the flip side, the bullish setup becomes invalid if #GALA loses the strong demand zone at $0.0162–$0.0134. A confirmed close below $0.0134 would flip the structure bearish and open the door for another leg down.
Stay patient, Paradisers. Let the breakout confirm, and only then do we strike with conviction.
MyCryptoParadise
iFeel the success🌴
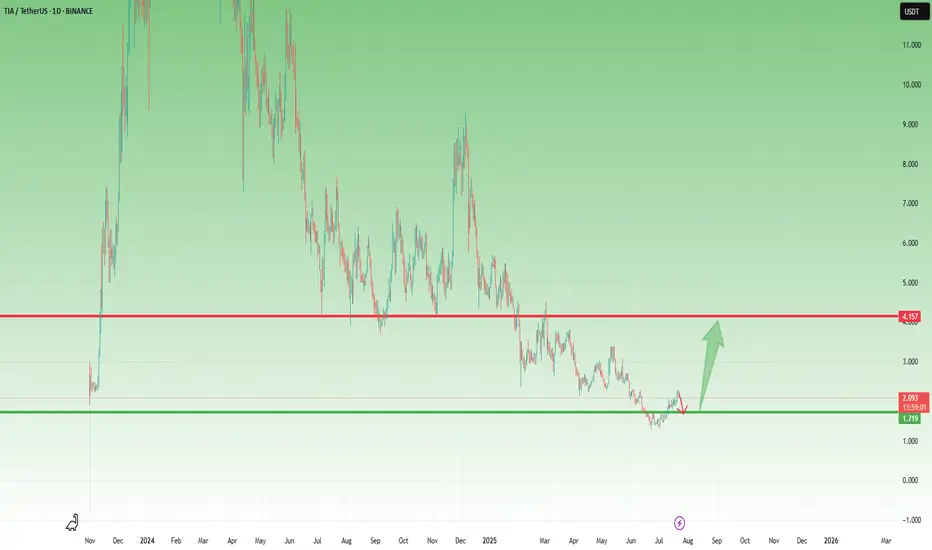
TIA- Is the Coin Finally Ready to Wake Up?After its launch on Binance in November 2023 and the immediate 10x pump, BINANCE:TIAUSDT has been, to put it mildly, a constant disappointment.
Since then, the hype has faded, and the price slowly deflated — leaving holders frustrated and the chart uninspiring.
🔍 Recent Signs of Life
However, something has started to shift.
After a fresh dip to 1.35, the coin formed a small double bottom and managed to recover above the 2.00 zone.
⚠️ Important to note: the rise hasn’t been impulsive.
But in the context of a broader altcoin revival — which I've outlined in my recent dominance analyses — TIA could become a decent candidate for a relief rally.
🔽 What I’m Watching
The recent structure looks like a bearish flag, and there’s a decent chance the pattern breaks down first before any real rally begins.
That’s why I’m watching the 1.70 area closely.
If price dips into that zone and gives a positive reversal signal, I’ll look to buy the dip.
🎯 Target and Potential
My upside target for this move is around 4.00, which would represent over 100% potential from the entry zone.
No moon calls. Just technical setup + potential market rotation + favorable risk/reward.
✅ Conclusion
TIA isn’t a favorite.
But sometimes, unloved charts offer the cleanest reversals.
I’ll let the market speak near 1.70.
If it holds and gives confirmation — I’m in. 🚀
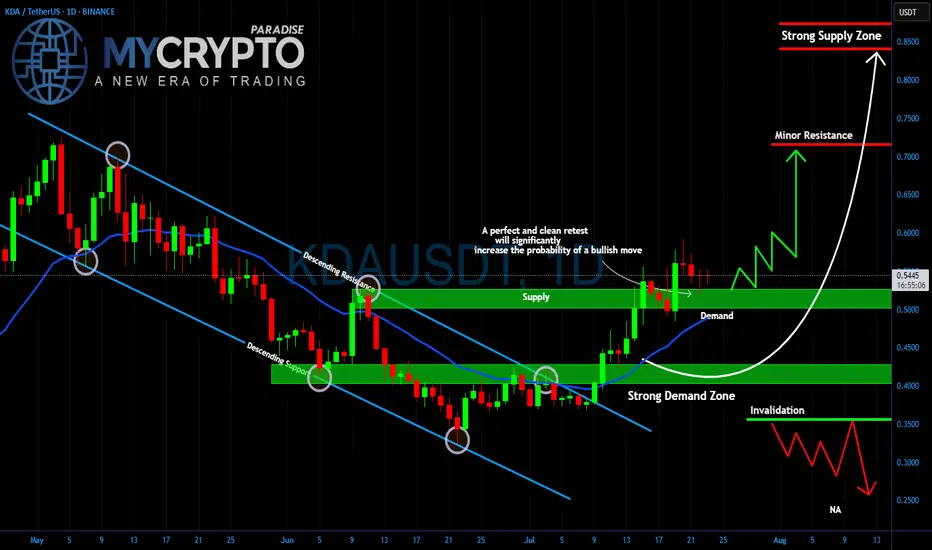
KDA Breakout or Fakeout? Critical Retest AheadYello Paradisers, is #KDA setting up for a major bullish move, or are we looking at another trap designed to wipe out impatient traders? The price has broken out of the descending channel that has been controlling the market for weeks, and now all eyes are on the retest.
💎The strong demand zone around $0.40–0.45 has been the key accumulation area for weeks, holding firmly every time the price dipped. Right now, #KDAUSDT is trading above the $0.50–0.55 demand level, which is acting as a critical support. A clean and confirmed retest of this zone would dramatically increase the probability of a bullish continuation.
💎If buyers step in aggressively, the first target will be the minor resistance at $0.70. Breaking above that could open the way for a push toward the strong supply zone at $0.85, where heavy selling pressure is expected. But if the demand fails and price drops below $0.35, this bullish scenario is invalidated, and a deeper move towards $0.25 becomes likely.
Trade smart, Paradisers. This game rewards patience and discipline, not reckless entries. Stick to your strategy, and you will stay ahead of the herd.
MyCryptoParadise
iFeel the success🌴
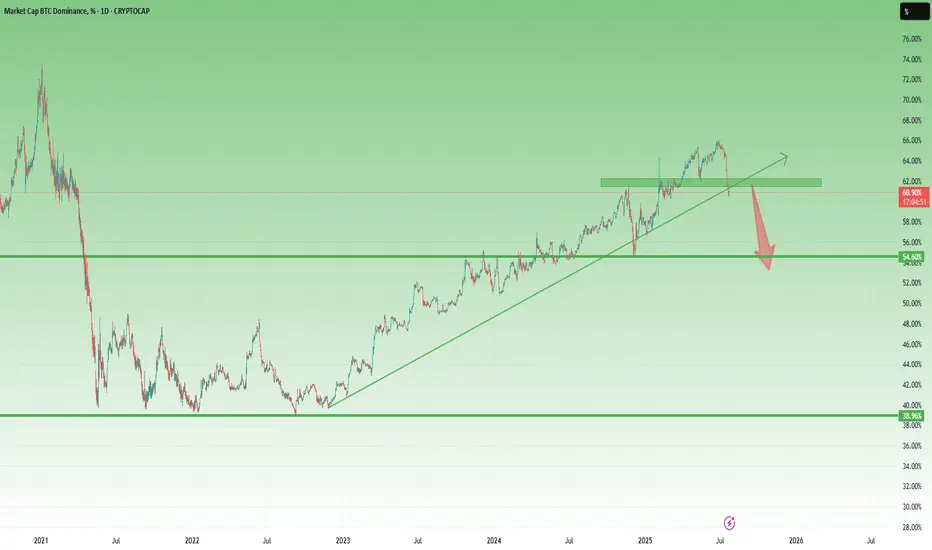
Altcoin Season May Be Real This TimeBitcoin Dominance Finally Breaks – Altcoin Season May Be Real This Time
Since late 2022, Bitcoin Dominance has been on a steady rise — and during this time, the vast majority of altcoins have bled heavily, losing value both in USD and BTC terms.
The long-awaited “altcoin season” became a meme more than a market event.
Every rally was short-lived, and rotation never truly materialized.
Until now...
________________________________________
📉 A Technical Break That Matters
Looking at the BTC.D chart, we finally see something meaningful:
➡️ A clear technical breakdown under confluence support given by the horizontal one and the rising trend line, which held for months and provided the structure for BTC outperformance.
At the same time, Bitcoin is stable around the 120k zone, and the price action suggests strength — not mania, not collapse — just solid consolidation at high levels, and most probably preparing for new ATHs.
This environment historically tends to be favorable for alts.
________________________________________
USDT Dominance (USDT.D) Also Pointing Lower
The USDT.D chart adds even more confluence to the idea:
• It's now pointing towards support
• The structure suggests there’s room for a further drop, which historically means more money flowing into risk assets — particularly altcoins
When stablecoins dominance drops, it usually reflects increased market participation and risk-on behavior — exactly what altcoins need to finally shine.
________________________________________
🔍 What Am I Doing?
I’ve already started buying selected altcoins and I'm looking to add more on dips.
This technical shift is meaningful. It’s not about catching hype, it’s about recognizing a real potential rotation.
In conclusion, I’ll be looking for strong altcoin setups to buy on pullbacks,
as I believe the next weeks and months could offer the kind of upside that can at least double my investment (yeah, yeah, I'm not "to the mooner, hoping for 100x ).
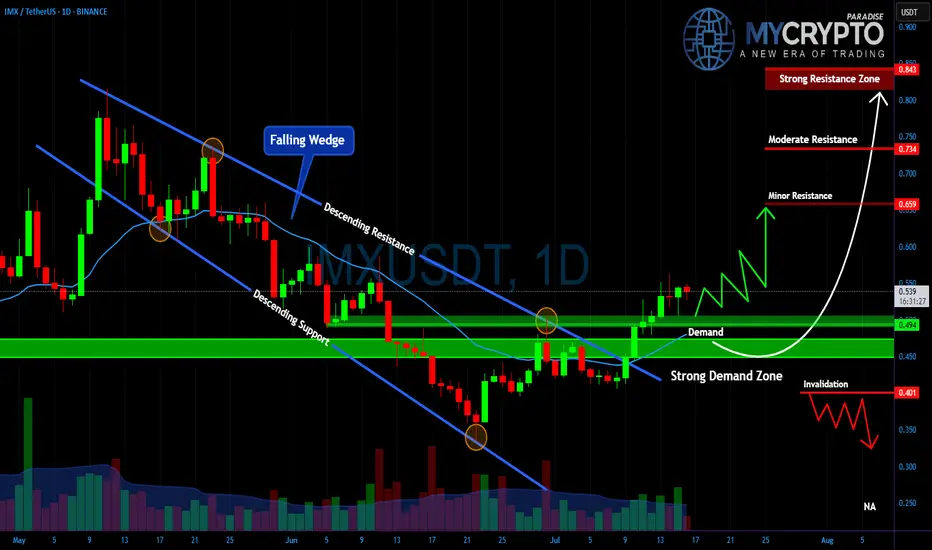
IMXUSDT – Major Breakout or Another Painful Trap Ahead?Yello Paradisers, is this the real start of a powerful bullish reversal on #IMX, or just another classic setup to liquidate impatient traders before the true move begins? The next few days will decide everything.
💎#IMXUSDT has broken out of a falling wedge, which is a typical bullish reversal structure, and is now retesting the strong demand zone between $0.45 and $0.49. As long as the price holds above this level, the bullish scenario remains intact, with $0.659 as the first key resistance to watch.
💎A clean break above $0.659 could open the way toward $0.734, while the critical resistance zone at $0.843 will be the ultimate test of whether IMX can shift into a sustained uptrend.
💎However, the invalidation level sits at $0.401. If this level fails, expect a fast move back toward $0.30, which will likely wipe out many traders who jumped in too early.
This is exactly where most retail traders get trapped. They either chase the move too late or panic-sell too early.
MyCryptoParadise
iFeel the success🌴
PEPE WILL WE GO TO .000035 ? Evening
so if we can break this orange level here ie this top in price action then a nice run up to .000035 makes send.
stay tuned this is wild one
what do you think Pepe will do ?
Kris/ Mindbloome Exchange
