BTCUSD Analysis Next MovePair Name = BTCUSD
Timeframe = W1
Analysis = technical + fundamentals
Trend = Bullish
Pattern = Bullish Flag
Details :-
BTC is future. So no one can deny this. Now BTC is bullish at 100k this is ready to stay here for few more days. This is because here it can make bullish flag pattern. After breakout price will hit 130k to 150k. Be ready For big moves
Bullish Targets :-
130k
150k
Cryptosignals

LPTUSDT: Critical Levels to Watch – Will Bulls Defend the Line?Yello, Paradisers! Are you prepared for the critical moves ahead on #LPTUSDT? This setup is heating up, and the next few days could define the trend’s future. Let’s dive in.
💎#LPT is eyeing a retest of the $17.7 - $16.4 support zone. If this area holds, we could see buyers stepping in to fuel a bullish continuation, potentially targeting the major resistance zone. This would align with the broader bullish trend we’ve been tracking.
💎But here’s where it gets tricky. Things could turn ugly if LPT fails to rebound at this support and breaks below it. The price could spiral down toward the $13.7 - $12.5 demand zone. From here, bulls must make a stand and reclaim the lost support to keep the bullish scenario alive.
💎If the daily candle closes below the demand zone, it will confirm a bearish breakdown, with the potential for an even deeper dip.
Stay focused and wait for clear signals before making your move. This is how you ensure long-term profitability.
MyCryptoParadise
iFeel the success🌴

BTCUSDT Up trend continuationBTC/USDT experienced a sharp decline before stabilizing. Prior to this movement, the price formed a triangle pattern. Currently, the price is pulling back to retest the midpoint of the pattern, which often acts as a support and resistance zone. On the daily timeframe, the market dipped below the previous daily low, indicating a potential upward movement. If the market successfully rejects the support level and the downward trendline, a price increase could potentially test the upper boundary of the channel. The target is the resistance zone around 105,000

#FETUSDT Analysis: Is a Big Move Brewing? Yello ,#FETUSDT has shown remarkable bullish momentum recently, breaking through key resistance levels and forming a clear upward trajectory. However, after reaching a high near $2.199, the price is retracing, signaling a potential opportunity to reevaluate key levels for the next move.
💎The price is currently approaching the critical support zone around $1.699–$1.744. This area coincides with the 100 EMA on the 4-hour chart, which adds confluence to its significance. If bulls successfully defend this zone, we could see a continuation of the upward move, with potential targets at $2.199and beyond. A breakout above this level would likely accelerate bullish momentum, pushing the price toward the psychological resistance of $2.697.
💎On the downside, the demand zone near $1.522-1.550 is the next key area to monitor if the current support fails. This zone has historically provided strong buying interest, and a bounce from here would offer another chance for bulls to regain control. However, if the price closes a daily candle below $1.550, it would invalidate the bullish structure and open the door for further downside, potentially toward $1.30 or lower.
💎Currently, the market is at a decisive point. Bulls must step in and hold above support to maintain the momentum, while bears are eyeing a deeper retracement to key demand levels.
Paradisers, remember that trading is a game of probabilities, not certainties. Stay disciplined, plan your entries carefully, and always manage your risk. The next move in #FETUSDT could be a game-changer for those who stay prepared and patient!
MyCryptoParadise
iFeel the success🌴

#TLMUSDT Analysis: Are Bulls Ready to Take Control?Yello, Paradisers! Could #TLMUSDT be gearing up for a breakout, or will it fail to hold critical support levels? Let’s dive into the key areas of #AlienWorlds:
💎#TLM has been trading within a descending channel formation throughout most of 2024, consistently creating lower highs and lower lows. However, recent price action is showing signs of potential bullish momentum. The price has broken above the descending resistance of the channel and is now retesting critical levels that could determine its next significant move.
💎The demand zone between $0.01017 and $0.01523 remains a crucial area to watch. This region has consistently acted as a strong support, and as long as the price holds above this zone, the bullish narrative remains intact.
💎A strong rejection from this area could propel the price higher, potentially targeting the major resistance zone at $0.02400–$0.02800. This resistance is a key hurdle for bulls, and a confirmed breakout above $0.02800, supported by strong volume, could ignite a rally toward $0.04000 and beyond.
💎On the other hand, caution is warranted. A daily candle close below $0.01017 would invalidate the bullish structure and likely trigger a deeper correction. In such a scenario, the price could revisit lower levels around $0.00720 or even lower, signaling further downside risks and shaking out weaker market participants.
Stay focused, patient, and disciplined, Paradisers🥂
MyCryptoParadise
iFeel the success🌴

Kaia | Turning 1 Second Blocks Into a Billion Dollar BusinessHow Kaia Makes Ethereum Look Like It’s Running Dial Up Internet !
Kaia is a public blockchain built to deliver enterprise grade reliability and high performance, with a vision to become Asia's premier blockchain platform. It supports fast transaction finality with 1 second block times and can handle up to 4,000 transactions per second, making it ideal for large-scale applications. Kaia also ensures a seamless development process through Ethereum Virtual Machine compatibility, allowing developers to migrate Ethereum-based dApps effortlessly.
Where Slow Developers Pay Extra for Their Lazy Code
Encouraging High Quality Applications
As a scarce resource, KAIA encourages developers to write efficient code. Inefficient applications incur higher transaction fees, motivating developers to optimize for cost-effectiveness.
Consensus Nodes
The network's health relies on Consensus Nodes, which validate transactions and maintain the blockchain.CNs are compensated in KAIA tokens, incentivizing consistent and reliable operation
KAIA as a Utility Token
KAIA, the blockchain's native cryptocurrency, is used to pay transaction fees for smart contract execution, asset transfers, and other network activities. These fees sustain network operations and promote efficiency.
Kaia Price & data
Current Price:$0.23 (+20% in the past 24 hours)
AllTime High:$0.243 (reached on December 1, 2024), currently 0.48% below ATH
Circulating Supply:5.86 billion coins
Maximum Supply:5.86 billion coins
24Hour Trading Volume: $74.73 million
Market Capitalization: $1.42 billion, representing 0.04% of the cryptocurrency market.
Kaia is actively traded on 24 markets and 27 exchanges, with Binance being the most active platform
lets talk about the chart, as you see whales hold the uptrend and there is a chance for pullback as well. meme szn is over now and its time to new projects to show who is run this alt szn
If you're new to the exciting world of crypto, here's a golden nugget of advice:
invest in your knowledge before investing your money. The crypto bull market might look like a get rich quick train, but without understanding the basics, you could end up with a one way ticket to confusion or worse, losses.
Once you've sharpened your skills, you’ll be ready to ride the bull market like a pro, turning your insights into profits and your dreams into reality. Knowledge first, then let the money-making adventure begin

Cetus Protocol | CZ, Cetus & BinanceWhen the Protocol Is More Stable than Your Love Life!
Cetus is a decentralized exchange aka DEX and concentrated liquidity protocol developed on the Sui and Aptos blockchains. Its mission is to establish a robust and adaptable liquidity network that simplifies trading for users and assets. Cetus aims to deliver an optimal trading experience and enhanced liquidity efficiency to DeFi users by building a concentrated liquidity protocol alongside various interoperable functional modules
Cetus Protocol pumped 60% after Binance Partnership News!
Also the trading volume jumped 900%, now you see why CZ end up in jail
The price of Cetus is $0.42, reflecting an 11% decline over the past 24 hours. The ATH of $0.49 was achieved on November 10, 2024, putting the current price down by 12% from its peak
Cetus Protocol has a circulating supply of 588.30 million tokens out of a maximum of 1 billion. Over the last 24 hours, its trading volume has reached $172.43 million. CETUS’s lowest recorded price was $0.026 on June 12, 2023, making the current price approximately 1,500% higher than its all-time low.
Cetus Protocol is traded on 21 markets across 25 exchanges, with Binance being the most active. It holds a 0.01% share of the cryptocurrency market, with a market capitalization of $ 251 million

Arkham | ARKM’s Bat Signal was Lit!The Dark Knight of Blockchain Sleuthing
Arkm is 400% up since our first signal and 100% up since got listed on OKX so lets double check it
Arkham isn’t just a blockchain analysis platform it’s like Sherlock Holmes with a PhD in AI, out here doxxing wallets and decoding on chain secrets. Its main weapons of choice? The Analytics Platform, which spies on exchanges, funds, whales, and your favorite meme coins, and the Intel Exchange, where blockchain gossip is bought and sold like trading Pokémon cards
From Whale Watching to Wallet Doxxing
Instead of sticking to one blockchain, Arkham’s AI system, ULTRA, plays detective across the entire crypto universe, connecting dots that most wouldn’t even know existed. You get the tea on everything from shady transactions to whale movements, all while sitting in your pajamas.
Oh, and the Intel Exchange? It’s like Craigslist for blockchain nerds. People bid, bounty, and barter for address labels and insider scoops, all using ARKM tokens. It’s a hustler’s paradise for anyone with the intel to monetize kind of like being a blockchain bounty hunter.
The mastermind behind all this is Miguel Morel, a crypto veteran who knows his way around both markets and investors. Speaking of investors, Arkham has a lineup that could make a startup founder weep with envy, including an OpenAI cofounder (ooo, mysterious), Palantir’s Joe Lonsdale, and crypto big shots like Tim Draper. Together, they’ve poured over $10 million into Arkham, valuing it at a cool $150 million.
Where do you snag some ARKM tokens? Binance is the hotspot, with ARKM/USDT volumes hitting millions daily. Just don’t expect all-time highs anytime soon—ARKM is currently chilling at 39.82% below its peak. Still, it’s sitting pretty at 731.40% above its all-time low.
With a market cap nearing $752M and a fully diluted valuation of $2.38B, Arkham might just be the blockchain snoop the world didn’t know it needed. but Wen lambo(I mean Batmobile)?
ARKM gets ready for 2.5, 2.7 and 2.9$ and if BTC do correction we will back to 1.9$ support

Arkham | ARKM The price of Arkham is $0.67 today with a 24hour trading volume of 210 million dollar
Arkham is a blockchain analysis platform that uses artificial intelligence to deanonymize the blockchain and on-chain data.
The platform’s two main components are the Analytics Platform and Intel Exchange. The Analytics Platform covers analytics on various entities, exchanges, funds, whales and tokens. For instance, you can check the portfolio holdings, transaction history, exchange flows, network relationships and other on-chain analytics. The Intel Exchange allows anyone to buy and sell address labels and other intelligence, either through bounties, auctions or the DATA Program.
Arkham uses an in-house AI engine with various sources of data, such as public records, social media, web scraping and user submissions. The data is used to label addresses and provide entity analytics for ULTRA, the company’s AI algorithm.
Arkham’s platform can be used for various purposes, such as tracking stolen funds, identifying fraudsters, verifying counterparties, auditing transactions, investigating hacks, and more. Arkham claims that its platform can help combat the proliferation of crypto crimes and scams by incentivizing on-chain research.
However, Arkham’s platform has also raised privacy concerns among some crypto users and advocates, who argue that deanonymizing the blockchain violates the principles of anonymity and censorship-resistance that underpin the crypto movement. Arkham has defended its platform by saying that it does not collect or store any personal data from users, and that it only provides publicly available information that can be verified on the blockchain.
Arkham Intelligence was founded by Miguel Morel in 2020. Miguel is a veteran entrepreneur in cryptocurrency markets. Miguel’s experience navigating new crypto markets makes him familiar with the intelligence needs of decision makers in government, venture capital, and trading. He is also an investor in a number of technology startups.
Arkham Intelligence has also attracted some of the most prominent investors in the crypto space and beyond. Among them are an undisclosed OpenAI Co-Founder, Palantir Co-Founder Joe Lonsdale (8VC), Tim Draper (Draper Associates), Wintermute, GSR, and Geoff Lewis (Bedrock). The company raised over $10 million in two rounds of equity financing, and was valued at $150 million in its last round.
About 90% of the ARKM airdrops have been claimed. About 36.1% are new addresses; about 25.69% are Arbitrum airdrop addresses, and 21% are Ampleforth Forth airdrop addresses. 93.5% of the addresses sold after receiving, and only 0.1% of the addresses increased their holdings

Token name from you, Analysis with meHi everyone, I hope you have a great weekend .
Please write the Project name and Token symbol in the comment section, and I will then share the token analysis with you.
Please pay attention to the conditions.
For example, write Bitcoin(BTC) in the comment.
Project name: Bitcoin
Token symbol: BTC
A maximum of 20 tokens will be analyzed for you .
For each follower, please register only 1 analysis request in the comment section.
Your token analysis will be shared below your comment .
If you found this helpful, please Hit the ✅ Like Button ✅ (It fuels my energy) 💪 and Share it with your friends! Let’s grow together! 🙏😊
Wishing you health, wealth, and success! 🚀💸

Bitcoin is going to the Moon PART 2! [S #3 B]How nice, hit all 3 targets from the original post in not even 2 days...
NOW FOR PART TWO!
I have added a few more targets, TP4, TP5, and TP6.
We are currently going up high in altitude and going to be reaching our planet's atmosphere very soon! We should the reach the moon in no time!
Bitcoin may dip a bit from the current price but should still make a new ATH.
I will be going a bit into what I call my "special indicator" that successfully helped me make the last few recent signals.
I call it "MarketAnalyzer FX Alpha 1" and it honestly has been doing a splendid job.
It is pointing upwards for Bitcoin, hopefully it won't take too long to hit our next target.
Entry:
***USE LOW LEVERAGE IF ANY AT ALL***
$79,200-$80,000 (Original posts entry)
If you have not entered yet, new entry could be $86,000-$89,000
TP1: $82,742 ✅
TP2: $85,132 ✅
TP3: $82,742 ✅
TP4: $90,800
TP5: $98,200
TP6: $110,000
For those that have the good entry of $79k-$80k I would move SL to entry.
If entering the current entry point, $85,000.
----------------------------------------------------------------------------------------------
***ALL ANALYSIS, SIGNALS, AND ANY CONTENT IS FOR EDUCATIONAL PURPOSES
ONLY AND ARE NOT MEANT TO BE PROFITED OFF.***
----------------------------------------------------------------------------------------------

Reserve Rights | RSR , Rewards & RocketsRSR Climbs the Crypto Charts While Dreaming of 2021’s Glory Days
What is Reserve Rights?
The Reserve Rights Token aka RSR is an integral part of the Reserve Protocol ecosystem, launched in 2019 to promote cryptocurrency adoption. This protocol provides tools enabling users to create and utilize stablecoins globally. The ecosystem includes the Reserve Protocol, the Reserve app, and the RSV stablecoin. Its unique dual-token mechanism aims to mitigate cryptocurrency market volatility.
RSR is an ERC20 token with a maximum supply of 100 billion.
It functions as both a utility token and a governance token for the Reserve Rights platform.
Key Features of Reserve Rights and How It Works
The core of the Reserve Protocol ecosystem is the RSV stablecoin, which is supported by fiat-backed cryptocurrencies like USDC, TUSD, and USDP. These stablecoins are managed through smart contracts called the Reserve Vault, ensuring that each stablecoin created on the platform is fully backed by a diverse mix of assets.
RSR serves as a safety net for the platform. If any RTokens (stablecoins created on the platform) default or their collateral loses value, RSR is used to recapitalize the market. RTokens are fully collateralized and can be redeemed 1:1 for their underlying assets. The supply of RSR is inversely correlated with the supply of RSV, maintaining stability and reliability.
Noteworthy Aspects of Reserve Rights
The Reserve ecosystem also features the RPay App, a crypto wallet that allows users to store, send, deposit, and withdraw assets in their preferred currency—whether fiat or crypto.
Where to Buy RSR?
RSR is available for trading on multiple centralized exchanges (CEX) and decentralized exchanges (DEXs). Popular platforms include Binance, OKX, Gate.io, and KuCoin. Prices may vary based on the exchange and market conditions
RSR, the King of Comebacks (Kind Of!)
The current price of Reserve Rights is $0.017, reflecting an 85% increase over the past 24 hours. The token reached its all-time high of $0.119 on April 16, 2021, and is now 85.6% below that peak. With a circulating supply of 53.29 billion tokens and a maximum supply of 100 billion, RSR has a 24-hour trading volume of $276 million. It is traded on 38 markets and 39 exchanges, with Binance being the most active platform. RSR's market capitalization stands at $913 million, representing 0.02% of the total cryptocurrency market.
But what the pump is this?
The recent pump in the RSR token can be attributed to several factors
1. Mainnet Launch Anticipation: The Reserve Protocol's upcoming mainnet launch is a significant milestone. This launch will enable the creation of fully collateralized stablecoins (RTokens) and introduce staking capabilities. These features are expected to drive adoption and utility, increasing investor interest.
2.Staking Rewards: The introduction of staking will allow RSR holders to earn rewards by insuring RTokens against collateral defaults. This practical use of staking within the ecosystem adds a layer of financial incentive, making the token more attractive to both new and existing investors.
3.Stable Performance During Volatility: The Reserve Protocol's stablecoin, RSV, has maintained its peg even during market volatility, showcasing its resilience. This stability has strengthened investor confidence in the broader Reserve ecosystem.
4. Partnerships and Tokenization Trends: Speculation around RSR's involvement in blockchain tokenization initiatives, potentially in collaboration with major players like Coinbase and BlackRock, has further boosted market sentiment. These developments highlight RSR's potential role in the emerging tokenized assets sector.
next targets are 0.019 and 0.025$
Learn before you earn
The crypto bull market might seem like a quick path to wealth, but without understanding the basics, it can lead to confusion or losses. Build your knowledge first to turn insights into profits and achieve your goals

#DOGSUSDT at a Crossroads: What Will Happen Next?Yello, Paradisers! Could #DOGSUSDT be gearing up for a breakout, or will it fail to hold critical support levels? Let’s dive into the key areas of #DOGS:
💎#DOGSUSD recently broke above its descending resistance trendline, which has now flipped into support. This is a positive signal for the bulls, but the price still needs to decisively break above the $0.0008269 resistance level to confirm a sustained uptrend. Until then, the market remains at a pivotal moment.
💎A confirmed breakout above $0.0008269 could ignite strong bullish momentum, opening the door to a rally toward $0.0011000–$0.0013000, the next major resistance zone. This region represents a significant hurdle for #DOGSUSD, but clearing it would likely attract fresh buyers and push the price toward higher levels.
💎On the downside, immediate support lies at $0.0007178, followed by the critical demand zone between $0.0005880 and $0.0005300. As long as the price remains above this zone, the bullish case remains intact. A pullback into this area could provide bulls with another opportunity to regain momentum.
💎However, if #DOGS closes a candle below $0.0005300, this would invalidate the bullish structure and signal a potential drop toward $0.0004400 or lower. Such a move could pave the way for a deeper retracement and shake out weak hands before any recovery attempts.
Stay focused, patient, and disciplined, Paradisers🥂
MyCryptoParadise
iFeel the success🌴

Will #ID Explode or Collapse? Watch These Critical Levels Yello, Paradisers! Are we standing on the edge of a major breakout or will #IDUSDT plunge into a deeper retracement? Let’s break down the latest analysis of #SpaceID:
💎#ID has been trading within a broadening wedge pattern for months, with descending resistance and support lines shaping the structure. Recently, the price broke out above the wedge’s descending resistance—a critical technical milestone. However, for any meaningful upside, the price must conquer the $0.7495 resistance level, which currently stands as the major hurdle.
💎A clean breakout above $0.7495, confirmed with a daily close, could unleash a significant bullish rally. The next targets on this trajectory would be around $1.00 and potentially higher toward the $1.30–$1.60 major resistance zone. These levels would likely draw in fresh buying momentum, propelling the price further upward.
💎On the flip side, the $0.6710 level serves as immediate support. Below that, there is a strong demand zone at $0.5218–$0.3955, which has acted as a springboard for bullish recoveries in the past. As long as the price remains above this demand zone, the bullish case remains intact. A dip into this zone could provide an ideal opportunity for bulls to regain control.
💎However, if #IDUSD closes a candle below $0.3955, this would invalidate the bullish structure. Such a move could signal further downside, with the price targeting lows around $0.2850 or even lower. This scenario would shake out inexperienced traders and open opportunities for short sellers.
Stay focused, patient, and disciplined, Paradisers🥂
MyCryptoParadise
iFeel the success🌴

ZKUSDT Ready for a Breakout or About to Fail?Yello, Paradisers! ZKUSDT has formed a classic cup-and-handle pattern, and it looks like it’s about to challenge the key resistance trendline. But is this the moment we’ve been waiting for?
💎If ZKUSDT successfully breaks through both the resistance trendline and the resistance zone, it will validate the cup-and-handle pattern, significantly increasing the odds of a strong bullish move.
💎However, if we see a pullback, we can anticipate a bounce from the support zone—but to truly tip the scales in our favor, we’ll need to see an I-CHoCH (Internal Change of Character) on lower timeframes.
💎On the flip side, if ZKUSDT breaks down and closes candle below the support zone, it will invalidate our entire bullish thesis. In that scenario, it’s wiser to stay patient and wait for clearer price action to form before jumping back in.
🎖As always, discipline and patience are your best tools in these situations. If you're serious about consistent profits, waiting for high-probability setups is key. Trade smart, Paradisers! Stay focused and keep mastering your strategy to be in the winner's circle.
MyCryptoParadise
iFeel the success🌴

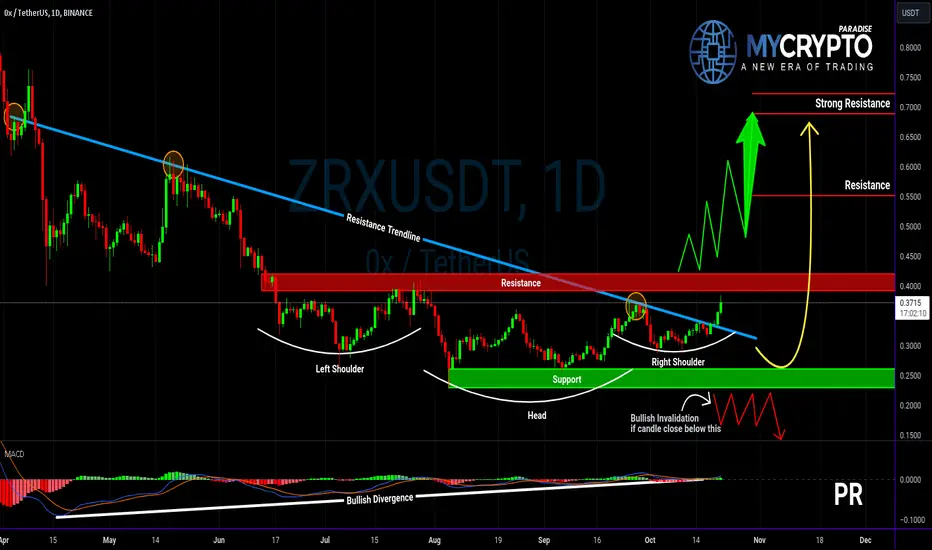
Will ZRXUSDT Ignite a Bullish Reversal? Yello, Paradisers! Have you noticed the key breakout on ZRXUSDT? 🚨 The pair has just broken out of a major resistance trendline and formed an Inverse Head and Shoulders pattern, all while showing a bullish divergence. Are we about to witness a strong reversal, or will this be a fake-out?
💎If ZRXUSDT manages to break and closes candle above the resistance zone, it will confirm the Inverse Head and Shoulders pattern, significantly increasing the probability of a bullish reversal. The bullish divergence adds even more weight to this potential move.
💎In the event of a pullback, a bounce from the support zone is expected. To increase the odds in our favor, we’ll be looking for a bullish I-CHoCH (Internal Change of Character).
💎However, if the price breaks down and closes below the support zone, the entire bullish setup will be invalidated. In that case, the best approach would be to wait for a clearer price action before taking any new positions.
🎖 As always, patience is key, Paradisers! Stick to the strategy, wait for confirmation, and avoid impulsive decisions. Successful trading is all about timing and discipline—don’t rush it!
MyCryptoParadise
iFeel the success🌴
IDUSDT: Bullish Breakout or Panic-Inducing Breakdown?Yello, Paradisers! Are you ready for a major move on IDUSDT? If you’ve been keeping an eye on this one, you might be in for a game-changer!
💎IDUSDT is approaching the resistance trendline, forming a classic Cup & Handle pattern—and we’ve got a bullish divergence in play.
💎If IDUSDT breaks and closes a candle above the resistance zone, it will confirm the Cup & Handle pattern, significantly increasing the odds of a bullish reversal. This could be your signal to ride the wave up!
💎Now, if we get a pullback, don’t panic. We’re eyeing a bounce off the support zone. But for a safer bet and higher probability in our favor, we need to see a bullish I-CHoCH in lower timeframes for confirmation.
💎On the flip side, if the price breaks down and closes candle below the support zone, that’s a red flag. It will invalidate our bullish scenario altogether.
Be patient, wait for the right confirmation, and avoid emotional decisions. Smart trading is about following the strategy and never rushing the market. Stay sharp and disciplined, Paradisers! 💪
MyCryptoParadise
iFeel the success🌴

Is THETAUSDT on the Verge of a strong bullish move?Yello, Paradisers! Are you ready to catch a potential surge in THETAUSDT? We’ve got our eyes on this one, and it’s time you should too!
💎 #THETAUSDT has successfully broken out of a descending channel. Now, we’re expecting a retest of the descending resistance. If the price completes this retest phase, it could pave the way for a bullish move from the demand zone around $1.231.
💎But what if momentum stalls and the price of #thetausd drops below this demand zone? Don’t worry; we’ve planned for that too. In such a case, we’re looking at a potential bullish rebound from the lower support zone at $0.902. This support is crucial due to its historical price action, and if the pattern holds, we anticipate a strong bullish move toward the next significant resistance level.
💎 However, if the price breaks below this support, it would invalidate the bullish setup and could lead to a significant drop.
As always, employ prudent trading strategies and ensure you have proper stop-loss measures in place. Stay vigilant to market movements, and we’ll keep you updated with more insights.
MyCryptoParadise
iFeel the success🌴

Is #CRVUSDT About to Explode? Here’s Why You Can’t Afford to MisYello, Paradisers! Are you prepared for what could be a massive game-changer in the market? Let’s dive into our latest analysis of #CRVUSDT and see what’s brewing!
💎#CRVUSDT is hovering around a critical support zone at $0.2944, showing strong potential for a bullish continuation We’ve been closely monitoring #CURVE as it follows a falling wedge pattern, and after a perfect breakout, it has successfully completed a retest of the descending resistance signals that the bulls might be gearing up for action. The next key level to watch? The internal minor resistance at $0.5249.
💎If #CRV can hold its ground at this level, we could witness a significant bullish rally, echoing previous major market moves. A decisive breakout above the crucial $0.5249 resistance could set the stage for a surge toward even higher resistance zones.
💎But remember, caution is key. If momentum fades at this critical juncture, a pullback to the lower demand area around $0.2431 is on the table. A daily close below this level could invalidate the bullish outlook and lead to further declines.
💎Stay sharp and keep a close eye on the price action. The next move could define the trajectory of #CRVUSDT in the coming days.
Stay focused, patient, and disciplined Paradisers.
MyCryptoParadise
iFeel the success🌴

Fantom (FTM) Poised for a Massive Breakout or a Major Drop? Yello Paradisers! Are you ready for the next big move in Fantom ? It looks like FTMUSDT is preparing for a massive bullish run that could be just around the corner!
💎Right now, Fantom is forming an inverted head and shoulders pattern—a strong bullish signal. It's currently testing the neckline, and a breakout above this level, confirmed by a surge in trading volume, would give us the green light to plan our entry for a buying opportunity.
💎For this bullish scenario to materialize, FTM needs to break above the critical resistance level at $0.5300. A successful move past this resistance could trigger a significant rally, targeting the next resistance zone around $0.7717.
💎However, caution is crucial here! If the upward momentum falters, we might see a retreat to the lower support area near $0.3664. A daily close below this support would invalidate the bullish outlook and could signal further declines.
Stay focused and disciplined, Paradisers! Remember, only the patient and strategic will reap the rewards in this market.
MyCryptoParadise
iFeel the success🌴

BAT About to Break Out or Break Down? Critical Levels You Can't Yello, Paradisers! Could #BAT Be Ready to Explode? Here’s Why You Need to Watch Closely!
💎#BATUSDT is currently sitting at a critical demand zone of $0.1690, and it’s showing signs of a potential bullish continuation. We’ve been tracking #BAT closely as it navigates a descending channel, and it’s now on the brink of a breakout. If the price maintains this upward momentum, a powerful bullish surge could be on the horizon.
💎For this bullish scenario to play out, #BAT needs to break above the internal resistance level at $0.2070. A successful break here could ignite a significant rally, with the initial target set at the minor resistance zone of $0.2715.
💎 However, stay alert! If momentum fades at the demand zone, a rebound could occur from the lower support area around $0.1482. A daily close below this support would invalidate our bullish outlook and potentially lead to further declines.
💎Stay sharp, Paradisers! Keep a close eye on #BAT's price action because the next move could be a true game-changer. Remember, patience and discipline are key to capitalizing on these market opportunities!
Trade smart and stay focused – the best opportunities are often just around the corner!
MyCryptoParadise
iFeel the success🌴

Is #TRXUSDT About to Skyrocket? Don’t Miss This Critical Move!Yello, Paradisers! Is #TRXUSDT About to Explode? Here’s Why You Must Pay Attention!
💎#TRXUSDT is setting up for a potential bullish continuation from the key demand zone at $0.1460. If the price manages to hold within this zone, there’s a high probability of a strong bullish move to test the resistance above.
💎We’ve been tracking #TRON closely, especially after it broke above a previous major resistance. Now, with the price hovering near a descending resistance, the chances of a bullish breakout are increasing. The current trend is clearly upward, and market sentiment is on the bullish side.
💎For this bullish scenario to materialize, #TRXUSDT must break above the descending resistance. A successful break could trigger a significant rally, with the first target aimed at the key resistance zone around $0.1913.
💎However, be cautious! If momentum weakens at the demand zone, we could see a bounce from the lower support area near $0.1392. A daily close below this level would invalidate the bullish outlook, opening the door to further declines.
💎Stay sharp, Paradisers! The next move in #TRX could be a real game-changer. Patience and discipline are key to seizing these opportunities.
Trade smart and stay focused—the best setups are often just around the corner!
MyCryptoParadise
iFeel the success🌴

#ROSEUSDT: Breakout Imminent or Bullish Momentum Fading?Yello, Paradisers! Are we on the brink of a massive breakout on #ROSEUSDT, or will the bulls lose their steam? Let’s break down the analysis and find out.
💎#ROSEUSDT is showing encouraging signs of a bullish continuation from the key support level at $0.06727. If the price manages to stay steady at this level, we could be looking at a breakout above the descending resistance of the ongoing channel. Momentum is the driving force here if it sustains, a significant price move could be just around the corner.
💎However, we aren’t in full breakout mode just yet. For a confirmed move, we need a decisive break above the internal resistance at $0.08367, supported by strong engulfing candles and consistent momentum. Until that happens, it’s wise to stay cautious and avoid entering positions too soon.
💎But what if the bulls lose their momentum? If #ROSEUSDT fails to break above $0.08367 and starts to show signs of weakening, sellers may step in. The critical support to watch is $0.04892, a level that has proven resilient in the past. A bounce from here would keep the bullish outlook alive, but a break below $0.04892 would invalidate the bullish setup and could lead to a sharp decline.
💎The next move will be pivotal, Paradisers. Whether we see a breakout or face a reversal, sticking to a strategic approach and disciplined risk management will keep us ahead of the game. Patience and a well-executed plan will separate the winners from the rest.
Trade smart, Paradisers. Consistency and discipline are key focus on the bigger picture and let the market come to you. Stay sharp, and let's see how this unfolds!
MyCryptoParadise
iFeel the success🌴
