Will #ENJ Soar Further or a Trap is Set Ahead? Watch Closely Yello, Paradisers! Is this breakout on #ENJUSDT the start of a strong bullish reversal, or just another trap before a brutal flush to shake out late buyers? Let’s break it down:
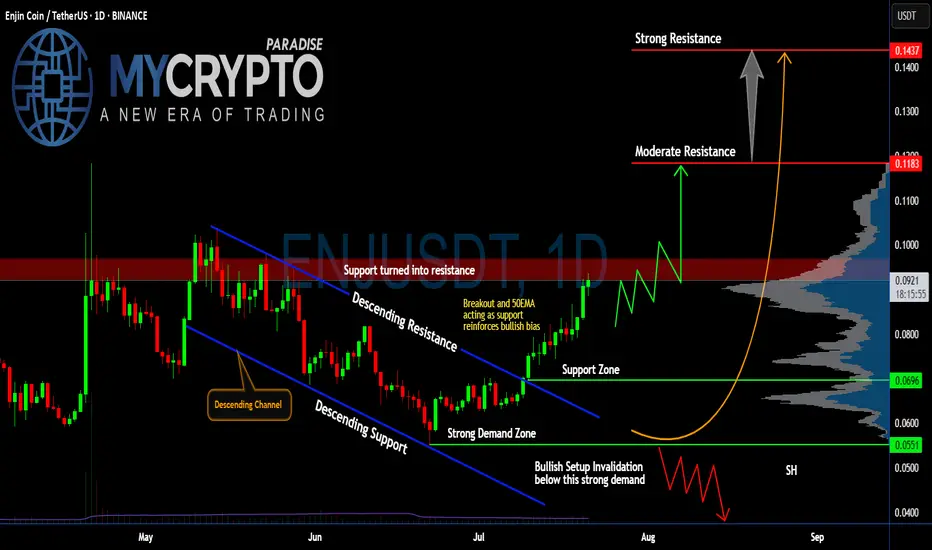
💎After weeks of bleeding inside a clear descending channel, #EnjinCoin has finally broken out of the descending resistance, showing the first real bullish momentum in a while. Price is currently trading around $0.0917, with the 50EMA now acting as fresh support—this adds weight to the bullish bias for #ENJ.
💎If bulls can break above the resistance zone (previously support) between $0.091 and $0.096, we could see a push toward the moderate resistance at $0.1183. That’s the first major hurdle where sellers are expected to step in. A clean breakout above this level would open the door for a larger move toward the strong resistance at $0.1437, where a heavy supply zone sits, and profit-taking will likely accelerate.
💎The strong demand zone between $0.0551 and $0.0696 has been respected multiple times in the past, with aggressive buying every time price dipped into it. This is classic accumulation behavior, which often precedes stronger impulsive legs up—if volume keeps supporting this move.
💎But don’t get trapped, Paradisers. If the price breaks back below $0.0696 and especially loses the strong demand at $0.0551, the bullish setup for #ENJUSD will be invalidated. That would likely trigger a deeper correction, pushing us back toward $0.04. We’ll wait patiently for the next high-probability setup before taking any new positions.
Stay patient, Paradisers. Let the breakout confirm, and only then do we strike with conviction.
MyCryptoParadise
iFeel the success🌴
Cryptosignals
SUPER Breakout Incoming or Just Another Trap Before the Flush?Yello, Paradisers is SUPER about to explode out of this structure, or are we being lured into a fakeout before the next rug pull? This setup is too clean to ignore, and the next few candles will tell us everything.
💎The daily chart on #SUPERUSDT reveals a well-respected descending channel that has dictated price action for over two months. After multiple rejections from the upper boundary and rebounds off the lower trendline, the price has now shown its first serious signs of momentum since bottoming in the strong demand zone around $0.45–$0.50. This zone has held firmly, marking the third time price has bounced from this key level a textbook area of interest where buyers consistently step in.
💎What's notable here is the confluence between the demand zone and the descending support line. The most recent bounce was not only from this dual-support area, but also accompanied by a shift in momentum that has pushed the price back toward a critical inflection point the resistance-turned-support zone at $0.58–$0.62. This level has acted as resistance before and now becomes the level to reclaim for the bullish scenario to stay valid.
💎If the price breaks and closes above the upper boundary of the descending channel and holds above the $0.60–$0.62 region, the path opens toward the moderate resistance at $0.75. Should bullish momentum continue, we could be looking at a retest of the psychological and historical strong resistance zone near the $1.00 mark where we’d expect both aggressive profit-taking and liquidity to build up.
💎On the flip side, any failure to break out and sustain above the current resistance would likely send price back down to retest the demand zone. If the structure gives in and closes below $0.45 on the daily timeframe, this would invalidate the bullish thesis completely and could trigger a sharper drop toward $0.35 or even lower as the broader market liquidates over-leveraged longs.
MyCryptoParadise
iFeel the success🌴

Most Will Get Trapped on EGLD’s Next Move Don’t Be One of ThemYello Paradisers, did you catch the EGLD breakout or are you still waiting for confirmation that’s already gone? While most traders are sleeping on this setup, it has just completed one of the cleanest breakout-and-retest patterns we’ve seen in weeks, and what comes next could leave many trapped on the wrong side.
💎#EGLDUSDT recently broke through its descending resistance with strength and has now retested that same level, which is acting as solid support in the $14.30–$15.00 range. This successful flip of resistance into support is a textbook bullish signal, and it’s holding beautifully indicating strong buyer presence and increasing the probability of continued upside.
💎If this support holds firm, #EGLD is eyeing a move toward the $18.00–$18.25 region, where moderate resistance is expected. A break above this could open the path toward the $19.90–$20.40 zone, a significant resistance level that may shape the next macro structure on this chart.
But it’s not all upside. If EGLD fails to hold the $13.00 level and especially the key invalidation point at $11.85 this entire bullish setup breaks down, and sellers will likely take control. The bullish momentum would collapse fast, and the door would open to much deeper downside levels.
MyCryptoParadise
iFeel the success🌴

Is ASTR About to Break Out or Break Down? Don’t Miss ItYello Paradisers! Are you positioned correctly, or will you once again find yourself on the wrong side of the market when the real move begins? If you’ve been with us, you know we’ve been waiting for this kind of setup with patience, and now it's time to pay attention.
💎#ASTR/USDT has been moving inside a clean descending channel, respecting both the upper resistance and lower support lines consistently. However, recent price action suggests a potential shift in momentum. After tapping into the strong demand zone between 0.0200 and 0.0215, the price has shown multiple sharp rejections from the lows, indicating that buyers are quietly stepping in.
💎Currently, the price is attempting to break out of the descending structure. We are closely watching how it reacts around the 0.0240 area, which is now acting as probable support. A successful retest of this level would be a significant structural shift, and it opens up the path to retest 0.0280 our first minor resistance. If momentum continues to build and that level breaks, the doors are wide open toward the 0.0310–0.0320 zone, with the final strong resistance sitting around 0.0345.
💎On the flip side, invalidation occurs if the price fails to hold above 0.0210. A clean break below that level could send #ASTR back toward 0.0190, nullifying the current bullish setup. Until then, we remain cautiously optimistic, waiting for the market to confirm direction before committing fully.
Stay sharp, Paradisers. The market is about to pick a side and we’ll be on the right one.
MyCryptoParadise
iFeel the success🌴

Is #ADA Ready For a Major Move or a Trap is Ahead? Watch this Yello, Paradisers! Is this breakout on #Cardano the start of a major upside move or just another bull trap waiting to flush out impatient traders? Let’s break down the latest #ADAUSDT setup:
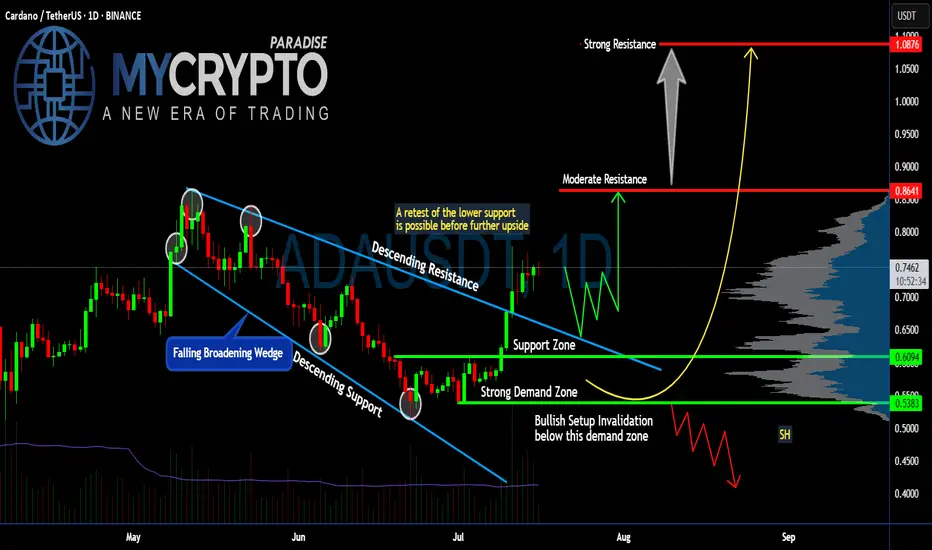
💎After weeks inside a falling broadening wedge, #ADA finally broke above the descending resistance, signaling a potential trend reversal. The breakout above $0.70 has pushed the price toward the current $0.74 zone. The soaring volume and a positive broader market outlook reinforce our bullish bias. While this looks bullish, the key question is whether #ADAUSD will hold above its reclaimed support or retest lower levels first.
💎The structure is straightforward: #ADA reclaimed the support zone around $0.70 after bouncing strongly from the demand zone near $0.61–$0.60. This demand zone remains the critical area to watch—any healthy retest here would provide a high-probability continuation setup for bulls.
💎If buyers maintain control, the first target sits at the moderate resistance of $0.86. That’s where the next notable selling pressure is expected. But the real battle will take place near the strong resistance at $1.08—a zone where major distribution and profit-taking could occur.
💎However, the bullish setup becomes invalid if #ADAUSD loses the $0.61–$0.60 demand zone. A confirmed close below $0.538 would flip the structure bearish, signaling a potential continuation to lower lows.
Stay patient, Paradisers. Let the breakout confirm, and only then do we strike with conviction.
MyCryptoParadise
iFeel the success🌴
Is #THETA Ready For a Major Reversal or Another Fakeout ahead?Yello, Paradisers! Is this breakout the beginning of a bullish reversal for #THETA or just a setup to trap the herd before a sharp dump? Let’s break down the setup of #ThetaNetwork:
💎After weeks of slow bleeding inside a falling wedge, #THETAUSDT has broken out of this pattern. The price is currently hovering around $0.718, and it’s the first time in weeks we’re seeing real bullish momentum starting to build. The volume is slowly picking up, so the probability of a bullish push is higher.
💎A clean breakout above the descending resistance now opens the door toward moderate resistance at $0.999. That’s the next key hurdle where we expect sellers to show up. If bulls are strong enough to clear that zone, we’re targeting the strong supply level at $1.284, where significant distribution will likely begin.
💎Why this setup matters: The support zone between $0.60 and $0.66 has acted as strong demand for multiple weeks now for #THETAUSD. Price wicked into it again recently and got bought up quickly, forming a potential higher low. This kind of accumulation behavior often precedes a strong leg up if volume confirms the move.
💎However, if price loses the key support at $0.60, and more importantly breaks below the setup invalidation level at $0.439, we’ll treat this as a failed breakout and expect a deeper correction. That would bring us back into the lower demand zones, and we’ll sit on our hands until the next proper high-probability entry appears.
Stay patient, Paradisers. Let the breakout confirm, and only then do we strike with conviction.
MyCryptoParadise
iFeel the success🌴

SOL/USDT : SOL Rebounds Strong – Is a 25% Rally Just Beginning?By analyzing the Solana (SOL) chart on the daily timeframe, we can see that after dropping to the $147.75 zone, the price experienced renewed buying pressure and has since rallied to around $159, delivering over 6% return so far.
This cryptocurrency shows strong bullish potential, with short-term gains possibly exceeding 25%.
The next upside targets are $168.5, $187, $220, and $263.
Please support me with your likes and comments to motivate me to share more analysis with you and share your opinion about the possible trend of this chart with me !
Best Regards , Arman Shaban

ADA/USDT : +50% in 21 Days, More Rise Ahead? (READ THE CAPTION)Over 50% growth in just 21 days — Cardano’s explosive rally continues, and the $0.76 target has now been hit! Since our last analysis, ADA has kept pushing higher, successfully reaching the next key level and bringing the total return from this move above 50%. Currently trading around $0.73, with strong bullish momentum still in play, I expect it won’t be long before we head toward the next targets. Upcoming levels to watch: $0.93, $1.05, and $1.33 — we’re getting closer to that 100% gain!
Please support me with your likes and comments to motivate me to share more analysis with you and share your opinion about the possible trend of this chart with me !
Best Regards , Arman Shaban

Ethereum – Calm Before the Next Leg Up?Ethereum had a disappointing start in 2025.
After pushing above $4,000 in mid-December 2024 — with headlines full of "$10K ETH coming!" — the new year began around $3,500, and what followed was a slow bleed.
By early April, Ethereum printed a shocking low at $1,380 — a level few believed was even possible.
But the bounce from there? ⚡
It was explosive — nearly +100% in just one month, with price topping around $2,700.
Since then, we’ve been consolidating — and that’s completely normal after such a vertical move.
🔍 So, what’s next?
Technically, ETH is forming a rectangle, a structure that often resolves as a continuation pattern.
The spike down to the $2,300 zone on May 19th was telling — buyers stepped in aggressively and pushed price back above $2,500, which now acts as a comfort zone for bulls.
📌 Conclusion
I’m looking to buy dips, ideally near $2,550, and my target is the $3,500 zone.
No need to reconsider the bullish outlook as long as price holds above $2,300.

Can #AXS Bulls Sustain the Momentum or Will it Fall? Key LevelsYello, Paradisers! Will #AXS finally deliver a strong upside move, or are we just seeing another setup to trap impatient bulls before a deeper drop? Let’s break down the latest #AXSUSDT structure:
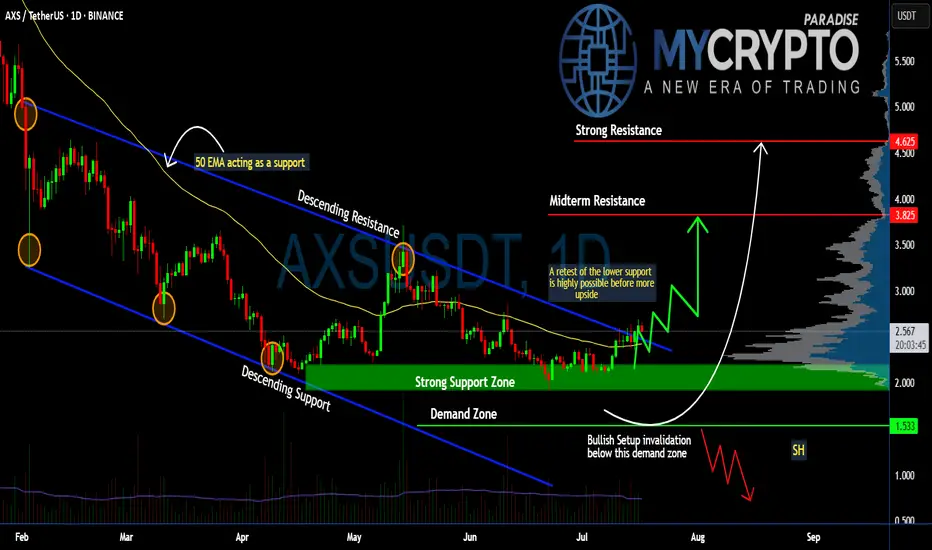
💎After months inside a descending channel, #AxieInfinity has finally broken above the descending resistance, showing early signs of a potential trend reversal. The current price trades around $2.56, but history tells us a retest of lower levels is still highly possible before any sustained upside move. The soaring volume and a positive broader market outlook reinforce our bullish bias.
💎The structure is clear: the strong support zone sits between $2.20–$2.00, and this is the first critical level to watch. A healthy retest here would provide a high-probability continuation setup for bulls. Below that, the demand zone at $1.53 is the last stronghold—losing this level would invalidate the bullish scenario completely.
💎If buyers maintain control, the first upside target stands at the midterm resistance of $3.82, where some profit-taking and selling pressure are expected. A clean breakout above this zone could push the price toward the strong resistance at $4.62, where major distribution could occur.
💎However, the bullish setup becomes invalid if #AXSUSD loses the $1.53 demand zone. A confirmed daily close below this level would flip the structure bearish and open the door for a move to new lows.
Stay patient, Paradisers. Let the breakout confirm, and only then do we strike with conviction.
MyCryptoParadise
iFeel the success🌴
Will LINKUSDT Explode Soon — or Collapse Into a Trap?Yello Paradisers, are you prepared for the next big LINK move? The breakout you’ve been waiting for just happened — but before you jump in, let’s break down what’s really going on behind the chart.
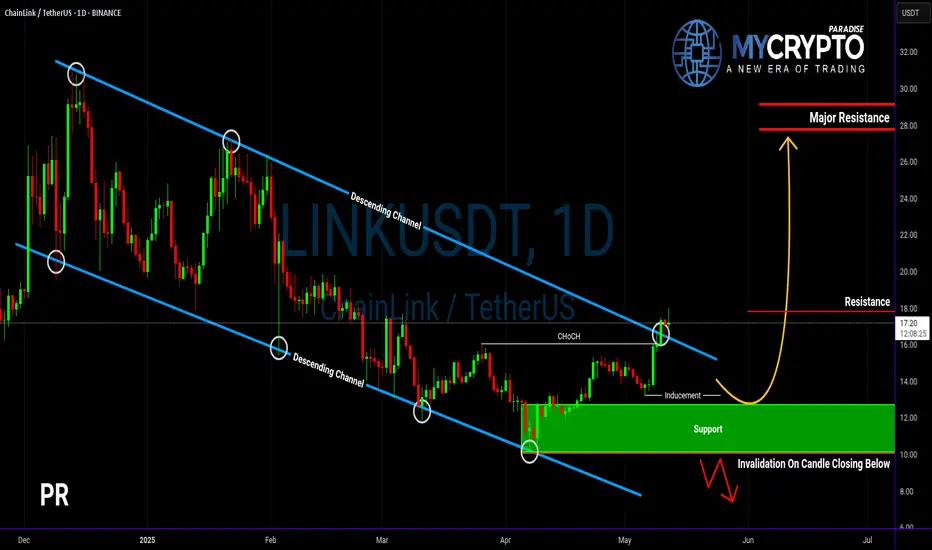
💎LINKUSDT has officially broken out of its descending channel — a significant structural shift that immediately increases the probability of a bullish continuation. On top of that, we’ve seen a bullish CHoCH (Change of Character), a powerful sign that demand is stepping in. These are early but critical signs that bulls may be regaining control.
💎However, experienced traders know not to act on the first sign of strength alone. We now need to see how price behaves on the pullback. If LINK pulls back and takes out the inducement (removing weak hands), we’ll be looking for a bullish internal CHoCH (I-CHoCH) on the 1H timeframe. If that forms, the probability of a solid bounce from the support zone becomes extremely high — giving us the confirmation we need to position for upside.
💎On the other hand, if price breaks down and closes a candle below the support zone, this entire bullish setup becomes invalid. In that case, it would be wise to remain patient and wait for better, more reliable price action to develop before making any move. This is exactly where most traders lose by forcing trades instead of waiting for clear signals.
🎖A big liquidation event, which will first take both longs and shorts and fully get rid of all inexperienced traders before the real move happens, is very close to happening again. so make sure you are playing it safe Paradisers. It will be a huge money-maker for some and a total disaster again for the majority.
MyCryptoParadise
iFeel the success🌴
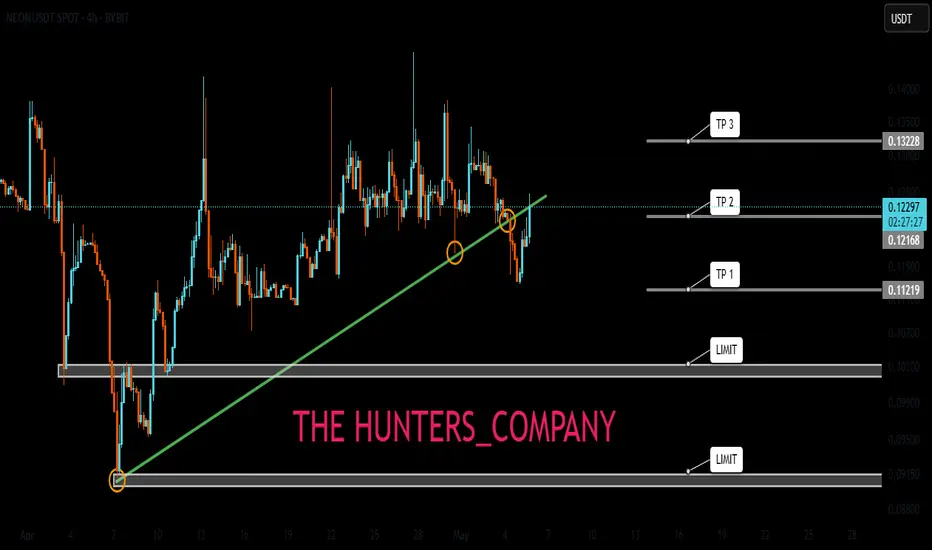
NEON : How long does the decline last?Hello friends
If you are a holder of this currency or have bought it, you should know that the token release is coming and this will cause the price to drop, so be careful.
We have identified good buying ranges for you, where you can buy in case of a drop, with risk and capital management.
*Trade safely with us*
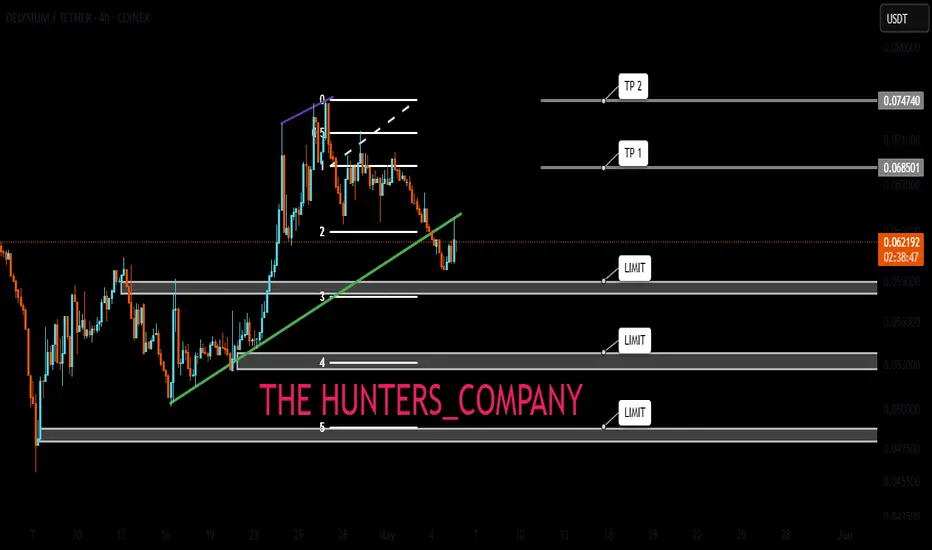
AGI : The fall is comingHello friends
As the price has reached a strong resistance area, you can see that the price has been corrected and lower lows have been made. Now, given the token release that this currency has, there is a possibility of further decline, so we can buy at lower points with capital and risk management and move with it to the specified targets.
*Trade safely with us*
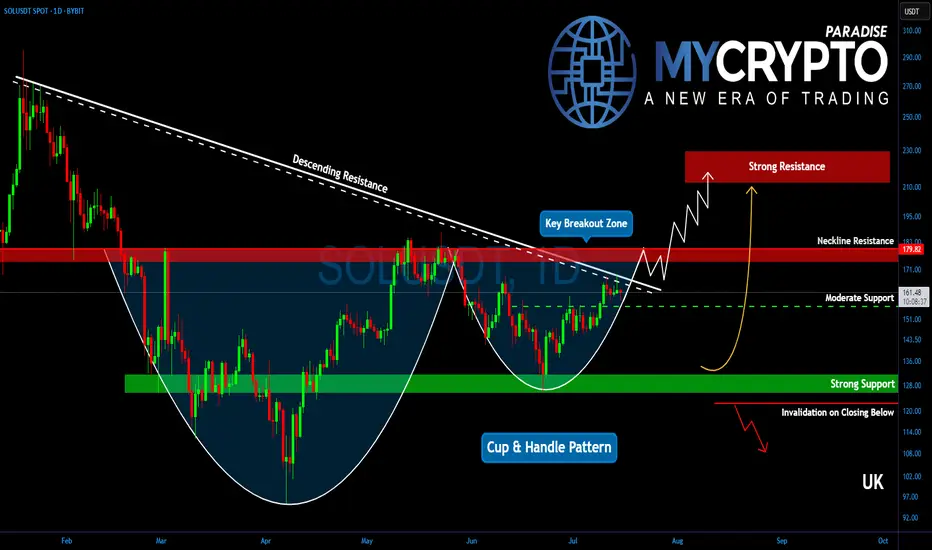
Will Solana Explode? This Important Zone Could Trigger a MoveYello, Paradisers! Is #Solana about to break free into a new bullish wave? After months of struggling under key resistance, the bulls are finally making a serious push… but only one zone stands between SOL and a potential explosion.
💎After peaking in January, Solana has remained suppressed under a descending trendline. But now, that trendline is being challenged aggressively, and the price structure is starting to form a reversal pattern that demands attention.
💎Right now, the most important level on the chart is the descending channel resistance at $167. Bulls are actively testing this zone, and if they manage to flip it into support, it could trigger a significant shift in momentum. But just above, at $180, sits an even more critical barrier, the neckline of the current reversal pattern. This entire region between $167 and $180 is the true battleground.
💎#SOLUSDT's confirmed breakout above $180 would be a major technical signal. It would likely send Solana toward the $210 to $225 zone, which marks a significant resistance area. This isn’t just psychological; it also aligns with the 61.8% Fibonacci retracement, a level where institutional players often begin offloading positions
💎As for the downside, support remains solid between $155 and $160. This region is protected by both horizontal demand and dynamic support from key moving averages, offering bulls a stable base to defend. Adding to the bullish case is a potential golden cross formation between the EMA-50 and EMA-200, a signal that, if confirmed, could inject even more confidence into Solana’s price action.
Paradisers, strive for consistency, not quick profits. Treat the market as a businessman, not as a gambler.
MyCryptoParadise
iFeel the success🌴
PENGU Just Triggered a Massive Breakout! Key Levels to WatchYello, Paradisers! Are you watching what’s unfolding with #PENGU after months of quiet accumulation? Because this chart is finally waking up, and it’s happening right now.
💎After a prolonged bottoming phase that lasted approximately 162 sessions, PENGU has completed a classic cup and handle formation, and we’re now seeing the start of what could be a powerful breakout.
💎#PENGUUSDT has surged above the neckline resistance at $0.01680, and—more importantly, this breakout is backed by strong volume, giving the move real credibility. It’s not just a wick; it’s a genuine push.
💎Now that the neckline is broken, PENGU has room to push higher. But let’s be clear, price is likely to face moderate resistance at the $0.02280 level. That’s a spot where some short-term profit-taking can’t be ruled out, especially from early entries. It’s a natural reaction zone and a moment to watch for how price behaves under pressure.
💎Still, if momentum holds, the pattern suggests a potential move toward the $0.02820 to $0.03200 region. That zone is no joke. It includes the 61.8% and 78.6% Fibonacci retracement levels, two of the most powerful technical resistance points in any market cycle. This makes that area a major decision zone and one that should be approached with caution.
💎On the other side, support is now established between $0.01680 and $0.01500. This is the previous resistance zone, and any retest into this range is likely to see strong demand stepping in. It would not be surprising to see buyers defend this area aggressively, especially if the retest is clean and orderly.
Strive for consistency, not quick profits. Treat the market as a businessman, not as a gambler. This is the only way you will make it far in your crypto trading journey. Be a PRO.
MyCryptoParadise
iFeel the success🌴

Can #BAND Bulls Maintain this Momentum or Will Bears Win? Yello, Paradisers! Is #BANDProtocol breakout from the falling wedge legit—or are bulls walking straight into a trap? Let's dig into the latest setup of #BANDUSDT:
💎After trading for weeks inside a falling wedge, #BAND has finally broken out with solid momentum. The breakout above the resistance trendline at around $0.66 has already occurred, and the price is currently hovering near the $0.72 zone. While this move is promising, it’s now all about whether this breakout can hold or fake out.
💎The structure here is clear: #BANDUSD reclaimed the demand zone between $0.60–$0.66 after bouncing off strong support at $0.504. This zone now becomes the most important area to watch in the short term. A retest of this level would offer a high-probability continuation setup, especially since the 50EMA is now acting as dynamic support beneath the price.
💎If bulls can maintain control, we have a clear path toward the moderate resistance at $0.992. That’s where the next wave of selling pressure is expected. But the real prize is the strong resistance zone near $1.180. That’s the level where major distribution could occur, and it's where we’ll be watching closely for profit-taking signs.
💎However, the bullish thesis breaks down completely if the price drops back below the $0.60–$0.66 demand zone. In that case, our invalidation point sits firmly at $0.504. A close below that support would indicate bears are back in control, and we’d shift to a defensive stance, targeting lower re-entry zones.
Stay patient, Paradisers. Let the breakout confirm, and only then do we strike with conviction.
MyCryptoParadise
iFeel the success🌴

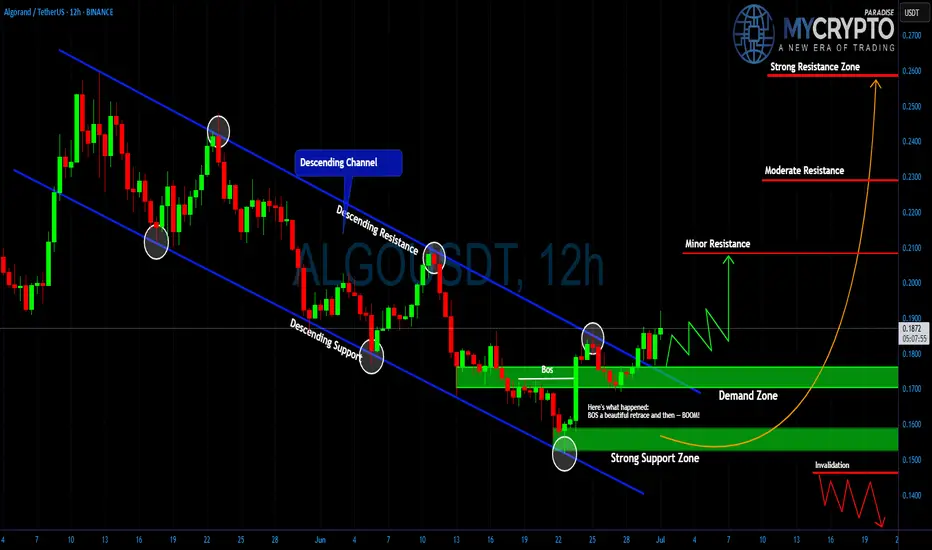
ALGO: Surprise Rally Ahead?Yello Paradisers, did you spot that breakout from the descending channel in time or are you still waiting for confirmation that already happened?
💎#ALGO/USDT has officially broken out of its multi-week descending channel after a textbook Break of Structure (BoS). Price action gave us a beautiful retrace into the demand zone, and from there boom momentum began shifting. This move is now showing early signs of bullish continuation, but as always, the majority will only realize it once the big move is already done.
💎#ALGO had been trading within a clearly defined descending channel, with price reacting precisely between the descending resistance and descending support lines. The breakout occurred after a strong candle pierced the descending resistance, and more importantly, we got a BoS followed by a clean retest of the demand zone around $0.165–$0.175. That reaction was sharp and decisive, indicating strong interest from buyers stepping in.
💎As of now, it is trading near $0.186 and forming higher lows, which supports the idea of an ongoing trend reversal. The structure has changed, and bulls are slowly regaining control. If price sustains above $0.190, the doors open for further upside. The first key level that could slow momentum is minor resistance near $0.210. If that level breaks with volume, moderate resistance around $0.230 becomes the next critical zone. Above that, the major target sits at $0.260, a strong resistance area where a lot of liquidity could be triggered.
💎On the flip side, the strong support zone between $0.145 and $0.155 remains our invalidation area. If price drops below this range, the bullish setup collapses, and we reassess the entire structure. But unless that happens, the bias remains cautiously bullish.
Trade Smart. Stay Patient. Be Consistent.
MyCryptoParadise
iFeel the success🌴
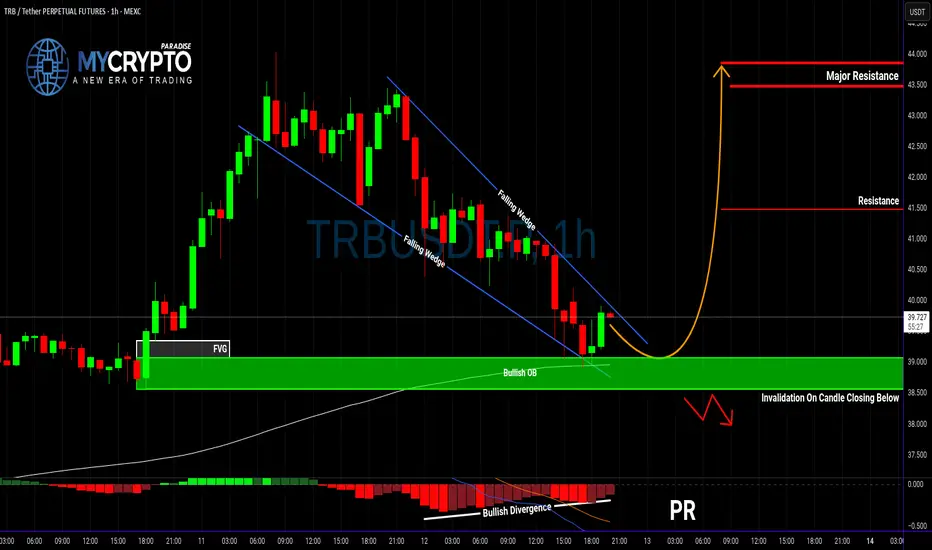
TRBUSDT: Massive Bullish Setup or a Fakeout Trap?Yello Paradisers — is TRBUSDT gearing up for a major breakout, or is this just another fakeout before a deeper drop? Our previous calls have been consistently accurate, and now this chart is flashing multiple signals that deserve your full attention.
💎Currently, TRBUSDT has formed a textbook falling wedge pattern, a well-known bullish reversal signal. What's adding strength to this setup is a clear bullish divergence, suggesting that momentum may be shifting in favor of the bulls. Even more compelling, the price is now holding firmly inside a bullish Order Block (OB) zone, which is aligned with the 200 EMA — a powerful confluence that increases the probability of a bullish move significantly.
💎For aggressive traders, this could be a valid spot to enter immediately, capitalizing on the current structure and zone. However, for those looking for a more calculated entry with improved risk-to-reward, waiting for a pullback could provide a much better setup — with the potential to offer over 4.5 RR, making it a high-probability trade idea.
💎That said, it’s important to manage risk carefully. If TRBUSDT breaks down and closes candle below the bullish OB zone, this would invalidate the bullish setup entirely. In that case, the smart move would be to wait patiently for new price action to form before making any decisions. Reacting emotionally here could lead to unnecessary losses, so discipline is key.
🎖Strive for consistency, not quick profits. Treat the market as a businessman, not as a gambler. If you want to be consistently profitable, you need to be extremely patient and always wait only for the best, highest probability trading opportunities.
MyCryptoParadise
iFeel the success🌴
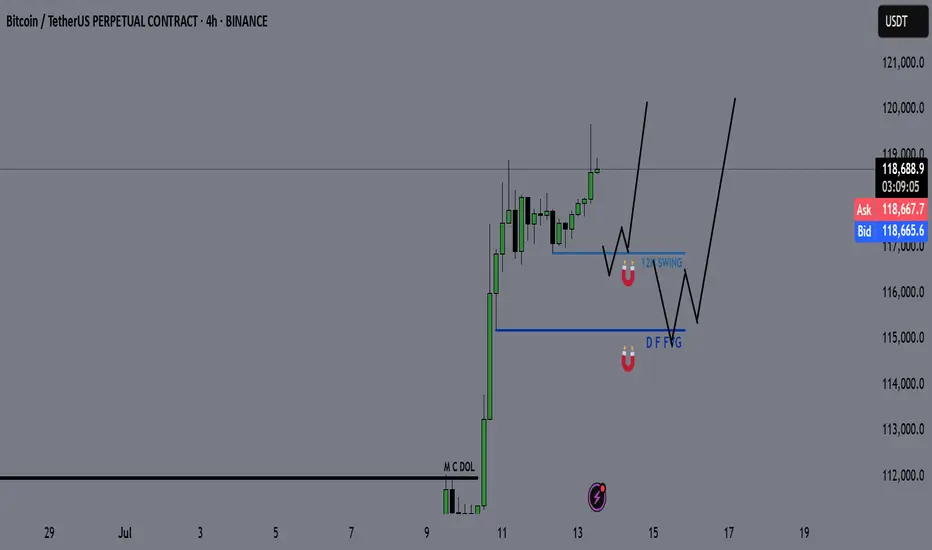
Bitcoin - BTC | Weekly Market Recap & Outlook 13.07.2025What Happened Last Week?
Bitcoin broke out of the recent downtrend structure and established a bullish leg with clear momentum.
The breakout was supported by volume and price structure, suggesting a trend reversal rather than a temporary deviation.
Weekly Bias and Strategy
The current outlook is bullish.
A retracement or sideways consolidation between the $120,000 and $114,000 zone is possible.
This zone may act as accumulation before further upside.
Key Points of Interest (POIs):
12H Swing Liquidity (turquoise line)
Daily FVG (blue line)
These levels will be monitored for long setups with confirmation on lower timeframes.
Macro Consideration – Fed Chairman Jerome Powell
Recent market speculation has increased regarding Jerome Powell potentially stepping down as Chair of the Federal Reserve.
If such a resignation is confirmed, it may act as a significant bullish catalyst for Bitcoin and other risk assets, possibly accelerating upside without allowing for any meaningful pullback.
Summary
• Bullish breakout confirmed
• Long bias maintained unless major invalidation occurs
• Watching retracement levels for entries
• Macro catalyst (Powell resignation) may trigger strong continuation without retrace
PENGU = ETF Catalyst + Whale Accumulation = +30% More Upside?Today, on the weekend, I want to analyze the Pudgy Penguins project with the PENGU ( BINANCE:PENGUUSDT ) token from a fundamental and technical perspective .
Please stay with me.
Why did PENGU surge nearly 40% in just 48 hours? Here’s what’s driving it:
------------------------------------------
Fundamental Analysis:
1. ETF Momentum via Cboe:
On June 26, Cboe officially filed a 19b-4 form for a new ETF that includes Pudgy Penguins and PENGU as major components.
Although not yet approved, this single move has fueled strong institutional anticipation, similar to what happened with Bitcoin ETFs in early 2023.
The market often prices in future narratives — and this ETF storyline has been a powerful one.
2.Whale Accumulation Signals
According to Nansen data, large holders have increased their balances by 11.37%, and notable wallets linked to public figures by 7% over the last 30 days.
Such coordinated accumulation often precedes major price moves, and that pattern seems to be repeating here.
3.NFT Ecosystem Boost
The Pudgy Penguins NFT collection saw a 400%+ surge in sales volume.
This sharp increase in NFT activity has reignited attention toward the broader Pudgy ecosystem, which naturally benefits its native token, PENGU.
Risk Note:
The ETF is not yet approved — we're still in the hype phase.
Volatility remains high, and strong pullbacks are common in low-liquidity tokens like PENGU.
If whale activity continues and institutional narratives grow, the upside potential remains — but so does the downside risk.
------------------------------------------
PENGU token started to rise from the Support zone($0.01-$0.0076) . One of the signs of a continuation of the uptrend was the break of the upper line of the descending channel .
Educational Note: One of the price targets after a channel break can be as wide as the width of the broken channel.
In terms of Elliott Wave theory , it seems that the PENGU token has completed the Double Three Correction(WXY) , and we can wait for the next impulsive waves .
I expect the PENGU token to attack the Resistance zone($0.0128-$0.0118) again, and if this zone is broken , it can increase to at least $0.0137(+30%) .
What is your idea about the Pudgy Penguins project?
Note: If the PENGU token drops below $0.01, we can expect a break of the Support zone($0.01-$0.0076).
Please respect each other's ideas and express them politely if you agree or disagree.
Pudgy Penguins Analyze (PENGUUSDT), 4-hour time frame.
Be sure to follow the updated ideas.
Do not forget to put a Stop loss for your positions (For every position you want to open).
Please follow your strategy and updates; this is just my Idea, and I will gladly see your ideas in this post.
Please do not forget the ✅' like '✅ button 🙏😊 & Share it with your friends; thanks, and Trade safe.

Is BNB About to Explode—or About to Collapse?Yello Paradisers! Could this be the beginning of the next BNB rally, or just another classic trap to liquidate early longs before the real move begins? Let’s dive into this high-probability setup before it’s too late.
💎BNBUSDT is currently showing good signs of bullish continuation. The price has successfully broken out of a descending channel and performed a precise retest of that structure—an early confirmation of strength. Following this, we’ve seen a strong reaction from a Fair Value Gap (FVG) and the 200 EMA, both of which align perfectly with the inducement taken just before the bounce. This confluence of technical signals significantly increases the probability of a sustained bullish move in the near term.
💎If price pulls back from current levels, it could offer us a more attractive risk-to-reward opportunity for long entries. Traders who are targeting higher RR ratios, such as 1:2 or beyond, may prefer to wait for a deeper pullback into our predefined support zone for a cleaner entry. This zone remains critical for maintaining our bullish bias.
💎However, if the price breaks down and we see a full candle close below that support zone, the entire bullish scenario becomes invalid. In such a case, it would be more prudent to stay on the sidelines and wait for a clearer and more favorable price action setup to emerge before jumping back in.
We are playing it safe right now. If you want to be consistently profitable, you need to be extremely patient and always wait only for the best, highest probability trading opportunities.
MyCryptoParadise
iFeel the success🌴

Is #RENDER Ready for a Reversal or Will it Continue to Fall?Yello, Paradisers! Is this just another range before a full reversal or a sneaky trap waiting to punish early buyers of #RENDER? Let's see the latest analysis of #RENDERUSDT:
💎After several weeks of slowly bleeding within a clean descending channel, #RENDERUSDT is now attempting a breakout from that structure. While the move isn’t confirmed just yet, this is the first real signal that sellers are losing momentum, and a shift could be on the table. Price is currently hovering just above the $3.15–$3.20 zone, and the next few candles will be key.
💎If buyers step up and push #RENDER through this upper trendline with strength, we have a clear runway toward the moderate resistance at $4.20. And if that gets taken out, the next strong resistance area comes in at $5.35, where we expect heavy distribution. But for now, it’s all about reclaiming and holding above this descending structure.
💎So what gives this setup real potential? The demand zone at $2.97 held like a fortress. If it fails, the next line of defense is a strong demand zone at $2.50. Buyers defended it multiple times and sparked a mini-reversal off the bottom of the channel. This demand zone is our launchpad, and as long as the price stays above it, bulls are still in control.
💎But make no mistake: if price loses $2.97, the bullish setup is invalidated. That would open up a deeper drop back toward $2.50 or lower, and we’ll step aside to wait for a better entry again.
Stay patient, Paradisers. Let the breakout confirm, and only then do we strike with conviction.
MyCryptoParadise
iFeel the success🌴

Is a Breakout Imminent for #GRT or Another Bull Trap is Ahead?Yello, Paradisers! Are we looking at a clean breakout setup that could send #GRT flying or is this the perfect trap to wipe out early bulls? Let's see the latest #GRTUSDT moves:
💎The daily chart on #GRTUSD is showing a perfectly formed descending channel, with price now hovering just above the lower boundary—a zone that has consistently held as strong descending support. After multiple rejections from the upper boundary and rebounds off the lower trendline, the price has now shown its first serious signs of momentum since bottoming in the strong demand zone
💎This structure has been in play since early May for #TheGraph, with each bounce from the support line giving temporary relief, only for the price to get slapped down at the descending resistance. But this most recent bounce looks different—it’s happening directly above a well-defined demand zone between $0.0668–$0.0700, a level that has historically attracted strong buyer interest.
💎A breakout above the descending resistance trendline, ideally with a strong daily close above $0.085–$0.090, would invalidate the bearish pressure and likely trigger a sharp leg up. The mid-term resistance sits around $0.1032, and clearing that would open the door to a retest of $0.1318, a level that previously acted as a strong rejection zone.
💎If the price fails to reclaim the descending channel and rolls over again, especially losing $0.0668 on a daily close, the bullish structure would be invalidated. That would shift focus toward the support zone at $0.053, and if that breaks, the next target becomes $0.0300—a brutal drop that would liquidate most late longs and signal deeper downside.
Stay disciplined. The next big opportunity will come to those who wait, not those who chase.
MyCryptoParadise
iFeel the success🌴
