Is BLZ About to Explode? Critical Levels You Can't Miss!Yello, Paradisers! Are you ready to spot the next big move on BLZ/USDT? The price action is at a make or break moment, and understanding these key levels could define your next trading decision. Let’s dive into it.
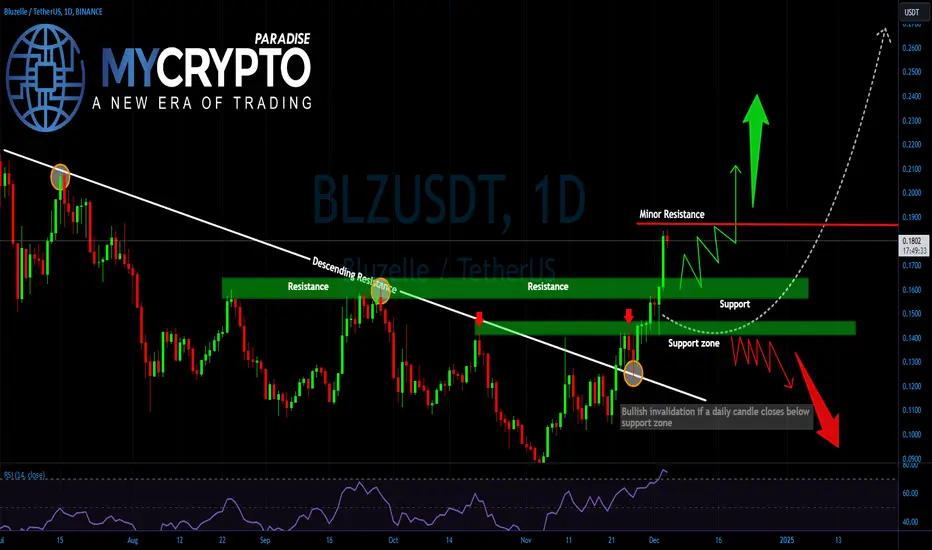
💎 BLZ/USDT surged past a descending resistance line that had suppressed price action for months, signaling a potential bullish breakout. For now, the price is approaching the current minor resistance around $0.1866, which is capping upward movement. If BLZ manages to break above this zone with conviction, we could see a strong rally targeting the $0.25–$0.27 region, which represents the next significant resistance level.
💎 If the price fails to break above the minor resistance, it could retrace to the $0.1563–$0.1638 support zone, which is now a crucial area to watch. This zone, previously a resistance level, is acting as a foundation for further upside momentum. As long as this level holds, the bulls remain in control.
💎However, if the price falls below the $0.1563–$0.1638 support zone, a deeper correction toward the $0.1412–$0.1461 lower support zone could unfold. Buyers are likely to step in aggressively at these lower levels. A decisive daily close below the lower support would invalidate the bullish structure, potentially leading to a sharp decline and trapping late buyers.
Trade smart, Paradisers, and let the market come to you. It’s all about consistency and strategy. Stay focused and keep mastering the art of trading.
MyCryptoParadise
iFeel the success🌴
Cryptosignals
CHAINLINK (LINKUSD): Bullish Move After Breakout
Link broke and closed above a significant horizontal daily resistance.
Retesting the broken structure, the price bounced and violated
a resistance line of a falling wedge pattern.
It indicates a highly probable coming resumption of a bullish trend.
With a high probability, the price will hit 26.5 level soon.
❤️Please, support my work with like, thank you!❤️

#JTOUSDT Ready for a Massive Move or Not? Key Levels to WatchYello, Paradisers! Is #JTOUSDT ready for a massive move above or not? Let's discuss the latest analysis of #Jito and see what's happening:
💎#JTO is navigating a pivotal juncture as it consolidates near a critical resistance zone. Over the past months, the price has broken out of a descending trendline that previously acted as strong resistance, now flipping into support. This shift marks a crucial moment in #JTO’s price structure, with the next move likely to define its trajectory.
💎The immediate resistance to monitor is $3.98. A decisive break and daily close above this level would pave the way for a potential bullish rally. If buyers manage to sustain momentum, the price could climb toward the major resistance zone between $6.50 and $7.00. Such a move would likely attract significant buying interest and signal a potential trend reversal.
💎On the downside, key support levels are sitting at $3.17 and $2.90, with a robust demand zone established around $2.60. As long as the price holds above this demand zone, the bullish structure remains intact. A bounce from these levels would offer bulls another opportunity to regain control and attempt a breakout.
💎However, if the price breaks below the $2.60 demand zone, it would invalidate the bullish outlook and increase the likelihood of further downside toward the $1.90–$2.00 region. This bearish scenario would create opportunities for short sellers while potentially shaking out weak hands before any future recovery.
Stay focused, patient, and disciplined, Paradisers🥂
MyCryptoParadise
iFeel the success🌴

Can #ORDIUSDT Bulls Sustain this Bullish Momentum or Not?Yello, Paradisers! Can #ORDIUSDT bulls sustain the current bullish momentum or not? Let's look at the latest analysis of #ORDI to see what's happening:
💎#ORDI is trading within a descending channel formation, a clear technical pattern indicating a persistent downtrend over the past months. With the price breaching descending resistance near the channel, the upcoming movements will be decisive in shaping ORDI’s trajectory for the foreseeable future.
💎The immediate resistance to watch is $66.20, which aligns with the descending channel’s upper boundary. A daily close above this resistance level would confirm a breakout, signaling the potential beginning of a bullish trend reversal. Such a move could drive the price toward the major resistance zone near $100, attracting fresh buyers and sparking renewed market confidence.
💎On the other hand, failure to break above $66.20 could result in the price retracing toward the $35.85 support level, which has previously acted as a strong demand zone. A bounce from this level would provide bulls another opportunity to reclaim momentum and challenge the resistance once again.
💎However, if ORDI closes below the $29.19 demand zone, it would invalidate any bullish case, paving the way for further downside. In this scenario, we could witness an extended drop toward lower levels around $18, reinforcing the bearish outlook and shaking out weak hands.
Stay focused, patient, and disciplined, Paradisers🥂
MyCryptoParadise
iFeel the success🌴

Chainlink Targets $35: Key Resistance at $25 in FocusHello,
Chainlink (LINK) is maintaining strong bullish momentum, currently approaching the $25 resistance level. A confirmed breakout here could open the path toward $35 as an initial target. Monitor the price action around the resistance zone for confirmation. As always, ensure effective risk management is in place.
BR,

FTM | Andre Cronje & SONIC UPGRADEThe Future of DeFi: Insights from Andre Cronje & the Sonic Network
Andre Cronje, a pioneer in decentralized finance DeFi, has long been a critical voice in the evolution of blockchain technologies. His journey, which spans revolutionary projects like Yearn Finance to his current work with the Sonic Network, provides valuable insight into the challenges and opportunities shaping the DeFi landscape
Evolving Challenges in DeFi and Regulation
Cronje’s recent discussions frequently highlight the shift in DeFi from its nascent, experimental stages to a more mature, regulated industry. As governments and regulatory bodies increase scrutiny, developers are forced to navigate a complex maze of compliance. Cronje emphasizes the importance of engaging traditional finance professionals to bridge the gap between on-chain technology and regulatory frameworks, a step he acknowledges was challenging but necessary. This convergence, though fraught with hurdles, marks a vital evolution as the DeFi space seeks broader legitimacy.
Sonic Network: A Vision for NextGen Blockchain Performance
At the forefront of Cronje’s work is the Sonic Network, a high-performance blockchain designed to tackle critical bottlenecks in DeFi. Built on innovations like the Carmen database and customized for Ethereum Virtual Machine (EVM) compatibility, Sonic addresses issues of scalability, speed, and usability. With features like over 10,000 transactions per second TPS and sub-second finality, Sonic is poised to redefine the user experience in DeFi applications. Its fee-sharing model also redistributes 90% of transaction fees back to decentralized applications (dApps), incentivizing innovation and reducing reliance on validators.
Technological Plateaus and the Need for New Leaps
Cronje frequently underscores that DeFi’s progress is not linear but iterative. The field has often reached technological plateaus, awaiting breakthroughs like the advent of zero-knowledge proofs or significant enhancements in execution environments. These advances, Cronje believes, will enable the next wave of DeFi applications, allowing for trustless exchanges, oracles, and execution layers to replace current, trust-dependent systems.
The Shifting Demographics and Culture of DeFi
One of Cronje’s more provocative insights pertains to the cultural shift within DeFi. The early days were dominated by technologists and developers motivated by pure innovation. Today, the space is increasingly influenced by meme coins and speculative trading, drawing in a demographic less interested in foundational technology. While this shift has broadened crypto's appeal, it raises concerns about the dilution of DeFi’s original ethos of decentralization and technological advancement.
App Chains vs Layer1 Models
Cronje also critiques the growing trend of app-specific chains (app chains), which allow projects to customize their execution environments. While he acknowledges their appeal, particularly for gaming and niche use cases, Cronje believes their economic and operational overheads make them impractical for many teams. Instead, he champions models like Sonic’s, where developers can deploy on a scalable Layer 1 network and retain a significant share of value without the burden of maintaining a standalone blockchain.
The Path Forward: Balancing Regulation, Innovation, and Adoption
Looking ahead, Cronje envisions a DeFi ecosystem that balances regulatory compliance with technological innovation. Projects like Sonic embody this vision by reducing barriers for developers and fostering sustainable ecosystems. However, he warns that achieving this balance requires addressing cultural shifts, incentivizing genuine innovation, and maintaining a focus on decentralization
Andre Cronje’s work and insights serve as a guide for navigating DeFi’s complex future. From overcoming regulatory challenges to pioneering the Sonic Network, he highlights the necessity of technological evolution and the importance of maintaining DeFi’s foundational principles. As the space continues to mature, Cronje’s vision underscores the need for resilience, adaptability, and a commitment to innovation.
let’s talk about the price
Right now, BTC is slowing down, and whales are swimming in altcoin oceans. The Sonic upgrade is a great reason to send FTM’s price to the moon, so buy the dip and wait for a month
next targets for FTM or better to say S are 1.3, 1.5 and 1.9$

CHZUSDT: Is a Major Bullish Reversal on the Horizon?Yello Paradisers! Are you ready for what might be a big move in CHZUSDT? It’s starting to show some strong bullish signals, and missing this could be a mistake. 👀
💎CHZUSDT has displayed a Change of Character (CHoCH) along with a Break of Structure (BOS), pointing towards a bullish market structure shift. Additionally, the formation of an Inverse Head and Shoulders pattern is further boosting the probability of a potential bullish move.
💎But here’s the crucial part! If CHZUSDT breaks out and closes a candle above the resistance zone, it will validate the pattern and increase the probability of bullish move.
💎In case of a pullback, we’re looking at the strong demand zone as a potential bounce area. However, we’d prefer to wait for an Internal CHoCH that realigns the market structure into bullish territory before making any moves. This confirmation would enhance the probability in our favor.
💎On the flip side, if CHZUSDT breaks down and closes below the strong demand zone, it would invalidate the entire bullish setup. At that point, it’s wiser to step back and wait for a clearer price action to develop.
🎖Patience and discipline are key here, Paradisers. Wait for the best setups, and don’t rush into trades without solid confirmation. Trade smart, and stay ahead of the crowd!
MyCryptoParadise
iFeel the success🌴

LTCUSDT Breakout: Are You Ready for the Next Big Move?Yello, Paradisers! Have you been watching LTCUSDT lately? If not, it’s time to pay attention because things are heating up fast!
💎LTCUSDT has broken out of a descending channel and is now forming an inverse head and shoulders pattern, a classic bullish signal.
💎If LTC can break and close a candle above the resistance zone, this will confirm the pattern and significantly increase the likelihood of a bullish surge.
💎Now, if we see a pullback, watch closely! A potential double bottom could form at the support zone. For safety, though, waiting for an I-CHoCH (Internal Change of Character) to confirm a shift back to bullish market structure will increase the probability in our favor.
💎However, if the price breaks down and closes below the support zone, this invalidates the bullish setup completely. In this scenario, it’s smarter to wait for clearer price action before making any moves.
🎖Patience is key here, Paradisers. Don’t rush into trades—wait for clear confirmations to stay on the right side of the market! Stay sharp and trade smart.
MyCryptoParadise
iFeel the success🌴

#PDAUSDT Getting Ready for a Massive Breakout or Not? Key LevelsYello, Paradisers! Can #PlayDapp bulls get enough momentum for a bullish breakout or not? Let's look at the latest analysis of #PDAUSDT and see what's happening:
💎#PDA is trading within a descending channel formation, showing a clear downtrend structure that has persisted for months. While the price is testing key levels, the next move will determine whether the #PlayDapp breaks free from its bearish grip or continues its downward slide.
💎The immediate focus is on the $0.067 resistance zone, which aligns with the channel’s upper boundary. A decisive breakout above this level would signal the start of a trend reversal, opening the door for a move toward the major resistance zone at $0.126. Such a breakout would likely bring renewed bullish sentiment and attract new buyers.
💎However, if #PDAUSDT fails to break above $0.067, the $0.045 support zone will become crucial. This zone has consistently acted as strong support and a bounce from here could allow bulls to regroup for another attempt at breaking resistance. Failure to hold will send it to the $0.037 demand level.
💎If the #PDAUSD closes below $0.037 on the daily chart, it would confirm a bearish breakdown, invalidating any bullish recovery. In this scenario, we could see a continuation of the downtrend toward lower levels, potentially testing $0.025 or below, which would further reinforce bearish sentiment.

#WOO Ready for a Major Upward Move Or Not? Key Levels to WatchYello, Paradisers! Are #WOO bulls ready to maintain momentum above or not? Let's discuss the latest analysis of #WOO and see what's happening:
💎#WOO has recently broken above the resistance of its ascending channel, igniting bullish momentum and raising expectations for a potential rally toward higher price levels. However, the next move will depend heavily on the $0.34-0.37 supply zone, a critical barrier that traders must closely monitor.
💎If #WOO can decisively break above $0.34, it would confirm a continuation of the bullish breakout, opening the door for a run toward the major resistance zone between $0.63–$0.70. Such a move would likely attract fresh buying interest and signal the start of a stronger upward trend.
💎However, there’s still a risk of a pullback. If WOO fails to maintain momentum above $0.34, a retracement to the $0.2354–$0.2021 demand zone becomes likely. This zone will act as the key support area, and any dip into this level could provide a re-entry opportunity for bulls.
💎Should #WOO close a daily candle below the $0.2021 level, it would invalidate the bullish breakout entirely and confirm a bearish reversal. Such a move could trigger a deeper correction, with the price potentially revisiting the $0.15 region, reinforcing bearish sentiment and shaking out over-leveraged traders.
Stay focused, patient, and disciplined, Paradisers🥂
MyCryptoParadise
iFeel the success🌴

Is AUCTIONUSDT Gearing Up for a Massive Move? Don’t Miss This!Yello, Paradisers! Are you ready for what could be a critical moment for #AUCTIONUSDT? Here’s why this chart demands your attention right now.
💎After breaking its descending resistance trendline, #AUCTION has flashed a strong bullish signal. The price is now approaching the key demand zone at $16.70 to $15. If this area holds and we see bullish candle rejections, we could be gearing up for a strong continuation to the upside. This move could first target the minor resistance levels, with the potential to climb straight to the major resistance zone.
💎But beware of the downside risks. If AUCTION fails to rebound from the demand zone and breaks below it, the bullish scenario could unravel quickly. This would likely shift momentum downward toward the major support area at $12.50 to $11.
💎A rebound from this support zone and a reclaim of the demand zone would be essential to keep the bullish hopes alive. However, if the daily candle closes below $11, this would confirm a bearish trend, likely driving prices into deeper territory.
Play it safe, stay focused, and always trade like a pro. Only a few who master discipline will thrive in this game long-term. Let’s make sure you’re one of them.
MyCryptoParadise
iFeel the success🌴

Bitcoin- Very risky sell, or wait to buy at 85kLast week, Bitcoin came tantalizingly close to the significant milestone of $100,000 but fell just shy of breaching it. After this near miss, the cryptocurrency experienced a minor correction. Yesterday, Bitcoin tested the $100,000 level once again, only to retreat once more, indicating a persistent struggle to decisively break through this psychological barrier.
Like many traders, I am anticipating a more substantial correction in the near term. One potential strategy could involve selling around the $97,000 level, assuming Bitcoin retraces upward before a deeper pullback.
However, this is undeniably a high-risk trade for two reasons.
First, selling at this level goes against the prevailing bullish trend.
Second, with so many market participants eyeing a correction, there’s a risk that the anticipated move might not play out as expected.
A safer and potentially more rewarding approach could be to wait for a more pronounced correction, targeting a buy around the $85,000 level.
This strategy would align with expectations of a continuation of the broader upward trend, with Bitcoin eventually breaking past $100,000.
If the correction materializes, this level might offer a solid entry point to capitalize on the next leg of the rally.

Is HOOKUSDT Ready to Skyrocket or on the Verge of a Crash? Yello, Paradisers! Could #HOOKUSDT be gearing up for a major bullish breakout, or are we staring down the barrel of a steep drop? Let’s break down the key levels that could define the market’s next big move.
💎#HOOKUSDT has recently faced a strong rejection at the $0.6612 resistance level, a price point that has repeatedly acted as a significant barrier. While this rejection caused a temporary pullback, it doesn’t necessarily confirm a bearish trend. Instead, the action shifts to critical zones $0.5671 and $0.5293 which could determine whether we see a reversal or further decline.
💎The $0.5293 level aligns closely with the 0.5 Fibonacci retracement zone, often dubbed the “golden pocket.” Historically, this region serves as a pivotal area for price action. If HOOKUSDT stabilizes and consolidates here, it could act as the springboard for the next upward leg. Many traders are zeroing in on this area, anticipating a potential rally that could set the stage for new highs.
💎If the $0.5293 level doesn’t hold, the next support zone lies at $0.4512. A rebound at this lower demand zone could still preserve the bullish outlook, but a breakdown below $0.4512 would invalidate the setup entirely. Such a scenario could trigger a steeper decline, wiping out bullish sentiment and demanding traders exercise extreme caution.
It’s decision time, Paradisers. As the market flirts with these critical levels, patience and discipline will be your greatest allies. Wait for confirmations, whether you’re looking to ride the next breakout or hedge against a potential drop.
MyCryptoParadise
iFeel the success🌴

GRTUSDT Is a Bullish Breakout in Play—But Will It Hold?Yello, Paradisers! Is #GRTUSDT primed for a bullish surge, or could we face a pullback? Let’s analyze the key levels and scenarios.
💎#GRT has confirmed bullish momentum with a breakout above a crucial resistance level, which has now been retested as support. As long as the price respects this support area, the bullish continuation remains highly probable, with the next major resistance target in sight.
💎If the support level fails, GRT risks a fakeout scenario, potentially dropping toward the $0.1895 demand zone. This level is pivotal for maintaining bullish momentum. A rebound from this area would be critical for reclaiming support at $0.225, which is necessary to sustain the upward trajectory.
💎On the other hand, a bullish invalidation would be confirmed if GRT breaks below its Higher Low (HL) structure and closes below it on the daily chart. Such a move would signal a bearish continuation, opening the door to deeper price declines.
Patience and discipline are your strongest allies, Paradisers. Wait for clear confirmations, and trade with a strategy—not emotion. Stay focused and make every move count!
MyCryptoParadise
iFeel the success🌴

ENAUSDT Is the Bullish Flag About to Break or Collapse?Yello, Paradisers! Could this be the moment #ENAUSDT finally confirms its bullish flag breakout? Let’s dive into the critical levels and what they mean for ENA's next move.
💎#ENA is currently respecting its key support levels, forming a potential bullish flag pattern. If this breakout materializes, we could see ENA resuming its upward momentum, with the **major resistance zone** as the primary target. This is where the highest probability for a significant reaction lies.
💎However, if ENA fails to break the pattern, there’s a strong possibility it may revisit the $0.50 support zone or even drop toward the previous higher high at $0.462. This move could aim to collect liquidity for a potential rebound. If support holds, a bounce-back could push ENA upward, with another attempt to break the bullish flag pattern on the table.
💎That said, bullish invalidation comes into play if ENA closes below the demand zone on the daily timeframe. A daily close beneath this level would indicate a trend shift to bearish territory, paving the way for deeper downward movement.
🎖Paradisers, this is a moment to stay patient and let the market show its hand. Protect your capital and wait for confirmation before making your move. Consistency and discipline are your greatest trading tools!
MyCryptoParadise
iFeel the success🌴

RLCUSDT Critical Levels Ahead – Is a Big Move Coming?Yello, Paradisers! Is #RLCUSDT ready for a breakout, or is a pullback on the way? Here’s what to watch:
💎If #RLC successfully breaks above the key resistance at 1.835, we could be looking at a strong bullish move. The optimal approach here is to wait for confirmation of the breakout before entering the market. If this level holds and momentum builds, we could see a significant upward move toward our target area.
💎However, if RLC fails to break this resistance and faces rejection, the price is likely to return to the strong support area as it continues its current consolidation phase. This could signal a sideways movement before any clear trend emerges.
💎The bullish outlook becomes invalidated if RLC breaks below the strong support level at 1.28. A breakdown here would indicate potential for further downside movement, leading to a deeper dip.
Stay patient and disciplined, and remember: successful trading relies on strategic entry points and risk management.
MyCryptoParadise
iFeel the success🌴

#WUSDT Ready For a Bullish Rally or Not? Key Levels to WatchYello, Paradisers! Is #Wormwhole primed for a bullish continuation after breaking its descending resistance, or will it struggle? Let’s dive into the latest analysis for #WUSDT:
💎#WUSD has officially broken out of its descending resistance, marking a pivotal moment in its price action. This breakout signals a potential shift in momentum, and the focus now shifts to the $0.34-$0.40 supply zone, which represents a major barrier for further upside. A decisive close above this zone could open the floodgates for a rally into the $0.70 major resistance area.
💎If bulls manage to push past the supply zone, WUSDT could see an explosive move higher. The breakout from the descending resistance, combined with increased buying pressure, sets the stage for a potential extended rally toward $0.70 and beyond. This move would confirm a strong trend reversal, attracting new buyers into the market.
💎On the downside, the $0.2583 support level and $0.2400-$0.2123 demand zone are critical levels to watch. If the price fails to sustain above these areas, it could invalidate the bullish structure and send the market back into bearish territory.
💎A daily close below $0.2123 would signal a bearish reversal, likely triggering a selloff toward $0.16 or even lower levels. The bulls must defend this zone at all costs to maintain the recent breakout momentum.
Stay focused, patient, and disciplined, Paradisers🥂
MyCryptoParadise
iFeel the success🌴

Can #CELO Bulls Maintain the Current Bullish Momentum Or Not? Yello, Paradisers! Is #CELOUSDT gearing up for a breakout or will we see a reversal? Let’s break down the current setup for #CELO and what it could mean for traders:
💎#CELO is showing a textbook cup-and-handle pattern on the daily timeframe, signaling a potential bullish continuation. Currently, the price is hovering around the $0.9437 level, with key resistance lying at the $1.10-$1.30 supply zone. A decisive breakout above this zone could spark a strong rally and attract fresh buyers into the market.
💎If #CELO clears the supply zone, the next target lies around the $1.80-$2.20 range, aligning with the measured move of this pattern. This breakout would confirm a major shift in market sentiment, signaling renewed strength for the bulls and marking a significant milestone for CELO’s recovery.
💎On the flip side, if the price fails to break above the supply zone, it could retest the support zone at $0.733. If the support zone also fails, such a move could trigger a selloff toward $0.58 demand zone, reinforcing bearish sentiment.
💎There should be a bounce from the demand zone. However, losing this level will transfer control to bears for a deeper retracement before any potential rebound.
Stay focused, patient, and disciplined, Paradisers🥂
MyCryptoParadise
iFeel the success🌴

Hedera | HBAR , ETF & ATS300% Gains and a Bright Future
Since our first signal, HBAR has pumped over 321%, spotlighting this promising asset. With the launch of its Asset Tokenization Studio (ATS) in Q3 2024, Hedera Hashgraph has positioned itself as a leader in the tokenization revolution. This enterprise grade platform streamlines the digitization of real-world assets, addressing the rising demand for secure, scalable, and compliant solutions in asset management and trading.
Hedera’s Tokenization Breakthrough
Tokenization transforms physical or financial assets into digital tokens on a blockchain, enabling fractional ownership. This makes high-value assets like real estate, bonds, and equities accessible to a broader investor base. By improving liquidity, tokenization democratizes investment opportunities.
Hedera’s ATS simplifies this process with an open source framework designed for regulatory compliance and enhanced functionality. Powered by the Hashgraph consensus algorithm, the platform delivers unparalleled efficiency with thousands of transactions per second. Features like on-chain metadata, role-based access controls, KYC compliance, and supply cap enforcement ensure security and adherence to regulations.
ATS also includes advanced tools like token locking and pause functionality to address legal and security needs. Its interoperability with Ethereum standards (e.g., ERC-1400) ensures compatibility with established ecosystems. Moreover, integration with wallets like **MetaMask** and Blade Wallet enhances accessibility for issuers and investors alike.
A Booming Tokenization Market
The tokenization market is growing at an explosive pace. By late 2024, over $13 billion worth of real-world assets (RWAs) had been tokenized, with private credit, U.S. Treasury debt, and commodities leading the charge. Industry giants like JP Morgan, BlackRock, and BNY Mellon are also heavily investing in this space.
With analysts projecting the tokenized asset market to reach $16 trillion by 2030, Hedera is expanding its reach. Beyond ATS, initiatives like DOVU leverage Hedera’s technology to tokenize carbon credits, promoting sustainability. RedSwan facilitates fractional ownership of commercial real estate, and **abrdn** utilizes Hedera to tokenize money market funds, creating opportunities for smaller investors.
Recent advancements include the Nairobi Securities Exchange (NSE) joining the Hedera Governing Council, signaling progress in Kenya’s capital markets. Additionally, **Archax**, a regulated digital asset exchange, uses Hedera’s infrastructure to bridge traditional finance with digital assets. Collaboration with the Linux Foundation’s open-source “Hiero” initiative further underscores Hedera’s commitment to innovation.
HBAR’s Rally and Market Position
HBAR has experienced a significant rally, climbing nearly 320% last month. This surge followed Canary Capital’s filing for an HBAR ETF with the US SEC. Hedera's current price is $ 0.19, it has increased +15% over the past 24 hours. Hedera's All Time High (ATH) of $ 0.56 was reached on 16 Sep 2021, and is currently -66% down
The current circulating supply of Hedera is 38.20 Billions coins, and the maximum supply of Hedera is 50.00 Billions.Hedera’s 24 hour trading volume is $ 767.81 Million, which is insane
With its focus on cutting-edge solutions like ATS and strategic partnerships, Hedera Hashgraph continues to solidify its place at the forefront of the tokenization revolution. This hidden gem remains one to watch in the evolving digital asset landscape.

Can #FETUSDT Bulls Sustain the Current Bullish Momentum or Not?Yello, Paradisers! Is #FETUSDT ready for a bullish continuation or might we see a pullback? Let's look at the latest analysis of #FetchAI:
💎#FET has recently broken above the resistance of its broadening wedge which has sparked optimism about a potential bullish continuation upward. But now, all eyes are on the $1.97 minor resistance level—a critical barrier that could define the next big move.
💎If $1.97 is decisively broken, it would signal a major trend reversal, paving the way for higher price targets and fueling renewed confidence in the market. This breakout would mark a pivotal shift in structure, likely drawing in new market participants and setting up FET for a stronger upward trajectory.
💎However, there’s a flip side. The rally is showing signs of stalling, and failure to conquer $1.97 could trigger a retracement to the $1.322 support level—a zone of critical importance that aligns with a previous major low. Should this support fail to hold, the next key demand zone lies at $1.088, a level that bulls cannot afford to lose.
💎If the price closes below $1.088 on the daily chart, it would invalidate the bullish outlook entirely. Such a move would confirm a bearish reversal, likely sending the market spiraling lower and reinforcing bearish sentiment as lower lows take shape.
Stay focused, patient, and disciplined, Paradisers🥂
MyCryptoParadise
iFeel the success🌴

SUI | Sui & Mysten LabThe price of Sui is $1.34 today with a 24hour trading volume of 1 billion dollar, SUI trading on multiple exchanges is live now and the startup has closed its public round recently on KuCoin and OKX
Investors who purchased the native token of the Layer 1 blockchain Sui in a public offering last month are seeing large returns now
Binance accounts for 63% of Sui's spot trading volume, Bybit 16.6%, OKX 10.6%, and KuCoin 7.3%
Sui is a layer one blockchain and smart contract platform designed from the bottom up to make digital asset ownership fast, private, secure, and accessible to everyone. Its object centric model, based on the Move programming language, enables parallel execution, sub-second finality, and rich on-chain assets. With horizontally scalable processing and storage, Sui supports a wide range of applications with unrivaled speed at low cost. Sui is a step-function advancement in blockchain and a platform on which creators and developers can build amazing, user-friendly experiences.
Mysten Labs, the original contributor to Sui, was founded by by former executives & lead architects of Meta’s Novi Research
the team responsible for Diem blockchain and Move programming language: Evan Cheng, Adeniyi Abiodun, Sam Blackshear, George Danezis...
Sui listings that came in the evening on a day when the FED's interest rate decision may have put pressure on the price so no fomo
it is necessary to wait for the price to accumulate in a certain range and not to act for fear of losing the opportunity

Kaspa / KAS ( 70X in 9 month )The price of Kaspa (KAS) is $0.011 today with a 24hour trading volume of 5 million dollar. This represents a 30% price increase in the last 24 hours and a 7000% price increase in the past 9 month..wait what?! that's exactly why you should be in crypto and find the next crypto gems.
Kaspa is a proof-of-work cryptocurrency which implements the GHOSTDAG protocol. Unlike traditional blockchains, GHOSTDAG does not orphan blocks created in parallel, rather allows them to coexist and orders them in consensus. Whereby our blockchain is actually a blockDAG; you can see GHOSTDAG in action in a real time blockDAG visualizer). This generalization of Nakamoto consensus allows for secure operation while maintaining very high block rates (currently one block per second, aiming for 10/sec, dreaming of 100/sec) and minuscule confirmation times dominated by internet latency (cf. chapter 6 of the the paper for some initial benchmarks). The Kaspa implementation includes a lot of cool features and subprotocols including Reachability to query the DAG's topology, Block data pruning (with near-future plans for block header pruning), SPV proofs, and later subnetwork support which will make future implementation of layer 2 solutions much easier.
as you see we can have a healthy correction and back to 0.010. if you made a good gain make sure taking some profit too

Is MYROUSDT Setting Up for a Bullish Breakout, or Is It a Trap?Yello, Paradisers! 🚨 Are you prepared for the potential bullish move on MYROUSDT?
💎MYROUSDT broke out of a key resistive trendline and is now consolidating. Within this consolidation phase, a W pattern appears to be forming.
💎If MYROUSDT breaks and closes above the resistant zone, this will validate the W pattern and significantly increase the likelihood of a strong bullish move. However, caution is essential! The broader market trend, especially BTC’s price action, will play a crucial role. If BTC shows signs of strength, it will further support our bullish bias. But if BTC starts turning bearish, it’s better to avoid this analysis.
💎On the flip side, if MYROUSDT breaks down and closes below the support zone, this would invalidate our bullish outlook completely.
🎖Always remember, Paradisers, disciplined trading and patience will set you apart from the crowd. Stick to your strategy and wait for the highest probability setups.
MyCryptoParadise
iFeel the success🌴
