Solana Breakdown Incoming? These Are Key Levels To WatchYello, Paradisers! Are you ready for the next major flush? After failing to gain momentum since the May double top breakdown, #SOL is now showing even more bearish signs, and the market might be about to punish late bulls one more time.
💎Following the confirmed double top in May, SOL has struggled to reclaim any upside momentum. Now, on the 12-hour chart, a classic head and shoulders formation is emerging, a pattern that often precedes larger trend reversals when the neckline breaks.
💎#SOLUSDT is hanging onto critical support between $142 and $140. This zone is the neckline, and it’s the last stand for bulls. If bears break it, we get a clear breakdown confirmation, with a clean path down toward $130–$127, which marks the first major demand area.
💎That initial support likely won’t hold for long. If pressure continues, SOL is expected to drop further toward the $115–$110 region. This is not just a technical support, it’s also the target area of the H&S formation, making it a magnet zone for price.
💎Adding to the bearish developments, a death cross has now been confirmed on the 12-hour chart. The EMA-50 has crossed below the EMA-200, reinforcing short-term downside pressure. Even if a relief bounce occurs, the $155 region, where the EMA-50 sits, will likely act as fresh resistance and attract renewed selling.
Paradisers, strive for consistency, not quick profits. Treat the market as a businessman, not as a gambler.
MyCryptoParadise
iFeel the success🌴
Cryptosignals

QNT Is Breaking Down — Are You ReadyYello Paradisers, Have you seen what just happened with #QNTUSDT? After weeks of grinding higher, the structure has cracked and that crack could turn into a landslide if you're not ready. This isn’t the time for hope or guesswork. It's the time for strategy.
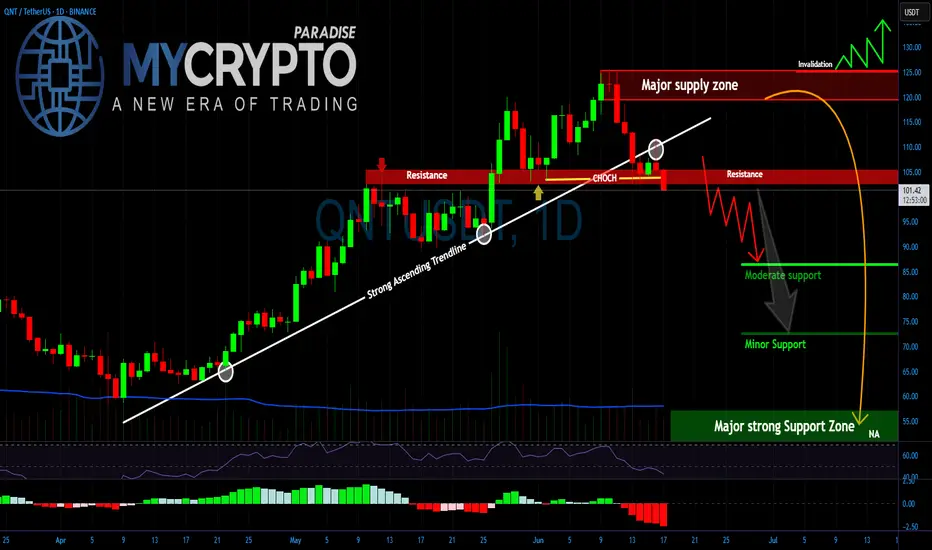
💎#Quant has broken below a major ascending trendline that’s held since April, marking a pivotal shift in its momentum. The market just printed a clean Change of Character (CHoCH) around the $105–106 level, right at the confluence of a key support-turned-resistance zone. That CHoCH level, once a strong foundation for bullish continuation, has now flipped into a headwind. As long as the price stays below this range, we remain in the danger zone.
💎 Adding fuel to the fire is the major supply zone looming above, from $122 to $128. This area has already triggered rejection in the past and will now serve as the final invalidation for any short-term bullish dreams. A reclaim of this zone is highly unlikely in the near term, given the structure and momentum.
💎Now with the trendline cleanly broken and the market unable to hold higher lows, all eyes are on the lower support zones. The $85 region may provide a temporary cushion, but the real magnet lies deeper. We are closely watching the $72–75 area for signs of temporary relief, but the main high-probability reaccumulation zone is sitting all the way down at $55–60. This zone will likely attract smart money accumulation if the market gets there, it will not be by accident.
💎 This isn’t the time to be catching falling knives. Unless #QNT can reclaim the broken trendline and push back above the $106–110 range with conviction, the path of least resistance is down. That also means every lower high that prints now is an opportunity for trained eyes.
Stay ready. Stay focused. And always play the long-term game like a pro.
MyCryptoParadise
iFeel the success🌴
MACD Divergence Flashing Red, Could This Trigger a -30% Crash?Hey Realistic Traders!
Bearish Reversal Signal Flashing on BINANCE:ETHUSDT , Is the Bull Run Over?
Let’s Break It Down..
On the daily timeframe, Solana (SOL) has formed an ascending broadening wedge, which has now broken to the downside through both the lower trendline and a major support zone, indicating a shift in market structure.
Price action has also remained consistently below the 200-day EMA, signaling a potential transition from a bullish to a bearish trend.
A bearish divergence has appeared on the MACD indicator, where price makes higher highs while the MACD forms lower highs. This divergence indicates that buying momentum is weakening, even as the price pushes higher. Such a pattern often precedes a trend reversal and supports the expectation that the price may continue to move lower.
Given these technical signals, the price is likely to continue moving lower toward the first target at 1849.07, with a possible extension to the second target at 1534.44.
This bearish outlook remains valid as long as the price stays below the stop-loss level, currently marked at 2734.40. A move above this level would invalidate the bearish setup.
Support the channel by engaging with the content, using the rocket button, and sharing your opinions in the comments below.
Disclaimer: "Please note that this analysis is solely for educational purposes and should not be considered a recommendation to take a long or short position on ETHUSDT.

BITCOIN (BTCUSD): Strong Bullish Confirmation?!
Bitcoin has a high chance to rise more, following
a strong bullish reaction to a rising trend line on a 4H.
Goal - 108000
❤️Please, support my work with like, thank you!❤️

0x0 About to Explode? A Bullish Reversal No One Is Talking AboutYello, Paradisers! Are you watching this breakout on #0x0? Because if you blink, you might miss the start of a major trend reversal that’s been quietly forming for months.
💎After a prolonged downtrend, 0x0 is finally showing signs of life. The price has completed a multi-month bottoming structure, forming a textbook inverse head and shoulders, a classic reversal signal that is known for its reversal strength.
💎Currently, 0x0 is starting to push through a critical zone between 0.1080 and 0.1180, a region that previously acted as strong resistance. This zone also aligns perfectly with the neckline of the inverse head and shoulders and is now being flipped into support — a bullish development.
💎Even more importantly, price is now breaking above the EMA-200, a long-term trend indicator that often marks the transition from bearish to bullish sentiment. This EMA break gives even more credibility to the reversal setup.
💎For #0x0USDT the descending resistance at $0.1500 is the next key level. A confirmed breakout above this level would signal a shift from bullish to aggressively bullish, opening the door for a quick push towards the initial target at $0.1650, where moderate resistance is expected.
💎However, based on the strength of the current structure and the inverse head and shoulders pattern, 0x0 has the potential to rally much further, with the primary target sitting in the $0.21 to $0.23 range. This target zone also aligns with the 50% Fibonacci retracement of the full downtrend, making it a highly probable magnet for price if momentum accelerates.
Paradisers, strive for consistency, not quick profits. Treat the market as a businessman, not as a gambler.
MyCryptoParadise
iFeel the success🌴

Is #ARB Ready For a Recovery or will it continue to Fall? Yello Paradisers! Are you watching #ARBUSDT closely or not? Let's look at the latest #Arbitrum trading setup and what could be next for it:
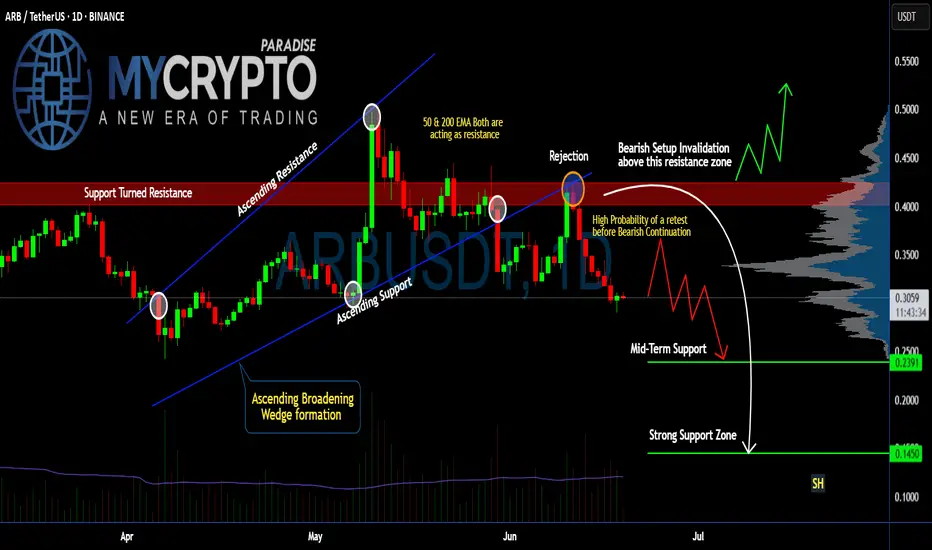
💎#ARB just completed a breakdown from an Ascending Broadening Wedge. This breakdown has made the previous support into the resistance after the price rejection. Currently, there is a high probability that #ARBUSD might do a retest before continuing downward.
💎After the wedge breakdown, price got rejected hard from the $0.39–$0.42 resistance zone, where both the 50 EMA and 200 EMA are now stacked against the bulls, acting as strong dynamic resistances. This confluence of resistance increases the probability that this level won't be reclaimed easily. The setup is clearly bearish unless invalidated above $0.42.
💎We’re seeing a lack of follow-through on the bounces, which signals hesitation and likely a trap for late buyers. As long as we remain below the resistance block, the next logical move is a retest of mid-term support at $0.2391.
💎But it doesn't stop there. If this mid-level gives in — and the structure suggests it might — the next area to watch is the $0.1450 zone, a strong historical support and the first place we expect real buyers to step in. This could be the level where a high-probability reversal finally sets up.
Trade smart, Paradisers. This setup will reward only the disciplined.
MyCryptoParadise
iFeel the success🌴
SEI Rebound or Final Trap?Yello Paradisers, have you considered that this little bounce might be the last trap before a brutal selloff? SEIUSDT is giving us strong signals that most retail traders are missing and if you’re not reading the structure clearly, you’re walking straight into a setup designed to clean you out.
💎The recent price action shows a clear rejection from the $0.22 level, which has now confirmed itself as a strong resistance zone. What’s more concerning is that this resistance rejection comes right after the price broke down from an Ascending Broadening Wedge. This is not a random pattern it’s a classic formation that tends to attract breakout buyers and then punishes them with aggressive downside moves once the structure fails.
💎Currently, the market is drifting just below that resistance, attempting weak bounces. However, there is a clear lack of bullish momentum. If this weakness persists, the next stop is around the $0.16 region, where moderate support is likely to be tested.
💎If sellers get aggressive, that level might not hold, and we could head lower into the $0.13 area still not where true value lies. The major support zone sits far below, around the psychological $0.10 level, and that’s where the real high-probability bounce setup is likely to occur.
MyCryptoParadise
iFeel the success🌴

Is #ETC Ready For a Breakdown or Will it Recover From Here? Yello Paradisers! Have you checked what’s unfolding on #ETCUSDT lately? Let's look at the latest moves of #EthereumClassic:
💎#ETC has been trading inside a descending triangle for weeks, and once again, it failed to break above its strong descending resistance line, with the 50 & 200 EMAs acting as a dynamic ceiling on every rally attempt. These two indicators are stacking against the bulls, reinforcing the overhead pressure and keeping ETC pinned below key resistance levels.
💎The red zone between $18.60 and $19.20 has been acting as a strong resistance area and that’s exactly where the last bounce got rejected. The setup is clear: as long as price remains below this red supply zone, any short-term bullish case is invalidated. Each rejection here only fuels further downside conviction.
💎Unless we see a high-volume breakout and hold above $19.20, the structure remains extremely vulnerable. This is the invalidation level for the bearish thesis. If bulls can't flip that, the current pattern suggests continuation to the downside.
💎#ETCUSD is currently hovering around $16.50, with short-term bounces being aggressively absorbed. The mid-term support zone around $12.49 is likely the first magnet for price, but don’t get too comfortable there. The real target lies deeper: the strong support zone around $10.78 is shaping up to be the key smart money reaccumulation area if the selling intensifies. This is where real interest may return—but only after retail gets flushed.
Trade smart, Paradisers. This setup will reward only the disciplined.
MyCryptoParadise
iFeel the success🌴

Head & Shoulders Breakdown in Progress, Eyes on 1.83 and 1.61XRP is showing a classic Head and Shoulders reversal pattern, which has now broken down below the neckline, indicating a potential bearish continuation.
🔻 Bearish Structure Highlights:
The head and shoulders formation is well-defined and price has confirmed a neckline break.
The breakout is occurring within a descending channel, aligning with the broader bearish context.
Momentum oscillator (DTosc) is also turning down after a lower high, supporting the bearish case.
📉 Targets:
First target: 1.83580
Extended target: 1.61184
🔴 Invalidation Zone:
A daily close above the right shoulder and key resistance at 2.3589–2.4829 would invalidate this bearish view and signal potential reversal.
📌 Trade Plan:
Favoring short setups below the neckline
Targeting the support levels noted above
Stop-loss suggested above 2.48 for conservative risk control
The setup offers a clean risk/reward opportunity based on a textbook bearish reversal pattern.

IOTA Is Showing a Dangerous Pattern! Don't Ignore This SignalYello, Paradisers! Are you watching what’s forming beneath the surface of #IOTA’s slow drift? While the market sleeps on this coin, a dangerous structure is developing, and if this key support breaks, we could see a fast and painful selloff few are prepared for.
💎After months of low momentum, IOTA is now beginning to show signs of a head and shoulders pattern, a classic bearish reversal formation. This is a structure which cant be ignored, especially not at this stage of the market.
💎#IOTAUSDT neckline support lies between $0.1600 and $0.1500, a range that bulls have barely managed to defend over the past several weeks. If this zone breaks, the confirmation will be triggered and sellers will likely dominate, pushing price lower in a decisive move.
💎The first downside target sits at $0.1350, where moderate support exists. However, this level may not be strong enough to absorb selling pressure if the market sentiment remains weak.
💎If sellers manage to breach $0.1350, expect an accelerated move toward $0.1130–$0.1030. This deeper zone represents major structural support, where a stronger bullish reaction could finally take place.
Paradisers, strive for consistency, not quick profits. Treat the market as a businessman, not as a gambler.
MyCryptoParadise
iFeel the success🌴

WLD Sparks Panic Here’s Why the Worst Might Still Be AheadYello Paradisers, have you seen how #WLDUSDT just collapsed out of nowhere? After weeks of slow, grinding price action inside a dangerous ascending broadening wedge, #Worldcoin has finally snapped, and this breakdown could be the start of something much bigger.
💎We had this move on the radar well in advance, as the structure continued maturing. The wedge was perfectly defined by rising support and resistance levels, and price got smacked down with precision from the top of that range. When #WLD printed a clear Change of Character (CHOCH), breaking beneath the wedge’s lower boundary, it wasn’t noise it was a direct signal of weakening momentum and a confirmed shift in market structure toward the downside.
💎What followed was a textbook retest of the breakdown level, which now aligns with a powerful supply and resistance zone between $1.069 and $1.125. As long as the price remains trapped below this zone, the bearish momentum stays in full control. Right now, the next area we’re eyeing is $0.847, where price might see a temporary pause. But make no mistake if the selling continues, #WLD is likely heading toward $0.580, and in the most extended bearish case, we’re watching the major support base at $0.347.
💎Any invalidation of this bearish setup would require a full breakout above $1.623, but with the current market structure, that kind of reversal seems extremely unlikely without a strong macro or fundamental catalyst flipping the narrative.
Trade smart, Paradisers. This setup will reward only the disciplined.
MyCryptoParadise
iFeel the success🌴

ADAUSDT Is Warming Up for a Major MoveYello, Paradisers! Did you notice what just happened on ADAUSDT? After sweeping liquidity, the pair has now printed a bullish internal change of character (I-CHoCH), confirmed by bullish divergence. This confluence significantly increases the probability of a bullish move from here—but only if you play it smart.
💎From the current price levels, the risk-to-reward ratio isn’t the most attractive for conservative entries. Aggressive traders might still consider taking a position with a tighter invalidation, but the trade needs to be managed with precision.
💎For those who prefer safer setups, it’s much wiser to wait for a pullback into the key support zone. A confirmed retest from there could offer a much cleaner risk-to-reward structure and a clearly defined invalidation level.
💎However, if the price breaks down and closes below that invalidation level, this entire bullish setup becomes invalid. In that case, it's best to stay patient and wait for a new structure to form before jumping back in. Entering too early in uncertain territory can turn a high-probability setup into a costly mistake.
🎖Strive for consistency, not quick profits. Treat the market as a professional, not a gambler. Discipline and timing are what separate the winners from the crowd. Be patient, wait for the high-quality trades, and execute with confidence. That’s how long-term success is built in this game.
MyCryptoParadise
iFeel the success🌴

TRBUSDT on the Verge of a Major Move – Breakout or Breakdown?Yello, Paradisers! Is TRBUSDT gearing up for a bullish breakout, or is a deeper retracement coming? Let’s break it down.
💎TRBUSDT is forming an ending diagonal while showing bullish divergence, increasing the probability of an upward move. But for this bullish scenario to play out, we need confirmation.
💎If TRBUSDT breaks out and closes candle above the resistance level, the probability of a bullish move strengthens, setting up a potential wave 4.
💎However, if the price retraces further, we could still see a bounce, but given the broader market conditions, this would be a low-probability setup.
💎On the flip side, a breakdown and candle close below support would invalidate the bullish outlook, signaling that it’s safer to wait for a better price action structure before taking any positions.
🎖Remember, patience and disciplined execution are what separate winners from the rest. Stay sharp, Paradisers, and don’t let emotions dictate your trades!
MyCryptoParadise
iFeel the success🌴

Last Chance to Catch AAVE Before Liftoff! Retest Almost CompleteYello, Paradisers! Are you ready to catch the next big mover before the herd wakes up? #AAVE is now setting the stage for a potentially explosive move, and this retest might be the last stop before liftoff!
💎After forming the low of the inverse head and shoulders, AAVE has been riding an ascending channel, a structure that usually supports sustained bullish trends. Recently, price broke through the neckline of that pattern and is now retesting it, offering us a textbook technical setup.
💎#AAVEUSDT has been holding the neckline supports strongly at $275 to $265 levels. This is the critical area to watch. If bulls successfully defend this zone, we could see price push back up toward $310, which aligns with the midline of the ascending channel and represents the first resistance.
💎If momentum carries through and that level is cleared, AAVE has open skies toward the $370–$400 range. That’s the 52-week high zone, and it coincides with the top of the channel, making it a magnet for price if bullish momentum continues.
💎Adding to the bullish momentum, the EMA-50 and EMA-200 have just formed a golden cross. This alignment often leads to sustained upward moves, especially when backed by a strong structure like the ascending channel we're in now.
Paradisers, strive for consistency, not quick profits. Treat the market as a businessman, not as a gambler.
MyCryptoParadise
iFeel the success🌴

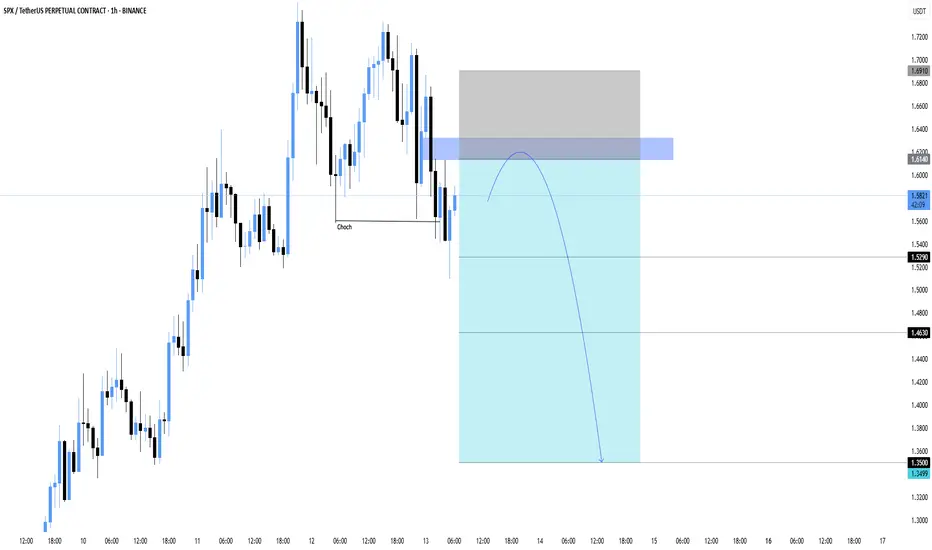
SPX/USDT — Change of Character Signals Bearish Move Incoming The structure has shifted with a clear CHoCH (Change of Character), suggesting that bullish momentum is weakening. Price recently pulled back into a supply zone around 1.6140–1.6910, setting up a potential short opportunity.
🔍 Technical Breakdown:
Price broke below recent higher low = CHoCH confirmed
Bearish BOS followed by retracement into premium zone (FVG/Supply)
Expecting rejection and continuation to downside if price fails to reclaim 1.6140
🔧 Trade Plan:
Entry Area: 1.6140
Stoploss: Above 1.6910
Targets:
• TP1: 1.5290
• TP2: 1.4630
• TP3: 1.3500
This setup aligns with internal structure + supply zone + CHoCH. Wait for confirmation candle or bearish engulfing in entry area before executing.
#TRX Ready for a Recovery or Another Fall Ahead? Key LevelsYello Paradisers! Are you watching the #Tron's recent moves in the market? Let's look at the latest setup of #TRXUSDT to see what could be the next move:
💎After forming a textbook Ascending Channel over the past few months, #TRX just got rejected hard from the upper boundary near the $0.29–$0.30 zone. That rejection didn’t just happen anywhere—it came right at the major resistance zone, which has acted as a key reversal point since early May. This kind of rejection, especially after multiple touchpoints, isn't just noise—it's a sign of momentum exhaustion at the top.
💎From an Elliott Wave perspective, it’s very likely that the first major impulse wave (Wave 1) has just been completed with this recent peak, and what comes next could be the start of Wave 2—a corrective phase that typically retraces deep and fast before the market resumes its larger trend. That means any weakness below the channel support could mark the beginning of a more prolonged decline, trapping breakout buyers and squeezing late longs out of their positions.
💎Price is now hovering dangerously close to the lower boundary of the channel, trading at $0.274 at the time of writing. This is where things start to get interesting. A decisive breakdown from this ascending support would not only confirm a bearish structural shift but would also trigger a cascade effect—invalidating the bullish channel and opening the door for a larger move to the downside.
💎If that breakdown plays out, the first meaningful support sits at the $0.2433 level. But that’s just the beginning. The next major demand lies down around $0.2259—a level loaded with historical volume and likely to attract strong buying interest. Until then, any small bounce is just noise in what could become a significant trend reversal.
Trade smart, Paradisers. This setup will reward only the disciplined.
MyCryptoParadise
iFeel the success🌴

BITCOIN (BTCUSD): Pullback From Support
Bitcoin nicely respected a key horizontal support.
A breakout of a resistance line of a falling wedge pattern
provides a strong bullish confirmation.
I think that the price will go up and reach at least 108.320 level.
❤️Please, support my work with like, thank you!❤️

Is AAVE About to Explode Above or Collapse? Key Levels to WatchYello Paradisers! Is #AAVE quietly prepping for a major breakout… or is this just another setup to wipe out the impatient bulls before the real move begins?
💎#AAVEUSDT is moving in a textbook ascending channel, respecting both trendline resistance and support beautifully. The structure is clean, but deceptive. While many may assume this is an easy path higher, seasoned traders know better — especially with what’s happening near the critical resistance zone.
💎The red resistance zone ($270–$280) that was previously a major support during the last cycle is now acting as heavy resistance again. #AAVEUSD is currently battling this zone after several failed attempts to break through. But the structure still leans bullish as long as we stay within the ascending channel.
💎Both the 50 & 200 EMA are now acting as dynamic support. This is key — if the price remains above these EMAs and the lower channel boundary, momentum favors the bulls. A decisive breakout above $280 could trigger a parabolic rally toward the $375–$410 range, a level where serious resistance and profit-taking are expected.
💎However… if bulls get lazy and we see a strong breakdown below the ascending channel, especially below $237, the setup gets shaky fast. A complete invalidation of the bullish case occurs if AAVE loses $209 — from there, expect a breakdown structure to unfold with a likely test of much lower levels and a possible retest of the $150 zone.
Trade smart, Paradisers. This setup will reward only the disciplined.
MyCryptoParadise
iFeel the success🌴

GT Protocol ($GTAI) | Breakout Loading? +500% Potential! (READ)By analyzing the #GTProtocol chart on the daily (logarithmic) timeframe, we can see that the price was forming a solid base between $0.12 and $0.15. Currently trading around $0.17, the chart structure remains bullish and primed for a potential breakout. Momentum is gradually building, and I expect the price to soon test the $0.185 level, followed by short-term targets at $0.20, $0.24, and $0.266.
In the long run, my bullish bias remains firm with targets at $0.37, $0.45, and a psychological milestone of $1.00, representing a potential upside of over 500% from current levels!
Fundamental Drivers Supporting the Move
• Tokenomics: Recent unlocks have distributed supply more evenly, easing early-seller pressure and improving liquidity dynamics.
• Utility & Adoption: As a Web3 AI-execution layer, GT Protocol is expanding its real-world use cases with new partnerships and integrations.
• Narrative Strength: Positioned as a leading AI narrative for 2024, $GTAI is gaining traction amid rising AI sector demand.
Sentiment & On-chain Signals
• Community Hype: Activity on X (Twitter) and Telegram is surging, with bullish sentiment dominating conversations since the recent breakout attempt.
• Social Volume: A spike in daily mentions suggests increasing retail attention—often a precursor to strong moves.
• Whale Accumulation: Smart money has been seen accumulating below current levels—an early sign of confidence in the next leg up.
With both the technical setup and fundamentals aligning, $GTAI looks ready for an explosive run. Keep it on your radar!
Please support me with your likes and comments to motivate me to share more analysis with you and share your opinion about the possible trend of this chart with me !
Best Regards , Arman Shaban

AAVE Breaks Major Resistance Is a Mega Rally Toward $460 on the Yello Paradisers, are you watching how #AAVEUSDT just exploded past its resistance zone? After weeks of slowly grinding upward inside a clean ascending channel, AAVEUSDT has just delivered a powerful breakout that could open the gates for a major continuation to the upside.
💎This breakout came with strength supported by strong green candles blasting through the previously established resistance zone near $280. The price decisively reclaimed this area, which has now flipped into a fresh support zone. As long as AAVE holds above this reclaimed region, the bullish momentum remains dominant and the probability of continuation grows significantly.
💎From a structural standpoint, #AAVE had been respecting a well defined ascending channel with rising support and resistance levels. Each pullback within the channel has been met with renewed demand, indicating strong market interest at every dip. The recent consolidation at resistance, followed by the aggressive breakout, confirms that the bulls are in control at least for now.
💎Looking ahead, the next visible target is the minor resistance at $357, followed by $380 and ultimately, the major supply zone between $460 and $470. These areas could act as points of reaction, but with momentum on AAVE’s side, the path upward remains technically cleanespecially if volume sustains.
💎On the downside, the invalidation of this bullish structure would come with a sharp drop below the key demand zone at $220. A breakdown below this level would shift the narrative and signal deeper corrective action, potentially opening the path toward the invalidation zone at $170.
Trade smart, Paradisers. This setup will reward only the disciplined.
MyCryptoParadise
iFeel the success🌴

CPOOL Is Winding Up for a Major Breakout! Key Levels to WatchYello, Paradisers! have you noticed how CPOOL has been quietly coiling for over three months without much noise?
💎After a prolonged downside, CPOOL is now completing a textbook 100-day accumulation band, which is historically the perfect springboard for a major trend reversal. Let’s break down why the next move could be explosive:
💎CPOOL is now facing a multi-month descending resistance at $0.165. This level is critical. A breakout here would likely trigger a strong push toward the top of the accumulation range, between $0.183 and $0.205. That’s the real test for the bulls, if they clear it, the upside opens up fast.
💎Above this zone, the next big target is $0.28 to $0.30, which lines up with the 50% Fibonacci retracement and is a strong resistance level. This is where caution is advised.
💎What makes this setup even more interesting is how fast CPOOL’s dynamic levels are tightening. That’s a classic sign of a volatility squeeze, the kind that usually leads to explosive moves. On the downside, $0.12 offers initial moderate support, but the real foundation sits between $0.100 and $0.095, where price has bounced hard three times since March.
Paradisers, strive for consistency, not quick profits. Treat the market as a businessman, not as a gambler.
MyCryptoParadise
iFeel the success🌴

Phemex Analysis #88: Pro Tips for Trading Aave (AAVE)Aave ( PHEMEX:AAVEUSDT.P ), a leading decentralized lending protocol and one of the standout Layer 1 tokens, has attracted substantial trader interest recently by demonstrating remarkable resilience. Impressively, AAVE bounced back by approximately 100% from its recent low of $113 on April 7. Adding to this optimism, AAVE broke through a significant resistance at $282 just yesterday, potentially signaling a bullish continuation.
However, traders must proceed with caution, as this recent upward breakout was accompanied by relatively lower trading volume and a weaker Relative Strength Index (RSI) compared to the previous bullish surge seen on May 27. These factors introduce uncertainty into AAVE’s near-term trajectory, prompting the need for careful evaluation of possible scenarios over the next few days.
Possible Scenarios
1. Continued Bullish Momentum
Despite the RSI divergence observed during this latest peak, AAVE may continue its upward momentum, driven by sustained investor enthusiasm and broader market conditions. Traders should closely monitor price action around immediate resistance levels for short-term profit opportunities.
Pro Tips:
Profit Taking: Consider locking in short-term gains as AAVE approaches significant resistance areas, particularly at around $333 and subsequently at $370.
Risk Management: Set protective stop-loss orders below the recent support at $250 to limit potential losses in case market sentiment shifts suddenly.
2. Limited Rise Followed by Sharp Rejection
Another plausible scenario involves AAVE rising moderately higher but facing strong selling pressure near critical resistance levels, such as $300 and $333. A rejection at these levels could trigger a sharp corrective move, particularly if accompanied by increased selling volume.
Pro Tips:
Cautious Entries: Be cautious about initiating long positions near these resistance zones. Instead, wait for clear signals or confirmations before entering.
Short Opportunities: Experienced traders could potentially capitalize on short-selling opportunities if strong rejection signals manifest at these resistance levels.
3. Retest of Lower Support Levels
Given the relatively weak volume accompanying the recent breakout, there is a potential third scenario in which AAVE retests lower support areas. A pullback towards previously broken resistance (now support) at around $282, or even further down to around $250 & $238, might occur as the market tests buyer strength.
Pro Tips:
Observe Volume: Pay close attention to trading volumes if prices decline. Low-volume pullbacks could present good accumulation opportunities at support levels.
Accumulation Strategy: Consider cautiously accumulating positions near $250 or $238 only after clear signs of price stabilization and potential reversal appear.
Conclusion
While Aave (AAVE) showcases impressive strength and investor confidence, the current RSI divergence and volume trends suggest caution. By closely monitoring the outlined scenarios and implementing disciplined risk management strategies, traders can better navigate the uncertainty and volatility surrounding AAVE’s current market conditions.
🔥 Tips:
Break free from "buy low, sell high"! Our new Pilot Contract empowers you to profit from ANY market direction on DEX coins with up to 3x leverage. Go long, go short, go further!
Check out Phemex - Pilot Contract today!
Disclaimer: This is NOT financial or investment advice. Please conduct your own research (DYOR). Phemex is not responsible, directly or indirectly, for any damage or loss incurred or claimed to be caused by or in association with the use of or reliance on any content, goods, or services mentioned in this article.

Doge Meme Coin daily demand level is playing out wellThe strong daily demand imbalance mentioned in a previous update is still in control and trying to play out as expected. Any long positions on this meme coin should be managed.
