RENDER Is $1.366 the Next Stop Before a Major Market Reversal?Yello Paradisers! Are you prepared for the drop that could clean out both bulls and bears before the real move begins? Or will you be caught in another trap?
💎#RENDERUSDT has broken down from its ascending channel. This confirms that bullish momentum has faded, and the structure no longer supports higher prices.
💎The price is now trading below both the 50 EMA and 200 EMA on the daily timeframe. These are key trend indicators. Losing them shifts the bias to the downside. After rejection from the $5.00–$5.40 supply zone, the market failed to make a new high. That area remains strong resistance. Bulls must reclaim it to regain control.
💎Previous support around $4.00 has now turned into resistance. As long as price stays below this zone, lower targets remain in play.The next support is around $2.46, but that may only offer temporary relief. The real demand zone sits near $1.366, where stronger buying interest is expected.
💎Tether dominance (USDT.D) is showing early signs of risk-off behavior. It has reclaimed the 21, 50, and is now testing the 200 EMA at 4.88%. This suggests capital is rotating out of altcoins and into stablecoins.This shift is backed by rising volume. It's not retail noise it’s institutional positioning. The market is preparing for a deeper correction.
Stay disciplined. The next big opportunity will come to those who wait not those who chase.
MyCryptoParadise
iFeel the success🌴
Cryptosignals

TON Looks Ready to Collapse — Is This the Start of a Bull Trap?Yello Paradisers! what if TON is about to reverse hard—are you positioned correctly, or will you be caught chasing the wrong move?
💎TONUSDT is showing clear bearish signs that can’t be ignored. The price has broken down from an ascending channel—a classic early signal of weakness. But that’s not all. This breakdown happened right at the resistance zone, and it’s backed by a clear bearish divergence on momentum indicators. Adding to the conviction, there’s a 1H Fair Value Gap (FVG) sitting right in that same region, which often acts as a magnet for price before continuation to the downside.
💎This confluence significantly increases the probability of a bearish move in the short term. So, what’s the plan?
💎For risk-averse (safe) traders, the optimal approach is to wait for a pullback and retest of the broken structure. This allows for a cleaner entry and a much better risk-to-reward (RR) ratio. For the aggressive players, there’s potential to enter with reduced size from the current level, understanding that it carries more risk without confirmation.
💎However, if the price manages to break out and closes candle above the resistance zone, this entire bearish setup becomes invalidated. In that case, the smart play is to stay patient and wait for a more favorable structure or price action to develop.
🎖If you want to be consistently profitable, you need to be extremely patient and always wait only for the best, highest probability trading opportunities.
MyCryptoParadise
iFeel the success🌴

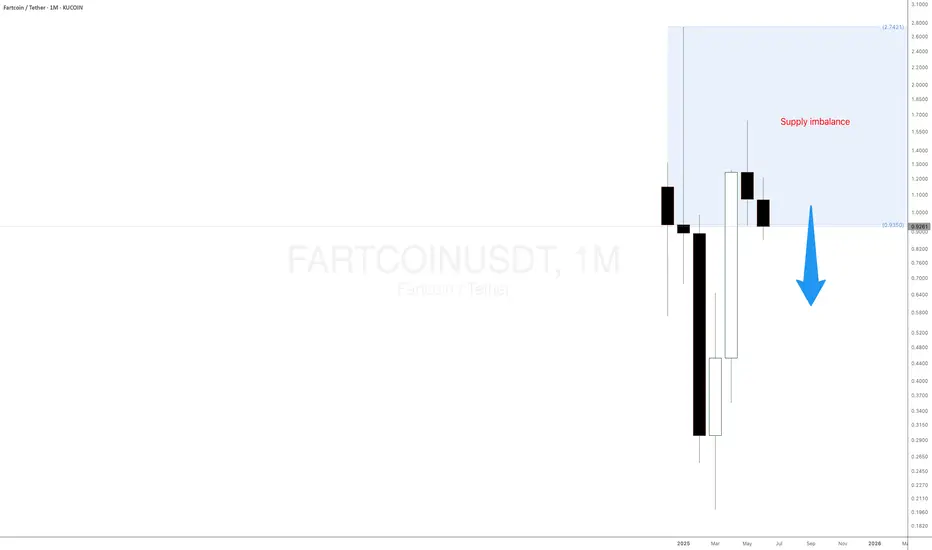
Is Fartcoin Meme Coin About to Crash Hard?In the ever-evolving world of crypto investment, memecoins continue to attract waves of speculative interest, even as their real-world use remains effectively nonexistent. One such meme coin token that’s recently caught the attention of traders and meme enthusiasts alike is Fartcoin—a cryptocurrency as ridiculous as its name implies. While Fartcoin may not be suitable for serious applications, it presents a fascinating case study in how to trade memecoins based purely on supply and demand imbalances.
The Origins of Fartcoin
Fartcoin emerged, predictably, as a joke. Like most memecoins, it was born not out of innovation but out of internet culture. Designed with no technical edge, no roadmap, and no ecosystem, its primary function is virality—riding the waves of social media hype and influencer shills. Fartcoin’s creators never intended it to disrupt finance or decentralize the web; they just wanted to make people laugh (and perhaps get rich in the process).
Yet, despite the lack of fundamentals, Fartcoin gained traction, thanks to Twitter and X memes, Reddit threads, and YouTube influencers who thrive on ironic tokens with humorous names. This is the bizarre paradox of memecoins and crypto investment: irrational exuberance often beats utility.
Why Fartcoin (Like All Memecoins) Can’t Be Used in Real Life
Let’s be clear—memecoins like Fartcoin offer no practical use. Unlike Bitcoin (store of value) or Ethereum (smart contract infrastructure), Fartcoin can’t pay for goods or services, nor does it solve any technological or economic problem. It exists solely for speculation.
Most real-world businesses won’t touch it. It lacks a stable price mechanism, a credible development team, and a long-term value proposition. In other words, Fartcoin is entirely unfit for real-life utility, making it a textbook example of a speculative asset detached from fundamentals.
Technical Analysis: Supply Level Suggests a Dump Is Imminent
While Fartcoin may lack intrinsic value, it offers opportunities for active traders who understand market psychology and how to trade cryptos. Currently, the price action reveals a notable supply imbalance around the $0.8982 level—a monthly supply zone that has acted as a key area of institutional selling pressure.
This level is currently “in control,” meaning buyers have consistently failed to push through this resistance. Price is now hovering close to this supply level, suggesting a high probability of rejection. For traders familiar with trading memecoins, this presents a prime opportunity to take short positions using futures contracts available on select cryptocurrency exchanges, such as Kucoin, Binance, and ByBit.
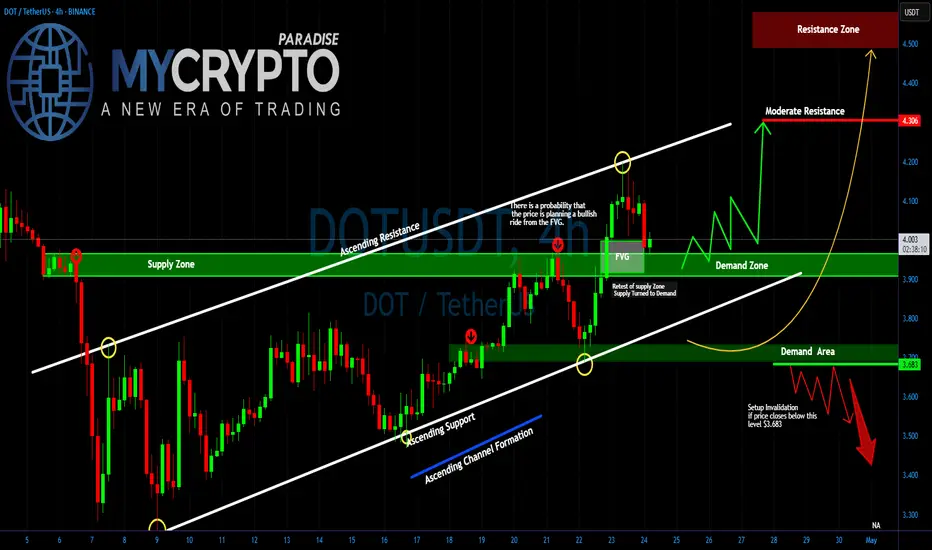
DOT/USDT About to Explode or Crash?Yello Paradisers! Are you ready for DOT's next explosive move, or will you be caught in the trap again? Right now, #DOTUSDT is sitting at a key decision point inside a textbook ascending channel — and what happens next could either print profits or wipe out the unprepared.
💎After respecting both the ascending resistance and support lines with high precision, it has now pulled back into a crucial area of interest: the Fair Value Gap (FVG). If DOT continues to hold above this level, the probability of a bullish continuation increases significantly. The area around $3.90–$3.95 is aligning perfectly with the demand zone, adding to the confluence and giving bulls a strong foundation to build on.
💎However, the real test lies ahead. POLKADOT must clear the immediate resistance around $4.10–$4.30 for the bullish momentum to gain traction. A successful break and retest of the $4.30 level would likely open the doors to a fast move toward the high-value resistance zone at $4.50 and above.
💎But here’s the twist: if DOT fails to defend the demand zone and instead closes below $3.683, the entire bullish setup becomes invalid. Such a breakdown could trigger a deeper correction, targeting the $3.40 region and possibly flushing out the overleveraged players in the process.
Stay focused, Paradisers. Be the hunter, not the hunted
MyCryptoParadise
iFeel the success🌴
Magic Eden’s ME Token Eyes Bounce After Trump Wallet VolatilityOn June 3, , Magic Eden ( BINANCE:MEUSDT ) announced a collaboration with a project called to launch a new" Trump Wallet "
This announcement triggered a + 35% price increase , pushing the price of ME Token to approximately $1.17 .
However, shortly afterward, members of the Trump family, including Donald Trump Jr. , denied any involvement with the wallet or the project.
This resulted in a -20% price drop due to shaken investor confidence .
-----------------------------
Let’s see how ME Token is doing on the 1-hour timeframe .
ME Token is trading in the Support zone($1.03-$0.96) near the 50_SMA(Daily) .
From the Elliott Wave theory perspective, ME Token seems to have completed the main wave 3 and is currently completing the main wave 4 .
I expect ME Token to rise to at least $1.146(+15%) .
Second Target: $1.237
Note: Stop Loss = $0.95
Please respect each other's ideas and express them politely if you agree or disagree.
Magic Eden Analyze (MEUSDT), 1-hour time frame.
Be sure to follow the updated ideas.
Do not forget to put a Stop loss for your positions (For every position you want to open).
Please follow your strategy and updates; this is just my Idea, and I will gladly see your ideas in this post.
Please do not forget the ✅' like '✅ button 🙏😊 & Share it with your friends; thanks, and Trade safe.

AVAX Bulls Walking into a Trap? Yello Paradisers, are we on the edge of a clean breakout or is AVAX setting up the perfect trap before flushing the late bulls?
💎#AVAXUSDT has recently broken above a critical resistance zone and is now attempting a retest. This move appears strong on the surface, but it sits at a dangerous pivot—one that could determine the short-term direction in the days ahead. The structure is unfolding within a clean ascending channel, with both resistance and support levels well respected. These rising boundaries give the breakout credibility, but they also highlight how vulnerable the setup is if key support levels fail.
💎Right now, the level that previously acted as resistance is being tested as support. This is the moment of truth. If the price continues to hold above this level with strength and volume, we’re likely in for a continuation toward the next resistance level around $22.40. But the real test for bulls will come at the $23.00 region, where heavy profit-taking and increased selling pressure are highly likely. That’s where the larger players will look to trap over-leveraged longs and reposition.
💎But this bullish outlook comes with a clear condition and it’s non-negotiable. If #AVAX fails to hold $21.00 and begins closing candles back inside the previous range, the move instantly loses its legitimacy. In that case, our focus turns to the strong demand zone between $20.20 and $20.40. A reaction from this area could still save the structure, offering a potential reload for a bounce. But if this level gives way, the entire bullish setup is invalidated and what was once a breakout turns into a confirmed bull trap.
Trade smart, Paradisers. This setup will reward only the disciplined.
MyCryptoParadise
iFeel the success🌴

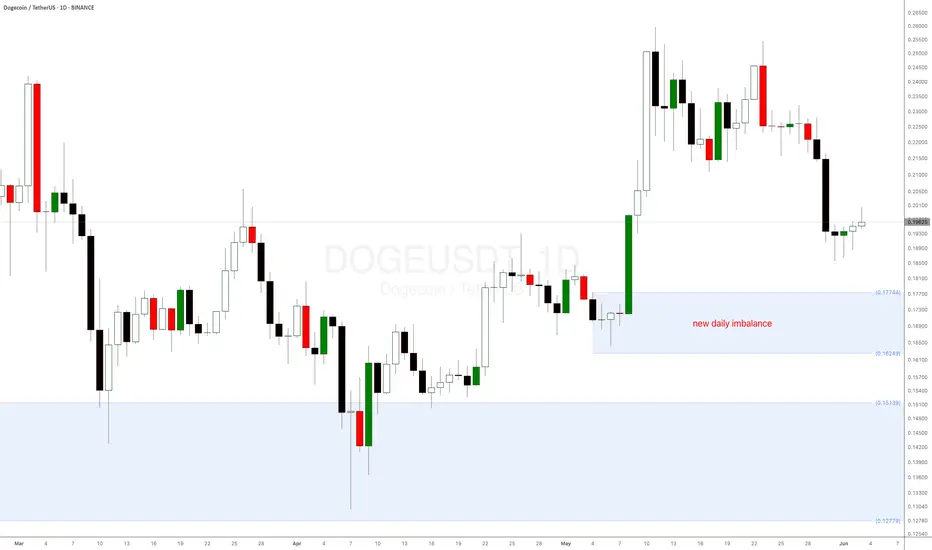
How to Spot the Perfect Dogecoin Buy Signal!Dogecoin (DOGE) is showing another major bullish signal!
After bouncing from the key weekly demand level at $0.151 mentioned in a previous supply and demand crypto analysis, DOGE coin is now approaching a new daily demand imbalance at $0.18035—a level where buyers have historically stepped in aggressively.
Why This Matters:
Strong Reaction Expected: Similar imbalances on other altcoins have led to sharp upward moves.
Long-term weekly imbalance: The weekly demand level is playing out very well.
Dogecoin (DOGE), the world’s favourite meme cryptocurrency, is trying to reach a critical weekly demand level at $0.151—its strongest daily demand zone in a long time! This presents a prime buying opportunity, especially for crypto beginners looking to enter the market.
Check the previous DOGE analysis from a few weeks ago.
TAOUSDT at a Crucial Level – Breakout or Breakdown?Yello, Paradisers! Is TAOUSDT gearing up for a strong bounce, or is a deeper correction on the horizon? Let’s break it down.
💎TAOUSDT has completed a healthy retracement, forming a descending channel alongside a Dragon Butterfly candlestick pattern—both backed by high volume. Historically, when this pattern appeared with strong volume, we saw a solid upside move. This time, we also have a bullish divergence, adding confluence to the bullish case. However, to increase the probability of a breakout, we need to see price breaking above the descending channel with strong volume.
💎Now, what if price drops further or shows panic selling? In that case, we must wait for clear bullish confirmations before jumping in. Ideal signals include - Bullish I-CHoCH formation, W pattern or Inverse Head and Shoulders on lower timeframes. Any of these would significantly increase the probability of a strong bounce from the strong support zone.
💎 However, If price closes a candle below the strong support zone, it will invalidate our bullish outlook. If that happens, the best move is to stay patient and wait for better price action before considering any long positions.
🎖Patience is what separates pros from amateurs. If you want to make it in this game, trade smart, stay disciplined, and always wait for high-probability setups. The market will always test your emotions—don’t let it break your strategy.
MyCryptoParadise
iFeel the success🌴

ETHEREUM Bearish Signal | Technical + Custom AlgoSmart Trend Signal | Technical Analysis + Custom Algorithm
This signal is the result of a combination of classic technical trend analysis and a proprietary software I personally developed.

Ripple is Approaching An Important ResistanceHey Traders, in today's trading session we are monitoring XRPUSDT for a selling opportunity around 2.25 zone, Ripple is trading in a downtrend and currently is in a correction phase in which it is approaching the trend at 2.25 support and resistance area.
Trade safe, Joe.

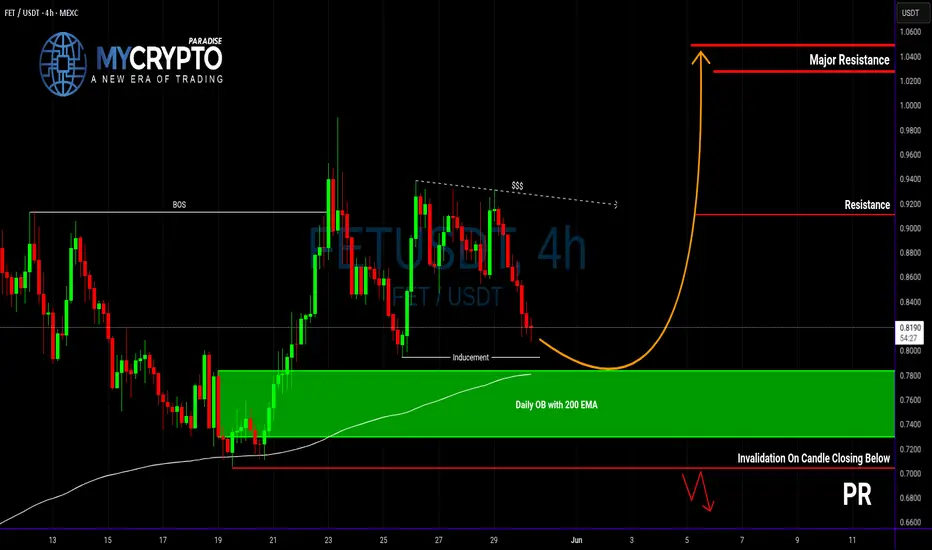
FET at a Make-or-Break Level... Will It Bounce or Break Down?Yello Paradisers, are you watching FET closely right now? If not, you might miss a textbook high-risk, high-reward setup that could play out very soon—just like we’ve been anticipating in our previous updates.
💎FETUSDT is currently respecting a bullish market structure, and price action is aligning for a potential inducement grab.
💎If this inducement occurs, and we start to see bullish confirmation signals from the Daily order block, backed by the 4H 200 EMA, then the probability of a strong bounce increases significantly. From a risk-reward perspective, this zone is shaping up to offer a solid long entry with clean invalidation.
💎But here’s the other side of the coin: if the price breaks down through the order block and closes a candle below our invalidation level, the bullish bias will be completely invalidated. In that case, patience becomes the strategy, and we’ll be waiting for more convincing and clearer price action to realign with a new setup.
🎖Strive for consistency, not quick profits. Treat the market as a businessman, not as a gambler.
MyCryptoParadise
iFeel the success🌴
Beginners Guide To Winning Memecoin Trades! Moo DengMeme coins have taken the cryptocurrency world by storm, often starting as jokes but evolving into high-volatility assets that attract crypto traders seeking quick gains. From Dogecoin to Shiba Inu and now Moo Deng, these so-called useless meme coins can offer trading opportunities—if you know where to look.
In this updated crypto analysis, I will build on our previous analysis where I identified a strong monthly supply zone for Moo Deng meme coin at $0.26. If you're wondering how to trade meme coins like Moo Deng, even with little experience, this supply and demand analysis breaks it down using simple supply and demand concepts on larger timeframes.
The sell-off is trying to happen.

TON/USDT on Fire: Bullish Momentum Builds Toward Major Targets!By examining the #TONCOIN chart on the 3-day timeframe, we can see that after correcting down to $3, the price has started pumping again and is showing strong bullish momentum. So far, it has gained over 15%, and I expect this uptrend to continue! The next targets are $3.64, $4.20, and $4.66. The expected return is around 20% in the short term, 40% to 55% in the medium term, and 110% in the long term. Support this analysis and stay tuned for more updates, my friends!
Please support me with your likes and comments to motivate me to share more analysis with you and share your opinion about the possible trend of this chart with me !
Best Regards , Arman Shaban

JUPUSDT Breakout... or Classic Bull Trap?Yello Paradisers are you truly prepared for one of the cleanest and most deceptive setups we've seen on JUPUSDT in weeks? A decisive move is building, but so is a very well-placed trap and only those who remain disciplined will navigate it safely.
💎#JUPUSDT has broken above a key resistance level that has rejected price action several times in the past. That same level is now being tested as support, and the market’s reaction here will be crucial. If this retest holds, we could see a continuation of the bullish structure with strong upward momentum. But this is precisely where many get caught assuming it’s a straightforward breakout, when in fact it could be the final bait before the flush.
💎The level at $0.5870 is now our line in the sand. If price remains above it, what we are witnessing is likely a healthy pause and consolidation before another impulsive leg upward. However, if $0.5870 fails, the next area of interest is the demand zone near $0.4718. A sharp move into this region could trap late bulls and shake out weak hands. The key will be whether buyers step in aggressively on that dip. A fast and strong rebound from the demand zone would confirm renewed strength, offering a potential high-probability long entry but only if the reaction is immediate and decisive.
💎To the upside, we are watching the moderate resistance around $0.7865, which could slow the move briefly. But the real game begins near the major supply zone at $0.8992. That’s where we expect smart money to begin unloading positions and anyone serious about preserving profits must be prepared to react accordingly.
💎However, if the price fails to hold even the demand zone and breaks below $0.4718, the entire bullish setup gets invalidated. That becomes our structural flip level, and if breached, we’ll turn bearish and prepare for further downside and potential lower lows.
Discipline, patience, robust strategies, and trading tactics are the only ways you can make it long-term in this market.
MyCryptoParadise
iFeel the success🌴

TRUMP/USD – Watching Key Support at 12.45–12.15 for Potential ReThe TRUMP/USD pair is consolidating near the strong horizontal support zone at 12.45–12.15, aligning with the 61.8% Fibonacci retracement of the previous bullish leg.
🔹 Key Levels & Scenario:
Support zone: 12.45–12.15 – price has repeatedly tested and held this area
Upside targets:
50% retracement at 14.096
78.6% retracement at 15.134
The pair is showing early signs of stabilization, suggesting a potential rebound toward these Fibonacci levels if the support holds.
📉 Invalidation:
A decisive daily close below 12.15 would invalidate the bullish bias and open the door for deeper retracement.
📌 Trading Plan:
Watching for price action signals (candlestick reversal or breakout) above 12.45
Targets: 14.096 and 15.134
SL: Below 12.15 for a conservative risk management approach
This idea focuses on the potential for a short-term reversal in a larger consolidation phase, supported by clear Fibonacci and horizontal confluence.

QNT BreakoutTraders,
As you can see from the BINANCE:QNTBTC pairing, that QNT looks to be ready to breakout.
As well as on the CRYPTO:QNTUSD Chart on the right hand side, we are about to see a breakout of this trend pattern which looks to be a Symmetrical Triangle. We have many other indications that this market is soon to start moving on some of these top alt coins.
This is a simple chart posted to show areas of interest when QNT moves forward toward price discovery. It is very possible to see the final target depicted on the chart on the right by the end of this alt coin season that we firmly believe started last month. Meaning we saw the bottom of the markets for the alt coins that are looking ready to start moving within the next 6-8 weeks.
Stay profitable folks,
Savvy

How To Spot The Next Big Algorand Crypto Move!In the fast-paced world of crypto trading, many traders gravitate toward intraday and scalping strategies, chasing quick profits while often ignoring the powerful signals presented by higher timeframes. Yet, the smart money — institutional players, whales, and seasoned swing traders — operate differently. They focus on bigger timeframe supply and demand imbalances to enter high-probability trades with calculated risk and substantial reward potential. One such opportunity is currently setting up in Algorand ( BINANCE:ALGOUSDT ).
Why Higher Timeframes Matter in Crypto Trading
Most crypto traders operate on the 1-minute to 15-minute charts. While this can be effective, especially with crypto intraday strategies, it often leads to overtrading and emotional decision-making. In contrast, higher timeframes — such as the daily and weekly charts — provide clearer market structure, show major supply and demand imbalances, and are less noisy.
These timeframes reveal where whales and institutions place large orders, creating impulsive moves that leave behind clues for patient traders. Ignoring these clues is akin to trading blind.
The Weekly Demand Imbalance on BINANCE:ALGOUSDT
BINANCE:ALGOUSDT is currently showcasing a textbook example of a solid and strong weekly demand imbalance around the $0.1380 level. A few months ago, this zone sparked a massive bullish impulse — a series of consecutive large-bodied white candlesticks that broke through resistance with conviction.
Such moves don’t happen randomly. They’re often the result of institutional accumulation — smart money stepping in with size. These large players create imbalances where demand far outweighs supply, causing prices to rally aggressively. The key for retail traders is to identify the origin of these moves and wait patiently for the price to return.

This Hidden Altcoin Could Explode—But Only If THIS Level Holds!Yello Paradisers, have you seen what’s quietly brewing on REZUSDT? A high-probability bullish reversal setup is forming, and if this level holds, it could lead to one of the cleanest altcoin plays we’ve seen recently. This isn’t just about one signal—REZUSDT is showing a rare confluence of bullish indicators that deserve your full attention.
💎Currently, REZUSDT is moving within a descending channel while printing a bullish divergence on momentum indicators. At the same time, a textbook W-pattern has just formed, and what makes this even more significant is that it’s happening right at a support zone. This triple confluence—descending channel, bullish divergence, and W-pattern at support—is increasing the probability of a bullish breakout in the coming sessions.
💎From an entry perspective, those looking for more favorable risk-to-reward (RR) could benefit from a deeper pullback. That would offer a higher probability setup and tighter risk management. However, for aggressive or short-term traders, the current level still offers a 1:1 RR, which, while not optimal, is acceptable under strict trade management and position sizing.
💎That said, there’s a critical invalidation point that must be respected. If the price breaks down and closes a full candle below the support zone, it would invalidate the entire bullish structure. In such a case, the only professional move is to stay out and wait for cleaner confirmation or a better-developed setup. There is no room for hope in trading—only strategy and discipline.
🎖Strive for consistency, not quick profits. Trade smart, Paradisers. This setup could be a gift for the patient and a trap for the impulsive. The key is always the same—discipline, patience, and strategic execution. Stay sharp, stay focused, and keep protecting your capital.
MyCryptoParadise
iFeel the success🌴

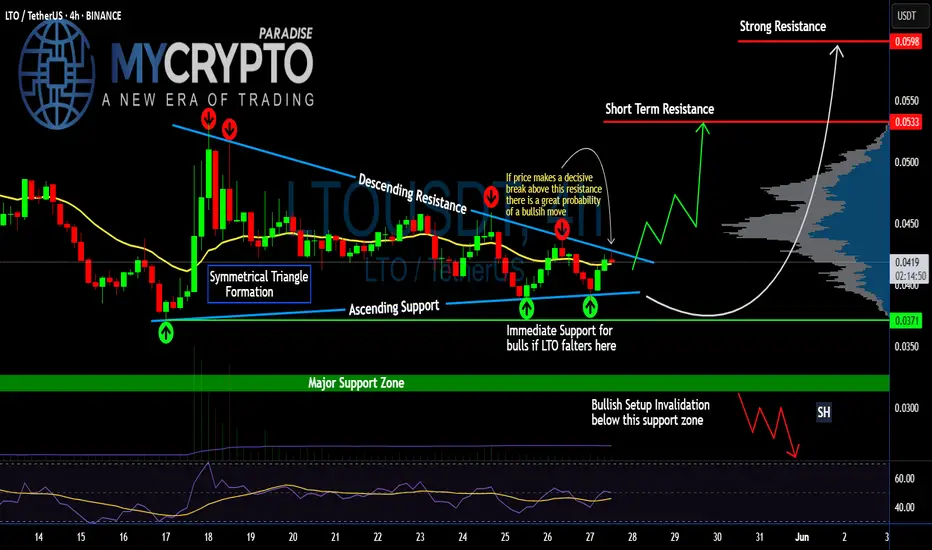
Is #LTO Ready for an Explosive Move or Another Trap Ahead? Yello Paradisers! Are you watching how #LTO is quietly tightening within a triangle while the rest of the market looks away? This might just be the last moment of silence for #LTONetwork:
💎#LTOUSDT is currently consolidating within a clean symmetrical triangle, wedged tightly between a descending resistance and an ascending support trendline. This pattern has already seen multiple touches on both edges, suggesting price is nearing the point of decision.
💎What makes this formation more compelling is how #LTOUSD is holding just above the immediate support at the $0.0371 zone and 20EMA is also acting as support. This area has acted as a launchpad twice already, keeping bullish hopes alive. Price is once again pressing against the upper boundary of the triangle, increasing the odds of a breakout on the next attempt.
💎If bulls manage to push above the descending resistance and we see a confirmed breakout with strong volume, the first upside target sits at $0.0533, which is a key short-term resistance level. From there, momentum could carry the price toward $0.0598, where a strong historical resistance lies based on the volume profile.
💎However, the bullish structure is clearly invalidated on a break below $0.0321. Any decisive move under this support zone would shift the short-term outlook in favor of the bears, potentially opening a path toward lower support.
Discipline, patience, robust strategies, and trading tactics are the only ways you can make it long-term in this market.
MyCryptoParadise
iFeel the success🌴
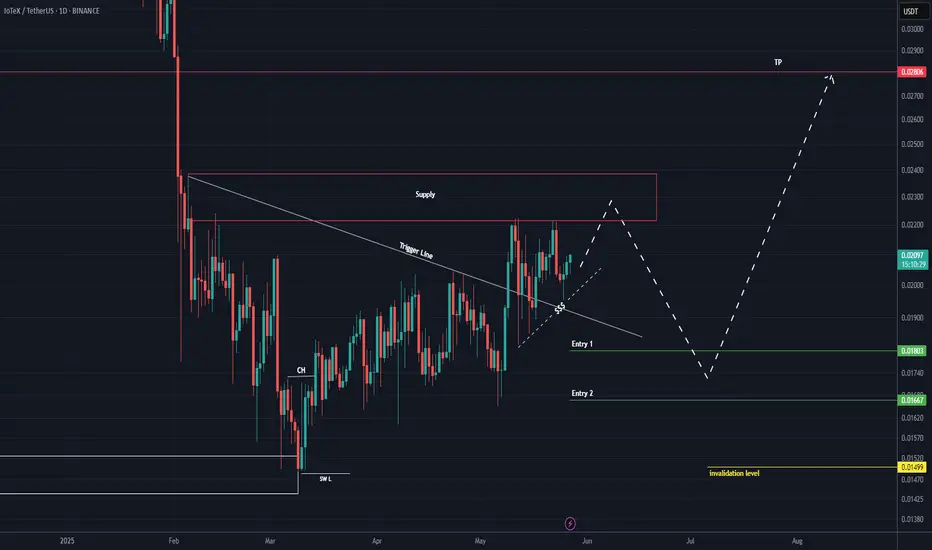
IOTX buy/long setup (1D)An important trigger line has been broken, and the price has been moving sideways for a while.
There is also a bullish CH on the chart.
It is expected that the price will make a pullback to the support zone and then move toward the supply zones higher on the chart. We are looking for buy positions at the entry points.
A daily candle closing below the invalidation level will invalidate this analysis.
For risk management, please don't forget stop loss and capital management
When we reach the first target, save some profit and then change the stop to entry
Comment if you have any questions
Thank You
Bullish Momentum Building, $112K Breakout on the Horizon?Hey Realistic Traders!
Can BINANCE:BTCUSDT Break Past $112K and Set a New All-Time High? Let’s Break It Down...
Trend Analysis
On the H4 timeframe, BTCUSDT has consistently traded above the EMA-90 line, confirming the continuation of a bullish trend. Within this trend, a falling wedge pattern formed, which is typically considered a bullish reversal signal. This pattern was followed by a breakout marked by a bullish Marubozu candle, further strengthening the bullish outlook.
In addition, a bullish crossover appeared on the oscillator, providing additional confirmation of upward momentum. Based on these technical signals, the price is expected to continue its upward move toward the first target at 113,613, with a potential extension to the second target at 117,968.
The outlook remains valid as long as the price stays above the key stop-loss level at 105,681.
Support the channel by engaging with the content, using the rocket button, and sharing your opinions in the comments below.
Disclaimer: "Please note that this analysis is solely for educational purposes and should not be considered a recommendation to take a long or short position on Bitcoin.

BONK About to Explode or Fakeout? Key Levels Are UnfoldingYello, Paradisers! Is #BONK gearing up for a face-melting rally, or is this just another trap designed for emotional traders?
💎BONKUSDT has recently formed a double bottom, a key reversal pattern that often appears before significant bullish momentum kicks in. This comes after a sustained bearish trend, and we’re now seeing signs of strength re-entering the market.
💎What’s even more interesting, a lookalike of skewed triangle pattern is starting to emerge. These often signal continuation of strength, and when paired with an already bullish reversal, it paints a potentially explosive short-term picture.
💎#BONKUSDT is currently sitting on ascending support around the $0.00001980 level. This zone is further bolstered by the EMA-50, adding extra technical significance. If BONK can continue to hold this level, the price is well-positioned to push higher toward the $0.00002470 mark, a moderate resistance zone that could serve as the next stepping stone in this bullish scenario.
💎If BONK clears this resistance with conviction, momentum could pick up rapidly, opening the doors for an aggressive move toward the $0.00003100 to $0.00003400 region. This is a critical profit-taking zone, not only because of historical resistance but also due to a dense confluence of technical barriers.
💎Zooming into the 12-hour timeframe, BONK has just entered a golden cross formation. This bullish crossover is acting as dynamic support, with the $0.00001800 level becoming an important defensive area for price stability moving forward.
Paradisers, strive for consistency, not quick profits. Treat the market as a businessman, not as a gambler.
MyCryptoParadise
iFeel the success🌴

UNIUSDT: A Massive Bullish Move Loading… or a Trap?Yello, Paradisers! Is UNIUSDT finally gearing up for a major breakout, or is this just another fake move before a deeper correction? Let’s break it down.
💎UNIUSDT is currently trading within a descending channel, increasing the probability of an upcoming bullish move. The key support zone is holding strong, and we might be witnessing the early signs of a double-bottom formation—a classic reversal pattern.
💎However, confirmation is everything in trading. To increase the probability in our favor, we need to see: Bullish divergence, Bullish I-CHoCH (Internal Change of Character), Bullish reversal patterns such as a W-pattern or inverse head and shoulders from our support zone.
💎If UNIUSDT retraces further, we expect a bounce from the strong support zone—but again, we must wait for clear bullish confirmations before taking any positions.
💎The invalidation level? If price breaks and closes candle below the strong support zone, the entire bullish setup gets invalidated. In that case, we wait patiently for better price action before considering any new trades.
🎖Patience and discipline are key, Paradisers. Many traders will get trapped in bad positions, but those who wait for the right confirmations will be the ones making money. Trade smart & stick to high-probability setups only.
MyCryptoParadise
iFeel the success🌴
