Cryptotrade

Hope you have your seat belts on !! XRPHi,
So I am going to wright this calmly to properly explain what is happening.
As usual, I was working whilst having the market a screen so I can always see it. So I was following my strategy when suddenly huge news comes out that XRP will be listed on Coinbase. As we all know, when ever XRP a coin gets listed on Coinbase it often gets a huge rise in price, so I rush to my computer and see we already went up 10%. Now, luckily I had a tiny trade in with no take profit (always good to have one after a steep drop).
The reason why this listing is even more exciting than others, is that it is with XRP and XRP is like no other coin, it haves a big support within the public community.
So for those wondering why such volatility, I am guessing insiders drove the price down bought big time and now it is on it's way for a short bull run. so I bought a big position even after the 10% rise as, we might even see a 100% rise here, the crypto market is not to be underestimated. It suprised us more than once, so this could be very interesting.
Hopefully we will all make money from this trade, have a wonderful day !

Trading opportunity set up, XRPHi,
I thought I would give you guys a little money making opportunity if you missed out before yesterday, no worries.
First trade opportunity: buy at 0.315 and sell at 0.324, which is 2.8% profit. Next target, 0.341.
Second trade opportunity: buy at 0.305 and sell at 0.315, which is 3.2% profit. Next target, 0.324
In both cases, you want to sell a part of your holdings at these target, move your stop lose into profit and let the rest run the next targets.
I kept it easy, this is more me just giving a free set up, so enjoy. Remember to enter your stop losses.
Don't forget, I am not a professional, taking this trade is at your risk, maybe this time look if I am right and if so, you can follow my next trdae set up (although I will not be giving free set ups that often, I am not here to run a signal group !
I am here to share my trades and point of view
Happy trading,
Have a nice day,
Piers Thackray
Become_you_best_success

XRP/USD - ShortShort term, potential short opportunity in XRP.... First Target - 0.3099, if we can break this level impulsively, we could see multiple opportunities to scale in, with a second profit area of 0.2921

STRATIS BTC BREAKOUTStratis agains BTC is situated into a BULLFLAG IN 1D TIMEFRAME so we have chance to see a great breakout.This setup is easy,volume it s still good for this breakout
STOPLOSS AT 2388 sats.
You have the targets above.still easy breakout setup.
ENJOY

Bitcoin instability (including drop levels) BTC/USD deflation]Hi guys.
Welcome to this update on the most accurate Bitcoin analysis on TradingView :)
This is a follow up on my previous idea regarding further BItcoin deterioration which will happen in the coming days, see previous idea at:
So far, Bitcoin has dropped nearly 10% from the previous idea's level, while altcoins deflated three times more during continual shake offs but we have more to go ;)
If you like an idea, please remember to press the LIKE button, it will motivate me to continue posting and offering you the best possible advice.
In this post I will be brief, because there is not too much to add to the analysis posted on the 2nd October.
Here are some interesting facts:
*Bitcoin failed to breach 6750 level in four attempts and failed to do it.
*Mathematically, Bitcoin should revisit 6280$ right after four consecutive failed attempts to breach 6750$. Had inter-consolidation on 6380 and continued to push fourth time towards 6800 (while continually making LH during each attempt. I find that behavior very unusual and after sinking from 6800 (as described in prevuious TA) revisited main support 2 times.
*It seems like it has more room to go. Some sidewalk (while rebouncing under 6380 while failing to breach it and then i would say 6.100$ approximately as a first rebuy,
Rest of the market should follow, therefore, my take is we had more room to go.
*I would not rely on Bitcoin making some significant movement here. Weekly made lower high 3.rd week consecutively. 6650 seemed like imaginary border in the moment of writing and my personal take is that @Bitcoin has nowhere to go but down even now when rebouncing betweeen 6250-6350 level.
Most likely we will see further lows on BTC (as per chart decribed).
Don't rush with rebuy (you saw yourself, had you rebaught 8 days ago you would have already lost 10% of nominal USD porfolio.
Good luck and remember to follow me to receive the latest updates instantly. If you like my idea, LIKE it with a button (smiley)
Positive feedback and constructive criticism are important to authors and the community.
Thanks for reading.

ADA BTC SHORTI m very very bullish at ada in long term but short term is a little bearish
-RSI double top 1D
-Stoch overbought 1D
-BTC about to drop( we are in CBOE futures which is bearish)
Entry short 1301 sats
1 TP- 1241
2 TP- 1137
Below 1137 will be a free fall for ADA
Bottom also is at 655-710 sats

BCH - Analysis - Primary Wave 1 & Wave 2 Correction - $423BITFINEX:BCHUSD is in a Primary Wave 2 Correction.
BCH has completed an Elliot Wave which had TWO extensions which were the 3rd and 5th impulse waves.
Look for a pull back to $423.00 then wait for confirmation that the correction has ended. (ie, Micro Wave)
Correction: Flat + ZigZag
Flat:
A flat correction is a horizontal formation that occurs in between two impulses. Like all corrections, this corrective wave is also made up of three waves. Unlike in a zigzag where Wave A is made up of 5 sub waves, the Wave A in a flat is made up of just three waves. This by itself signals a lack of strength to correct deeply the prior impulse wave. Wave B inherits some of this characteristic and ends near the start of wave A, and unfolds in 3 sub waves (remember in a zigzag, Wave B ends some distance away from the start of Wave A). Once Wave B is completed, the ensuing Wave C unfolds in 5 sub waves, but once again, unlike wave C of a zigzag, this wave C will finish at or just beyond the terminal point of Wave A. A flat is usually found in the fourth wave position.
Wave C in a flat tends to finish at the 138.2% projection of Wave A. You can safely use this as a simple and easy to remember guideline.
ZigZag:
This is the simplest form of correction, (A, B and C) where Wave A is made up of five waves and Wave B has 3 internal waves. Wave C is always made up of 5 waves in any correction, irrespective of the category.Waves A and B, you will compute the 100%, 138.2% and 161.8% projections.
If a zigzag occurs in Wave 2 position, the maximum distance it usually travels is to the top of wave 1 of the preceding lower degree.
Where is the top of Wave 1 of the preceding lower degree? $422.96
In the case of an irregular correction, however, the B wave tends to go beyond the starting point of Wave A and just when everyone is convinced that the original trend was probably back in place, the price turns around and comes down rapidly as the C wave to complete the correction.
An irregular correction is frequently spotted at the end of an extended fifth wave, because an extended fifth wave is subject to what is known as double retracement.
Hourly:
3HR:
6HR:
Will update.
-AB

BCH-BREAKING AND TARGETCOINBASE:BCHUSD is ready for a strong breakout based on technical analysis and wave counts.
Daily Chart:
1. Yellow Trend lines: Descending Triangle at terminal point and breaking to the upside above the yellow lines.
2. DC - Price is breaking the upper band
3. White Rectangle shows a complete Wave formation
4. Chande Kroll Stop shows price breaking above long and short stop lines
5. Price and Volume Trend is breaking out
6. Efficieny Ratio is crossing from negative to positive
7. Positive Volume Index
8. Volume Price Confirmation Indicator
9. Accum/Dist & On Balance Volume
I like to use these sets of indicator to confirm bottoms and breaking points.
FIBO SPIRALS - The price will hit and 'ride' the spirals and can be used for targets
1. Near-term Green
2. Intermediate-term Purple
3. Longer-term Yellow
COINBASE:BCHUSD Today's Target is $654
See related idea: BCH- Break out or Breakdown?
I will update!
-AB

Bitcoin History Repeat Again (REAL BITCOIN BOTTON)Again we are come back with our magic. The question is buzzing in bitcoin world that what is the bottom price of bitcoin after this ATH 19600?
So here we just did a great analysis for bitcoin long term holder. so check this chart guys.
Bitcoin first biggest rally started in 2013 and goes ATH at $1070 in JAN 2015.
Further btc value decrease from Jan to mid july at 235.
From mid July (first green circle price approx 235) btc biggest rally started from $235 to $19100+.
Yes, there are many short correction between mid 2015 to dec 2018.
Now We can see in next downtrend in Jan 2018 after bitcoin ATH $19100. Like same as 2013 btc started its next correction for its again highest rally. So btc can bounce from 4000-4700 dollar area(second circle) and 2500-3500 dollar area(thirst green circle.
After that long term target 22000-25000-34000-40000. All possible
if have any suggest please comment and don't forget to follow and share this chat in twitter.
I did very hard work for u. Thanks for watching.


$ADA updateStill in this position. I'd like to bring your attention to the R:R ratio. Look how it has changed over time. This is a concept that was first brought to my attention by Crypto Cred who learnt it from Trader Dante. It's called an evolving R and the concept is that there's no such thing as a free-trade.
So often you see people move their stop to break even immediately and then say it's now a free-trade but really this a shit mindset. There's still money to be made and you're throwing it away if you don't manage a position correctly and you allow it to come all the way back to your break even point or your original stop loss after being well on it's way to meeting your take-profit target. I'm not saying to trail a tight stop-loss and choke the trade because that would go against your original trading plan; what I'm saying is that if your position is 90% of the way to your target then move bloody stop-loss up because you're now risking 90% for that last 10% because your R:R has evolved over-time. Hope you understand this, I'm not great at explaining it. Look up Trader Dante & Crypto Cred for a better explanation.

ZENcashTrading ideasYou are late to the party at the moment, but not too late yet. There is a long term uptrend on ZEN that just had another higher low at our recent bottom. Lower time frames look like we should get a retrace, but have formed bullish trends on multiple indicators. 1hr CMF - just with bullish pattern though still negative, OBV in an obvious bullish trend and has broken sell pressure, Ascending triangle pattern forming too. Macd crossing bullish again. So after a pump we should see a retrace for a good buying opportunity as long as BTC does not kill everything. 4hr is all bullish, with indicators starting to trend high - retrace soon.
1 Day - this chart - is Extremely bullish. OBV turned up before breaking into below buying support. CMF in a bullish trend. Stoch high and curving back up. MACD low and bullish. A lot of good signals here.
If I was not already in a position, I would be layering increasingly larger buy orders through the volume support from .0026 - .0021. I find it highly unlikely we will see .0021 again, but if Market makers want to accumulate more they may try to push it down once more so worth the low order. Targets: .0035 / .004 / .0045 / .0054 based on previous resistance and volume.
Long term support now at about .00221 but a wick broke that by a long shot and came back up on the 27th. - So some super low orders just in case would be a good idea too.
This is not financial advice. I am not your adviser. These are my ideas and what I am doing. Sharing for educational purposes only.

Quick trade for $BTC on the 1HFind me on twitter @BabyWh4le where I post more frequently.
Always open to discussion, thanks for viewing.

Potential $EOS tradesThanks for viewing, you can find me on twitter @BabyWh4le where I post more frequently. Always open to discussion.

$BTC on the 1HYou can find me on twitter @BabyWh4le where I post more frequently. Always open to discussion, thanks for viewing.

NEO Divergences Explanation Importance Then we have NEO against USD.
Posting this chart mainly for showing how strong bearish divergences in essence are. At the end of 2018 we were making strong bearish divergences, making a significant drop.
After that we’ve seen that it’s making strong bullish divergences and making a substantial upwards movement afterwards, as we tweeted about the falling wedge here too.
I remember that the level it was bouncing from, was also around the 0.618 fib level of the whole thing.
From this bearish divergence, it already made a 35-40% drop.
From the bullish divergence back in the beginning of April, we’ve seen an increase of 105%.
What I’m expecting now from NEO? Small downwards moves some more.
Important are this $60 support zone, which is quite important, given the earlier peak levels.
After that: $45 or maybe even $40 making a giant falling wedge with bullish divergences, breakout afterwards.
First important support level is coming up around this area.
Regarding the divergences: check my other Ethereum and Bitcoin charts where I’m relying on them too.

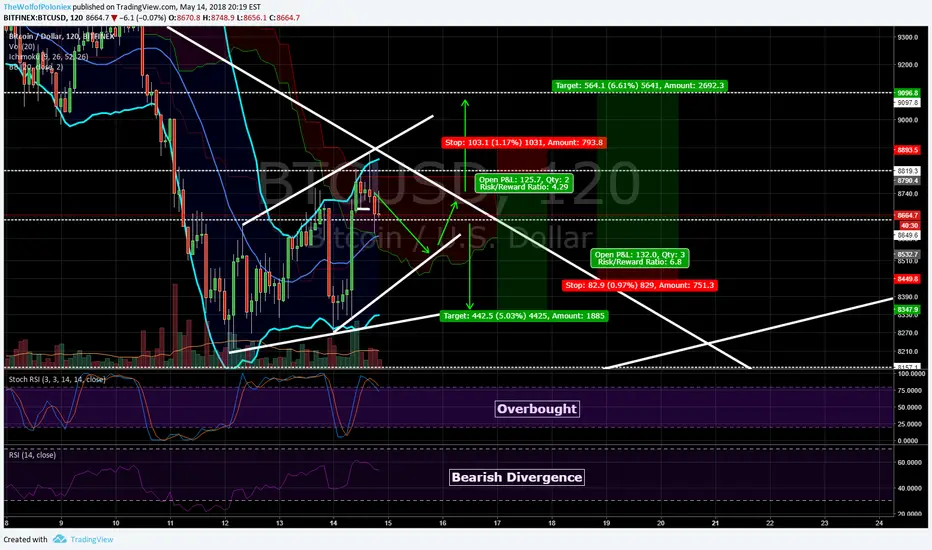
Neutral Position on BTCUSDBTCUSD is retracing after it's whale-ish, unbelievably obvious manipulated push yesterday. This push trapped all the bottom shorters from the dip earlier in the day. I longed the bottom & plan on taking profits as soon as it dips down further in this retracement. Judging by the Ichimoku Clouds, StochRSI's, Spinning Top on the 4H, etc, it seems like BTC will dip again before another push. To avoid unwanted positions, I plan on keeping about my neutral strategy with BTC and hedging my positions at the most opportune times.
It'll take away from some of my profits but will keep me nice warm, safe, secure and feeling fuzzy.
Stay safe guys. These are killer whales you're swimming with.
Happy trading!
-Wolfie

Bitcoin Retracement started, $8.400? $7.200? Let's find outBitcoin update, after the chart from 27th April.
We’ve seen a nice movement upwards to $10.000 and a drop down after. Unfortunate, but we can’t ignore the indicators, can we?
We did see bearish divergences earlier during the movements upwards. Now, it’s finished making the bearish divergences, as discussed.
Scenario 1 from my earlier analysis happend.
What do we see?
Strong bearish divergence on the daily on the RSI, MACD, Stoch and CCI. Also on the histo.
So, what are the scenario’s?
- Scenario 1: We’ve seen the retracement and will move upwards from here. Doesn’t suit the 5-3-5 correction waves modus and doesn’t suit the strenght of the bearish divergences.
- Scenario 2: We see some short term upwards movements to $9.400-9.500 and from there we’ll see a drop towards the $8.400/$8.600. There’s the fibonacci level (0.382) as well and there’s also the 1.618 fib level from this drop down.
- Scenario 3: We will retrace all the way down towards $7.200 zone, where the support of this triangle is lying, which is pretty possible, combining with EW theory.
Concluding. I’m hanging to scenario 2, I don’t see any clear bullish signals. Combined with the G20 meeting the end of June, it’s pretty much likely that we’ll breakout from that event (check the timeframe).
In the bubble patterns phase, another higher low is possible, making it the depression phase.
Strategy: best to be in USDT and check frequently. Bullmarket will come after this triangle.

ETHUSD - First target reached. Next level 826First target of 690 has been reached. No signs of volume climatic volume, signaling sellers are not present. If price can get above this level and retest this area successfully, next supply level is the 826 handle. Stop loss move to 680 level so to lock in profits.

NANO is a charging bull???Nano has been following BTC a lot in it's movement. After this pump and dump from BTC manipulation that happened last night we can see that #nano has played around 8100-8200 which is a very good bargain and good buy-zone. If we follow the Elliot Waves Pattern against the fibonacci we can have a clear picture of where the expected bull run will go. This all depends of-course from BTC which is unpredictable as usual but it seems to be forming a double-bottom after bouncing of the support twice, and hopefully it will hold strongly. Should BTC drop lower we might see a smaller, further dip from NANO but fingers crossed that the coin will keep this level and should not go lower.More volume will give more momentum upwards and although RSI is showing in the 40's this will change drastically when the market starts flowing in. Go long on Nano and long term this coin will give you great returns and it is one of the best ROI coins I found MED-LONG. I set my targets high enough to take a good profit but it is always wise to monitor in order to maximise profits along the way up. March is always the worst month for crypto historically and April should bring new green market. Wish you all well and happy trading crypto.

Blocktix (TIX) gearing up for a possible breakout...Blocktix has been showing signs of starting to wake up. It is currently in an upward channel and approaching resistance levels. A sound strategy would be to buy the breakout and holdon for the ride. First take profit area: .0001200 Satoshis level. As always trading carries risks and you should always exercise due diligence. This is not intended as financial advice. Good luck!
