JASMY at a Crossroads: Breakout or Deeper Drop?Yello, Paradisers! JASMY remains in a bullish market structure on the higher timeframe, but the question is—will the current retracement lead to a breakout or a deeper correction?
💎Right now, JASMYUSDT is retracing into a crucial support zone. If the price breaks above the resistance trendline with strong volume and confirms a bullish I-CHoCH on lower timeframes, it would significantly increase the probability of an upward move. However, patience is key—confirmation is crucial before entering a trade.
💎If the retracement deepens or panic selling kicks in, we’ll be watching the next strong support zone. A bounce from there is possible after taking inducement, but confirmation will still be necessary—look for a bullish I-CHoCH on lower timeframes or classic reversal patterns like a W pattern or inverse head & shoulders.
💎However, if the price breaks below the strong support zone and closes candle below it, our bullish scenario becomes invalid. In that case, it’s best to step back and wait for a stronger price action setup before making any moves.
🎖The key here is discipline and patience. Don't chase trades—wait for high-probability setups and let the market come to you. This is the only way to stay consistently profitable in the long run.
MyCryptoParadise
iFeel the success🌴
Cryptotrader

CELRUSDT: Massive Move Incoming? Key Support Holding Strong! Yello, Paradisers! Is CELRUSDT gearing up for a major bounce, or is another leg down coming? Let’s break it down.
💎CELRUSDT has retraced to a key support zone, showing a healthy pullback. The price action has formed a falling wedge pattern, which is typically a bullish reversal setup. The probability of a bounce from this level is high, but to confirm a stronger move, we need additional bullish signals—such as an I-CHoCH (Internal Change of Character), a W pattern, or an inverse head and shoulders on lower timeframes.
💎Right now, the price is attempting to break out of the falling wedge, but we need to see an increase in volume to confirm a proper breakout. A weak breakout without volume could lead to a fakeout, so patience is key.
💎If CELRUSDT drops further, especially in a panic-selling scenario, we can expect a bounce from the stronger support zone below. However, just like in the current setup, we will need clear bullish confirmation—such as an I-CHoCH or bullish patterns on lower timeframes—to increase the probability of a reversal.
💎If the price breaks down and closes candle below the strong support zone, it will invalidate our bullish setup. In that case, waiting for a more favorable price action setup will be the best strategy before looking for long entries.
🎖 The market is full of traps, and patience is what separates the winners from the losers. Wait for confirmation, follow the strategy, and never trade based on emotions. Play it smart, Paradisers! Stay disciplined and trade like a PRO.
MyCryptoParadise
iFeel the success🌴

106K Showdown: Can BTC Send?Bull
Breaking levels—momentum needs to keep rolling.
If this is the send, eyes on the usual markers.
106K is still the big bad bulls need to break.
Clear that, and we start looking for idealized moves.
Let’s see if they’ve got the juice.
Here is the ideal path if it can break above.

ARUSDT: Major Move Incoming? Don’t Get TrappedYello, Paradisers! Is ARUSDT setting up for a big reversal, or are we about to see another wave of panic selling? Let’s break it down.
💎ARUSDT has been in a healthy retracement, forming a falling wedge pattern—a classic bullish reversal structure. Right now, the price is approaching a key support zone and the lower trendline of the wedge. This increases the probability of a bounce, but we need confirmation before taking any action.
💎Bullish I-CHoCH, W pattern, or an inverse head & shoulders on lower timeframes—these signals will strengthen the bullish case.
💎If price drops further due to panic selling, the next strong support zone will be critical. Again, we’ll wait for the same bullish reversal signs before making any moves.
💎However, if ARUSDT breaks down and closes candle below the strong support zone, it invalidates the bullish idea. In that case, we step back and wait for better price action before considering any entries.
🎖 Patience is key, Paradisers. Trading is not about guessing—it's about waiting for high-probability setups and executing with discipline. The market will reward those who wait for confirmation, while those who rush in will pay the price. Be the trader who plays it smart!
MyCryptoParadise
iFeel the success🌴

#FLOKI at a Make-or-Break Moment – Major Breakout Incoming?Yello, Paradisers! Is #FLOKI gearing up for a massive breakout, or are we about to see another leg down? Let's look at the latest analysis of #FLOKIUSDT:
💎The price has been consolidating within a falling wedge formation on the 12-hour timeframe, a pattern that often leads to a bullish reversal. This pattern and a liquidity sweep at the lower boundary have already shaken out impatient traders. But remember, no move is confirmed until we see a decisive breakout. A decisive move above key resistance is needed to confirm the shift in momentum.
💎#FLOKI is currently testing the descending resistance of this wedge, and a breakout above $0.00019 could trigger a strong rally. If bulls take control, the next major target will be the supply wall between $0.00028 - $0.00030, where significant selling pressure is likely to emerge. A clean move above this area could open the doors for an extended bullish run. However, failure to break above resistance could lead to another pullback before any real upside momentum develops.
💎On the downside, #FLOKIUSD is sitting on a strong support zone around $0.00011. Buyers have consistently stepped in at this level, reinforcing its importance. If this support holds, we can expect a bounce and a potential attempt to break out of the wedge. The next line of defense for the #FLOKIUSDT is at the demand zone at $0.000086 if the above support fails.
💎However, if #FLOKI loses this support and a candle closes below $0.000086, the bullish scenario would be invalidated, exposing the price to further downside toward the lower support zone.
Stay focused, patient, and disciplined, Paradisers🥂
MyCryptoParadise
iFeel the success🌴

Pattern Patience: Mastering Emotional Discipline Morning Trading Community
Ever feel like your emotions mess with your trading? This video's for you. We'll explore how patience with chart patterns, like the double bottom, can teach us discipline. It's about waiting for the right moment, not rushing in.
Kris/Mindbloome Exchange
Trade What You See

#SEI Ready for a Bullish Rally or Not? Key Levels to Watch Yello, Paradisers! Is #SEIUSDT gearing up for a major breakout, or are we in for another leg down? Let’s break down the #SEI setup:
💎#SEI is currently trading within a falling wedge formation on the 8-hour timeframe, a classic bullish reversal pattern. This pattern, coupled with a liquidity sweep at the lower boundary, has already shaken out impatient traders. But remember, no move is confirmed until we see a decisive breakout. A decisive move above key resistance is needed to confirm the shift in momentum.
💎The major resistance zone to watch is $0.479. If #SEI manages to break above this level with strong volume, we could see a sharp rally towards the $0.65–$0.70 range, where significant selling pressure may come into play. However, failing to break above resistance could lead to another retest of lower levels before any bullish continuation.
💎On the downside, #SEI is sitting on a strong support zone around $0.2800. Buyers have consistently stepped in at this level, reinforcing its importance. If this support holds, we can expect a bounce and a potential attempt to break out of the wedge. The next line of defense for the #SEI is at the demand zone at $0.205 if the above support fails.
💎However, a candle closing below the demand zone at $0.2053 would invalidate the bullish scenario, exposing #SEI to a further drop towards $0.15 or even lower.
Stay focused, patient, and disciplined, Paradisers🥂
MyCryptoParadise
iFeel the success🌴

ETH Before the Hunt: Why Clarity is King in TradingIf you find this information inspiring/helpful, please consider a boost and follow! Any questions or comments, please leave a comment!
When it comes to trading, patience is often as important as the strategy itself. As I stared at the chart for what felt like an eternity, I couldn’t help but notice the mixed signals emerging from the Elliott Wave side of things. Mixed signals can be frustrating, especially when you’re eager to make a move, but they’re also a reminder to slow down and let the market tell its story.
In moments like these, clarity is everything. For me, clarity comes at specific levels—in this case, 3k or 3750. Until one of these levels breaks, I can’t say I’m confident enough to take a stance or make an entry. Trading without clarity isn’t trading; it’s guessing. And let’s face it, guessing doesn’t have a great track record in this game.
Why 3k and 3750 Matter
So, why these specific levels? In technical analysis, certain price points serve as psychological or structural boundaries. They’re often where traders make decisions that push the market one way or another. A break of these levels would signal a shift—whether in momentum, sentiment, or structure—that provides the clarity I need to move forward.
Elliott Wave analysis is notoriously nuanced. Sometimes the waves line up perfectly, painting a clear picture, and other times they leave you scratching your head. Right now, the picture isn’t clear enough for me to confidently interpret the waves, which is why those key levels are so important. They act as filters, cutting through the noise and allowing me to focus on the signal.
The Power of Patience
Patience in trading isn’t just about waiting—it’s about waiting with purpose. The market doesn’t reward impulsive behavior, but it often rewards disciplined traders who wait for the right setup. That’s why I’m holding off for now. If one of those levels breaks, I’ll reassess, recalibrate, and, if everything lines up, begin the hunt for an entry.
The idea of “the hunt” is what keeps me engaged. It’s not about rushing to pounce on an opportunity; it’s about tracking it, understanding it, and striking when the odds are in your favor. But before the hunt, there’s the waiting.
Dealing with the Uncertainty
It’s worth noting that uncertainty is part of the game. No chart analysis, no matter how thorough, can guarantee an outcome. What you can do is put yourself in a position to make informed decisions based on your strategy and the information available. Right now, the information I need lies at the 3k and 3750 levels. Until those break, my job is to sit back and observe.
Waiting for clarity might feel passive, but it’s an active part of the process. By staying patient, I’m avoiding the pitfalls of premature action and ensuring that when I do make my move, it’s backed by data, analysis, and strategy—not emotion or guesswork.
Final Thoughts
Mixed signals are part of the trading experience. They can test your patience and make you second-guess your approach, but they’re also a valuable reminder to stick to your plan. For me, that means waiting until 3k or 3750 levels break. When they do, I’ll be ready to act.
For now, the hunt is on pause. But once clarity shows up, that’s when the real work begins. Until then, it’s all about watching, analyzing, and preparing. Because in trading, as in life, timing is everything.
Trade safe, trade smart, trade clarity.

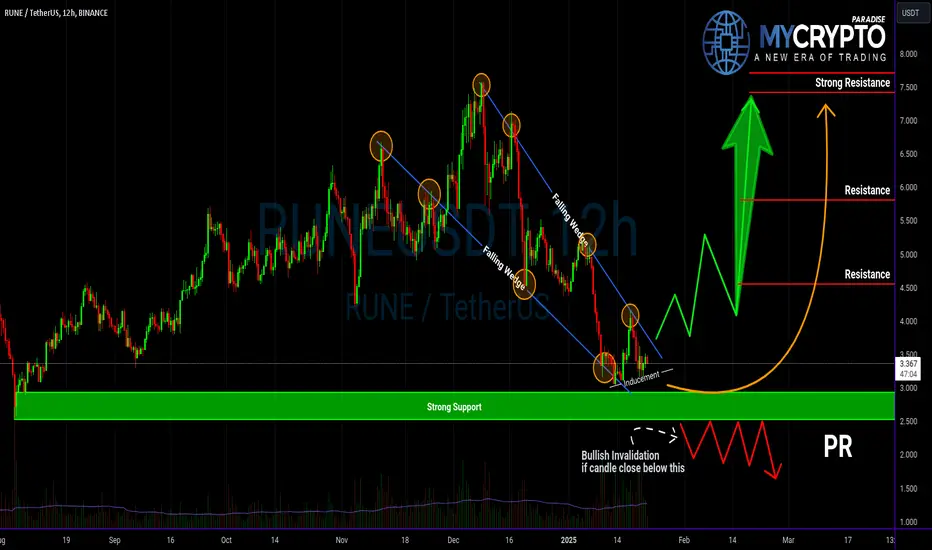
RUNEUSDT: Is This Falling Wedge About to Trigger a Major Move?Yello, Paradisers! Have you been keeping an eye on RUNEUSDT? The price is following a textbook falling wedge pattern—a bullish formation that’s caught our attention after a healthy retracement. But here’s the main question: Will this breakout bring the pump we’re all waiting for, or is more pain on the horizon? Let’s dive in.
💎If RUNEUSDT breaks out of the falling wedge, the probabilities for a bullish move will significantly increase. However, don’t jump the gun—confirmation is key! Look for big volume spikes accompanying the breakout to validate the move. Without sufficient volume, it’s just a fake-out waiting to trap impatient traders.
💎On the other hand, if we see more retracement or even panic selling, the price could dip below the current inducement levels. In this scenario, we’d expect a bounce from the strong support zone, which is sitting at a crucial level. To improve the odds in our favor, keep a close eye on bullish I-CHoCH (Internal Change of Character) forming on lower timeframes. This will provide an early signal for potential trend reversal.
💎Now, let’s address the flip side. If the price breaks down and closes below the strong support zone, it will completely invalidate our bullish idea. In such a case, the smart move is to exercise patience and wait for better price action to develop. There’s no need to rush when the market isn’t showing clear opportunities!
🎖 As always, Paradisers, discipline is your greatest trading edge. Don’t act on emotions or rush into trades without proper confirmation. Only the patient and strategic will profit in the long run. Stay focused, stay smart, and play this game like a pro!
MyCryptoParadise
iFeel the success🌴
APEUSDT: Can Bulls Defend This Key Zone?Yello, Paradisers! Could APEUSDT’s Next Move Shock Traders? Here’s What to Watch!
💎APEUSDT has grabbed attention after completing a healthy retracement and taking out the inducement. But is this setup ready to explode into a bullish rally, or could deeper corrections be on the horizon? Let’s break it down step by step:
💎If APEUSDT forms a classic W-pattern or an inverse head and shoulders on the lower timeframes—and breaks above the resistance trendline—this could signal the start of a strong bullish move. These are high-probability setups that often precede a rally, so keep them on your radar.
💎In case of further retracement or panic selling, the strong support zone below could act as a critical bounce level. However, for this scenario to materialize, a W-pattern or inverse head and shoulders at this zone is essential to confirm bullish intent. Without these formations, the bounce may lack strength or fail entirely.
💎If the price breaks down and closes candle below the strong support zone, it would invalidate the bullish thesis entirely. At that point, stepping back and waiting for new price action setups will be the smarter play. Chasing trades in this kind of breakdown could lead to unnecessary losses—patience always pays off in the long run.
Paradisers, this is where discipline separates winners from the rest. 🎖 Watch for those key patterns and stick to confirmed setups. Chasing the market without proper signals is a recipe for disaster.
MyCryptoParadise
iFeel the success🌴

XLMUSD: Classic Long From Support
XLM looks bullish after a test of a key support.
The price broke and closed above a resistance line of a falling
wedge pattern on a 4H time frame.
The coin may continue rising at least to 0.4527 level.
❤️Please, support my work with like, thank you!❤️

#COTI Getting Ready for a Mega Bullish Wave | Key Levels Yello, Paradisers! Is #COTIUSDT about to break out, or are we heading for a bearish breakdown? Let's break down the latest setup of #COTI:
💎The current falling wedge formation on the 8-hour chart is showing high potential for a bullish reversal. This pattern, coupled with a liquidity sweep at the lower boundary, has already shaken out impatient traders. But remember, no move is confirmed until we see a decisive breakout. #COTIUSD is moving to retest the descending resistance.
💎 OTC:COTI is facing a tough resistance at $0.142, aligning perfectly with the descending wedge’s upper boundary. A clean break and close above this level on the 8-hour timeframe could spark a rally toward the $0.18–$0.19 major supply wall, where sellers are likely to pile in.
💎On the downside, $0.09719 remains a strong support zone, where buyers have historically stepped in. If #COTI closes below this level, we may see a sharper decline toward the $0.077 demand zone, which is the last line of defense for bulls.
💎A close below $0.07780 would invalidate the bullish setup entirely and signal a potential plunge to lower lows. This breakdown would open the door for further bearish momentum, with sellers fully in control.
Stay focused, patient, and disciplined, Paradisers🥂
MyCryptoParadise
iFeel the success🌴

Unlock Your Trading Potential: How to Design the Perfect Trading
Morning Trading Family
Ever wonder how the pros keep getting better? It's all about the journal! Join me in this video where I spill the beans on setting up your own trading journal that'll skyrocket your learning curve.
We'll go through how to record each trade like a pro, capturing not just the when and where, but the why. I'll share simple methods to make your journal entries meaningful and insightful. Check out a real-life example from my journal, where I share not just the trades but the feelings behind them. Learn to spot the patterns in your trading - the good, the bad, and the ugly.
Whether you're just starting out or you've been trading for years, this video is your roadmap to personal growth in the trading world. I'll show you how a few minutes each day can transform your trading strategy. Drop your thoughts, questions, or your own journaling hacks in the comments!
Kris/Mindbloome Exchange
Trade What You See

Is FLOKIUSDT About to Explode or Collapse?Yello, Paradisers! Are we on the verge of a breakout for FLOKIUSDT, or is a deeper retracement looming? Let’s break it down with clear action steps to keep you on the right side of the trade.
💎FLOKIUSDT has recently shown a bullish I-CHoCH (Internal Change of Character) and is currently undergoing a healthy retracement. This retracement is a critical moment that could lead to significant price movement depending on what happens next.
💎If FLOKIUSDT bounces from the current price and successfully breaks the resistance trendline, it will significantly increase the probability of a bullish continuation. This would signal the market’s intent to push higher, making it a potential opportunity for well-planned entries.
💎Should the price dip lower to grab inducement before bouncing, keep an eye on the strong support zone. A bounce from this level paired with a bullish I-CHoCH on lower timeframes will increase the odds in your favor, making it a better entry for those looking to go long.
💎If the price breaks and closes a candle below the strong support zone, it will invalidate the bullish setup entirely. In that case, the best strategy would be to wait patiently for clearer price action to form before making any moves.
As always, it’s essential to stay disciplined and follow a high-probability strategy. Trading without confirmation can expose you to unnecessary risks, so be sure to wait for the market to show its hand before committing to a trade.
MyCryptoParadise
iFeel the success🌴

Can #AAVE Bulls Push the Price Further or Not? Key Levels Yello, Paradisers! #AAVEUSDT is gearing up for a major move, but will it be a breakout to new highs or a collapse to lower levels? Let’s dive into the current setup of #Aave:
💎#AAVEUSD is trading within a Symmetrical triangle formation, a classic bullish reversal pattern often seen before significant price surges. Over the last few weeks, we’ve seen multiple liquidity sweeps at lower levels, where impatient traders got shaken out. These sweeps usually hint at a potential breakout, but confirmation is still key before making any decisive moves.
💎#AAVE faces strong resistance near $395.7, which aligns with the upper boundary of the falling wedge. For bulls to take control, the price must close above this level on the 8-hour timeframe. A breakout here could trigger a powerful rally toward the $550–$575 major resistance zone, where sellers are likely to step in.
💎On the other hand, the first significant support level sits at $275, an area where buyers have consistently entered the market. If this zone holds, it could serve as a springboard for the next upward move. If #AAVE closes below $275, the next major support lies at $224.
💎A close below $224 would signal a breakdown of bullish momentum, increasing the likelihood of a prolonged bearish phase. The bears will take control of the price movement and it will fall to lower support levels.
Stay focused, patient, and disciplined, Paradisers🥂
MyCryptoParadise
iFeel the success🌴

BONKUSDT: Double Bottom Reversal or Breakdown Ahead?Yello, Paradisers! Are you watching BONKUSDT right now? Because what happens next at this critical support zone could either set up a massive bullish reversal or bring another wave of panic selling that traps impatient buyers. Let’s break down why this setup demands your full attention.
💎Right now, BONKUSDT is showing a healthy retracement after its recent moves, and the formation of a descending channel suggests a possible double bottom pattern could be in play. But here’s the catch — for this bullish scenario to play out, we need to see confirmation on the lower timeframes. Here’s what we’re watching closely:
💎If BONKUSDT gives us a bullish I-CHoCH (Internal Change of Character) on the lower timeframes within the current support zone, it will significantly increase the chances of a bullish breakout from this descending channel. This would be the first signal that buyers are stepping back in and preparing for a reversal.
💎However, if we see further retracement or even panic selling, don’t worry just yet. There’s a strong support zone below, where we can expect another potential bounce. But once again, we need bullish confirmation through an I-CHoCH in the lower timeframes to increase our probability of success. Without that confirmation, it’s best to stay cautious.
💎If BONKUSDT breaks down and closes a candle below the strong support zone, then our entire bullish idea gets invalidated. In this scenario, it’s better to stand aside and wait for a more reliable structure to form. No need to force trades — discipline beats FOMO every time.
💎It all comes down to patience and waiting for the right signals to line up. The lower timeframes hold the key, and as always, we must follow the price action, not get caught in emotions.
Stay focused, Paradisers. Let the market show you the way — it’s all about timing and strategy.
MyCryptoParadise
iFeel the success🌴

SOLUSDT Ready to Soar? Wave 5 Points to +30 % Upside PotentialHey Realistic Traders, Will BINANCE:SOLUSDT Create New All-Time High? Let's dive into the analysis...
Analyzing Solana's (SOLUSDT) price movements using Elliott Wave Theory indicates the potential for a significant upside in Wave 5. Wave 3 previously extended beyond the 1.618 Fibonacci extension, classifying it as an extended wave. Following this, Wave 4 retraced approximately to the 0.618 Fibonacci level, forming a falling wedge pattern, which is a bullish signal.
The breakout from this falling wedge on the 4-hour chart, combined with a bullish divergence in the MACD indicator, suggests the possible initiation of Wave 5. However, as Wave 5 is expected to be a standard wave rather than an extended one, its movement may be relatively limited compared to the high of Wave 3.
Based on these technical signals, the price is projected to rise toward the $302.46 target , provided it holds above the critical stop loss level of $175.28.
Support the channel by engaging with the content, using the rocket button, and sharing your opinions in the comments below.
"Disclaimer: "Please note that this analysis is solely for educational purposes and should not be considered a recommendation to take a long or short position on Solana".

Will TURBOUSD Explode Higher? Or Are We Facing a Fakeout?Yello, Paradisers! Have you noticed how TURBOUSD has bounced from its minor support zone recently, hinting at a potential bullish reversal? The bullish I-CHoCH (Internal Change of Character) on the charts certainly has us paying close attention—but is this the real deal or just another trap? Let’s break it down.
💎Currently, TURBOUSD is trading within a resistance trendline that’s giving it a triangle-like pattern. This setup signals a decisive move ahead. If the price manages to break above the trendline and close a strong candle above it, the bullish probability will increase significantly, paving the way for a potential rally.
💎But let’s not forget about the risks here. If the market faces more retracement or panic selling, we could see TURBOUSD dip further to take out the below inducement level. In that scenario, it would be crucial to monitor the lower timeframes for another bullish I-CHoCH to confirm a possible bounce.
💎On the flip side, if the price breaks down and closes a candle below the key support zone, the entire bullish setup will be invalidated. In such a case, staying patient and waiting for stronger price action will be the smart move.
🎖As always, Paradisers, the key is to stay disciplined and let the market reveal its hand. Whether this triangle pattern resolves to the upside or downside, remember: consistency and patience will always win over impulsive decisions. Stay sharp and trade smart—this is the only way to make it long-term in the crypto game.
MyCryptoParadise
iFeel the success🌴

Is BCHUSDT Preparing for a Bullish Reversal or a Steeper Drop?Yello, Paradisers! Are you watching BCHUSDT closely? If not, you might be missing out on a critical setup that could define the next big move. Let’s dive in.
💎BCHUSDT has retraced beautifully within a descending channel, a textbook setup that raises the odds of a potential bullish breakout. However, as always, we must be strategic and patient.
💎If BCHUSDT approaches key support zone after triggering inducement and then begins to form a bullish I-CHoCH (internal change of character) on lower timeframes, the probability of an upward move significantly increases.
💎Should the price fail to show any bullish structure and continue to decline, a bounce from the next strong support zone could still be expected. However, the chances of dropping further from that point are relatively low.
💎Panic selling could change the game entirely. If BCHUSDT breaks below the strong support zone and closes a candle beneath it, the bullish thesis is invalidated. In such a scenario, it’s wiser to step back and wait for clearer price action before taking any positions.
🎖 Patience is key, Paradisers! Always wait for the highest probability setups to ensure consistent profitability. Remember, discipline and strategy are what separate the winners from the rest.
MyCryptoParadise
iFeel the success🌴

Is #XRP Ready For a Massive Move or Not? Key Levels to WatchYello, Paradisers! Can XRP bulls muster enough strength to break free, or is the market preparing for another leg down? Let’s dive into the latest analysis of #XRPUSDT:
💎#XRPUSD is currently consolidating within a symmetrical triangle formation, signaling a period of indecision as both bulls and bears battle for control. The immediate focus is on the $2.386 resistance level, which aligns with the descending resistance of the triangle. A decisive breakout above this level would confirm bullish momentum, paving the way for a rally toward the $3.20-$3.40 supply zone. This area represents a significant hurdle, and clearing it could spark renewed bullish sentiment and attract stronger market participation.
💎On the other hand, if #XRP fails to break above $2.386, the price could pull back to retest the strong support levels at $1.965 and $1.712. These zones have been critical in maintaining the bullish structure, acting as a springboard for previous recoveries. A bounce from here would give bulls another opportunity to regroup and attempt to break resistance. However, if CRYPTOCAP:XRP breaks below the $1.712 support, it would signal a bearish invalidation, opening the door for further downside toward the $1.40 demand zone. Such a move would shift the momentum in favor of bears, increasing the probability of a deeper correction.
💎If the price manages to close a daily candle above $2.386, it would validate a bullish breakout and likely fuel the next leg up. Conversely, a daily close below $1.712 would confirm a bearish breakdown, with the potential for #XRPUSDT to retest lower levels.
Stay focused, patient, and disciplined, Paradisers🥂
MyCryptoParadise
iFeel the success🌴

XLMUSDT: Bullish Setup or Reversal on the Horizon?Yello, Paradisers! Are you ready to capitalize on XLMUSDT’s next big move? Let’s break it down!
💎XLMUSDT has been consolidating within a well-defined descending channel, a classic retracement pattern that often sets the stage for a bullish breakout.
💎If XLMUSDT breaks and closes a candle above the resistance level, it would strongly increase the probability of a bullish move, opening the door to significant upside potential.
💎On the flip side, if the price dips to shake out weak hands, key support zones will be crucial. A bounce from these areas, coupled with a bullish I-CHoCH (internal change of character) or reversal patterns like a double bottom (W) or an inverse head and shoulders, would signal strength and increase the probability of a sustained rally.
💎However, discipline is key! If the price breaks down and closes a candle below the support zone, it invalidates the bullish setup. In such a scenario, it’s wiser to wait for clearer and more favorable price action to unfold rather than rushing into a trade.
🎖 This market rewards patience and preparation. Always remember, the goal is consistency, not chasing impulsive moves. Stay disciplined, Paradisers, and let’s crush these markets with sound strategies and precision!
MyCryptoParadise
iFeel the success🌴

RAREUSDT: Is a Bullish Breakout on the Horizon?Yello Paradisers! Could RAREUSDT be gearing up for a strong bullish move, or will a breakdown catch traders off guard? Let’s dive into the critical price action signals you need to watch!
💎RAREUSDT has recently shown good signs of a bullish reversal. The pair took out inducement levels and formed a double-bottom-like structure, a classic signal that increases the probability of an upward move from here.
💎If price retraces further or triggers panic selling, a bounce from the strong support zone below remains a high-probability scenario.To solidify the bullish case, we need to see a bullish I-CHoCH (Internal Change of Character) on the lower timeframes, confirming buyers are stepping in with strength.
💎If RAREUSDT breaks down and closes a candle below the strong support zone, the entire bullish structure will be invalidated. In that case, it’s wiser to remain patient and wait for a better, higher-probability setup to form.
🎖Remember, Paradisers, sustainable trading is about being disciplined and strategic. Waiting for confirmations is always better than chasing trades on shaky grounds. The market rewards those who master patience and trade smartly.
MyCryptoParadise
iFeel the success🌴

Start Your Day Like a Pro TraderLet’s be honest: trading isn’t just about strategy—it’s about how you show up every day. If your mornings feel rushed or scattered, it’s going to carry over into your trading. Over time, I’ve realized the way you start your day can make all the difference.
Here’s a simple morning routine that has helped me find clarity, focus, and confidence in the markets:
1. Take Time to Reset
Before diving into charts or the news, take a moment for yourself. It’s easy to carry yesterday’s stress into today, and that’s not the mindset you want when trading.
-Breathe it out: Spend 5-10 minutes just sitting quietly or meditating. Let the noise settle.
-Set the tone for the day: Ask yourself, “How do I want to approach today? Patient? Focused? Disciplined?” Write it down or just say it out loud.
2. Feed Your Brain
Good decisions require energy, and let’s face it, coffee alone won’t cut it.
-Start with water: A simple glass of water can work wonders to wake up your brain.
-Eat something solid: Go for a breakfast that gives steady energy—oatmeal, eggs, or even a smoothie. You’ll thank yourself later when you’re not crashing mid-morning.
3. Make a Game Plan
Flying blind in the markets is a recipe for stress. Before the bell rings, take a few minutes to prepare.
-Review the big picture: Check global news, economic reports, and overnight market trends.
--Map out your trades : Look at key levels, set your entries and exits, and decide how much risk you’re willing to take. This prep is your safety net.
4. Stay Connected
Trading doesn’t have to feel like a solo mission. One of the best things I’ve done is surround myself with people who understand the journey.
If you’re trying to build better habits or find more consistency in your trading, I’ve been there. DM me for more info or check out my profile—I’m happy to share what’s worked for me. No pressure, just here to help.
Kris/Mindbloome Exchange
Trade What You See
