AAVE Breaks Major Resistance Is a Mega Rally Toward $460 on the Yello Paradisers, are you watching how #AAVEUSDT just exploded past its resistance zone? After weeks of slowly grinding upward inside a clean ascending channel, AAVEUSDT has just delivered a powerful breakout that could open the gates for a major continuation to the upside.
💎This breakout came with strength supported by strong green candles blasting through the previously established resistance zone near $280. The price decisively reclaimed this area, which has now flipped into a fresh support zone. As long as AAVE holds above this reclaimed region, the bullish momentum remains dominant and the probability of continuation grows significantly.
💎From a structural standpoint, #AAVE had been respecting a well defined ascending channel with rising support and resistance levels. Each pullback within the channel has been met with renewed demand, indicating strong market interest at every dip. The recent consolidation at resistance, followed by the aggressive breakout, confirms that the bulls are in control at least for now.
💎Looking ahead, the next visible target is the minor resistance at $357, followed by $380 and ultimately, the major supply zone between $460 and $470. These areas could act as points of reaction, but with momentum on AAVE’s side, the path upward remains technically cleanespecially if volume sustains.
💎On the downside, the invalidation of this bullish structure would come with a sharp drop below the key demand zone at $220. A breakdown below this level would shift the narrative and signal deeper corrective action, potentially opening the path toward the invalidation zone at $170.
Trade smart, Paradisers. This setup will reward only the disciplined.
MyCryptoParadise
iFeel the success🌴
Cryptotraders

Is WLDUSDT Preparing for a Nasty Reversal?Yello, Paradisers! Have you been watching WLDUSDT creeping upward inside that nice channel and thinking this is a breakout in the making? Be careful. This setup might be laying a trap for overconfident bulls—and the signs are getting louder.
💎WLDUSDT is currently trading within an ascending channel, a structure that often signals weakening bullish momentum. The price is approaching a key resistance area, and what makes this zone even more dangerous is the confluence of bearish indicators stacked right on top of each other. We have the 200 EMA acting as dynamic resistance, the 0.618 Fibonacci retracement level overlapping perfectly, and a visible I-FVG (4H) in the same zone. This trio of signals significantly increases the probability of a strong bearish reaction.
💎If the price reacts from this resistance zone, performs an inducement move, and forms a clean bearish structure, we could be looking at a high-probability short opportunity. This would offer a solid risk-to-reward setup for those who are prepared and disciplined enough to wait for confirmation.
💎However, if the price breaks above the resistance and closes a full candle above it, then this bearish thesis will be completely invalidated. In such a scenario, it’s smarter to step back and wait for a clearer, more favorable structure to form. Chasing trades here would only increase the risk of getting caught on the wrong side of a fakeout.
🎖Discipline always wins in the long run, Paradisers. The market rewards those who wait for clean, high-probability setups — not those who trade based on FOMO. If you want to build long-term profitability, you must stay strategic, patient, and act only when everything aligns.
MyCryptoParadise
iFeel the success🌴

RENDER Is $1.366 the Next Stop Before a Major Market Reversal?Yello Paradisers! Are you prepared for the drop that could clean out both bulls and bears before the real move begins? Or will you be caught in another trap?
💎#RENDERUSDT has broken down from its ascending channel. This confirms that bullish momentum has faded, and the structure no longer supports higher prices.
💎The price is now trading below both the 50 EMA and 200 EMA on the daily timeframe. These are key trend indicators. Losing them shifts the bias to the downside. After rejection from the $5.00–$5.40 supply zone, the market failed to make a new high. That area remains strong resistance. Bulls must reclaim it to regain control.
💎Previous support around $4.00 has now turned into resistance. As long as price stays below this zone, lower targets remain in play.The next support is around $2.46, but that may only offer temporary relief. The real demand zone sits near $1.366, where stronger buying interest is expected.
💎Tether dominance (USDT.D) is showing early signs of risk-off behavior. It has reclaimed the 21, 50, and is now testing the 200 EMA at 4.88%. This suggests capital is rotating out of altcoins and into stablecoins.This shift is backed by rising volume. It's not retail noise it’s institutional positioning. The market is preparing for a deeper correction.
Stay disciplined. The next big opportunity will come to those who wait not those who chase.
MyCryptoParadise
iFeel the success🌴

TON Looks Ready to Collapse — Is This the Start of a Bull Trap?Yello Paradisers! what if TON is about to reverse hard—are you positioned correctly, or will you be caught chasing the wrong move?
💎TONUSDT is showing clear bearish signs that can’t be ignored. The price has broken down from an ascending channel—a classic early signal of weakness. But that’s not all. This breakdown happened right at the resistance zone, and it’s backed by a clear bearish divergence on momentum indicators. Adding to the conviction, there’s a 1H Fair Value Gap (FVG) sitting right in that same region, which often acts as a magnet for price before continuation to the downside.
💎This confluence significantly increases the probability of a bearish move in the short term. So, what’s the plan?
💎For risk-averse (safe) traders, the optimal approach is to wait for a pullback and retest of the broken structure. This allows for a cleaner entry and a much better risk-to-reward (RR) ratio. For the aggressive players, there’s potential to enter with reduced size from the current level, understanding that it carries more risk without confirmation.
💎However, if the price manages to break out and closes candle above the resistance zone, this entire bearish setup becomes invalidated. In that case, the smart play is to stay patient and wait for a more favorable structure or price action to develop.
🎖If you want to be consistently profitable, you need to be extremely patient and always wait only for the best, highest probability trading opportunities.
MyCryptoParadise
iFeel the success🌴

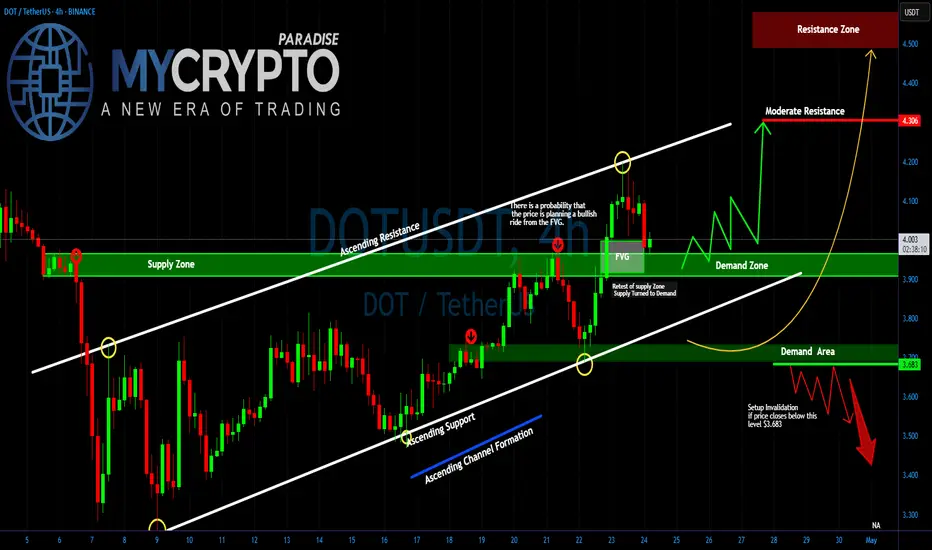
DOT/USDT About to Explode or Crash?Yello Paradisers! Are you ready for DOT's next explosive move, or will you be caught in the trap again? Right now, #DOTUSDT is sitting at a key decision point inside a textbook ascending channel — and what happens next could either print profits or wipe out the unprepared.
💎After respecting both the ascending resistance and support lines with high precision, it has now pulled back into a crucial area of interest: the Fair Value Gap (FVG). If DOT continues to hold above this level, the probability of a bullish continuation increases significantly. The area around $3.90–$3.95 is aligning perfectly with the demand zone, adding to the confluence and giving bulls a strong foundation to build on.
💎However, the real test lies ahead. POLKADOT must clear the immediate resistance around $4.10–$4.30 for the bullish momentum to gain traction. A successful break and retest of the $4.30 level would likely open the doors to a fast move toward the high-value resistance zone at $4.50 and above.
💎But here’s the twist: if DOT fails to defend the demand zone and instead closes below $3.683, the entire bullish setup becomes invalid. Such a breakdown could trigger a deeper correction, targeting the $3.40 region and possibly flushing out the overleveraged players in the process.
Stay focused, Paradisers. Be the hunter, not the hunted
MyCryptoParadise
iFeel the success🌴
AVAX Bulls Walking into a Trap? Yello Paradisers, are we on the edge of a clean breakout or is AVAX setting up the perfect trap before flushing the late bulls?
💎#AVAXUSDT has recently broken above a critical resistance zone and is now attempting a retest. This move appears strong on the surface, but it sits at a dangerous pivot—one that could determine the short-term direction in the days ahead. The structure is unfolding within a clean ascending channel, with both resistance and support levels well respected. These rising boundaries give the breakout credibility, but they also highlight how vulnerable the setup is if key support levels fail.
💎Right now, the level that previously acted as resistance is being tested as support. This is the moment of truth. If the price continues to hold above this level with strength and volume, we’re likely in for a continuation toward the next resistance level around $22.40. But the real test for bulls will come at the $23.00 region, where heavy profit-taking and increased selling pressure are highly likely. That’s where the larger players will look to trap over-leveraged longs and reposition.
💎But this bullish outlook comes with a clear condition and it’s non-negotiable. If #AVAX fails to hold $21.00 and begins closing candles back inside the previous range, the move instantly loses its legitimacy. In that case, our focus turns to the strong demand zone between $20.20 and $20.40. A reaction from this area could still save the structure, offering a potential reload for a bounce. But if this level gives way, the entire bullish setup is invalidated and what was once a breakout turns into a confirmed bull trap.
Trade smart, Paradisers. This setup will reward only the disciplined.
MyCryptoParadise
iFeel the success🌴

TAOUSDT at a Crucial Level – Breakout or Breakdown?Yello, Paradisers! Is TAOUSDT gearing up for a strong bounce, or is a deeper correction on the horizon? Let’s break it down.
💎TAOUSDT has completed a healthy retracement, forming a descending channel alongside a Dragon Butterfly candlestick pattern—both backed by high volume. Historically, when this pattern appeared with strong volume, we saw a solid upside move. This time, we also have a bullish divergence, adding confluence to the bullish case. However, to increase the probability of a breakout, we need to see price breaking above the descending channel with strong volume.
💎Now, what if price drops further or shows panic selling? In that case, we must wait for clear bullish confirmations before jumping in. Ideal signals include - Bullish I-CHoCH formation, W pattern or Inverse Head and Shoulders on lower timeframes. Any of these would significantly increase the probability of a strong bounce from the strong support zone.
💎 However, If price closes a candle below the strong support zone, it will invalidate our bullish outlook. If that happens, the best move is to stay patient and wait for better price action before considering any long positions.
🎖Patience is what separates pros from amateurs. If you want to make it in this game, trade smart, stay disciplined, and always wait for high-probability setups. The market will always test your emotions—don’t let it break your strategy.
MyCryptoParadise
iFeel the success🌴

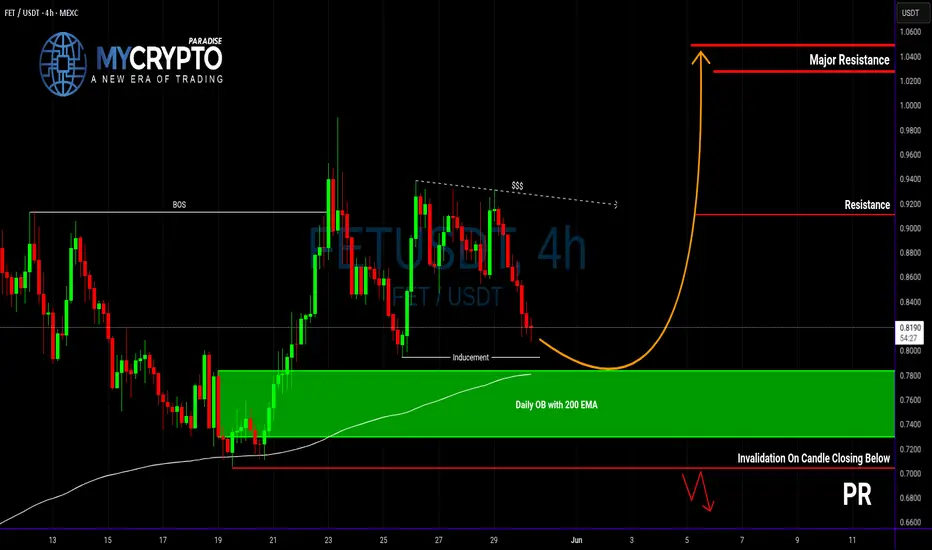
FET at a Make-or-Break Level... Will It Bounce or Break Down?Yello Paradisers, are you watching FET closely right now? If not, you might miss a textbook high-risk, high-reward setup that could play out very soon—just like we’ve been anticipating in our previous updates.
💎FETUSDT is currently respecting a bullish market structure, and price action is aligning for a potential inducement grab.
💎If this inducement occurs, and we start to see bullish confirmation signals from the Daily order block, backed by the 4H 200 EMA, then the probability of a strong bounce increases significantly. From a risk-reward perspective, this zone is shaping up to offer a solid long entry with clean invalidation.
💎But here’s the other side of the coin: if the price breaks down through the order block and closes a candle below our invalidation level, the bullish bias will be completely invalidated. In that case, patience becomes the strategy, and we’ll be waiting for more convincing and clearer price action to realign with a new setup.
🎖Strive for consistency, not quick profits. Treat the market as a businessman, not as a gambler.
MyCryptoParadise
iFeel the success🌴
JUPUSDT Breakout... or Classic Bull Trap?Yello Paradisers are you truly prepared for one of the cleanest and most deceptive setups we've seen on JUPUSDT in weeks? A decisive move is building, but so is a very well-placed trap and only those who remain disciplined will navigate it safely.
💎#JUPUSDT has broken above a key resistance level that has rejected price action several times in the past. That same level is now being tested as support, and the market’s reaction here will be crucial. If this retest holds, we could see a continuation of the bullish structure with strong upward momentum. But this is precisely where many get caught assuming it’s a straightforward breakout, when in fact it could be the final bait before the flush.
💎The level at $0.5870 is now our line in the sand. If price remains above it, what we are witnessing is likely a healthy pause and consolidation before another impulsive leg upward. However, if $0.5870 fails, the next area of interest is the demand zone near $0.4718. A sharp move into this region could trap late bulls and shake out weak hands. The key will be whether buyers step in aggressively on that dip. A fast and strong rebound from the demand zone would confirm renewed strength, offering a potential high-probability long entry but only if the reaction is immediate and decisive.
💎To the upside, we are watching the moderate resistance around $0.7865, which could slow the move briefly. But the real game begins near the major supply zone at $0.8992. That’s where we expect smart money to begin unloading positions and anyone serious about preserving profits must be prepared to react accordingly.
💎However, if the price fails to hold even the demand zone and breaks below $0.4718, the entire bullish setup gets invalidated. That becomes our structural flip level, and if breached, we’ll turn bearish and prepare for further downside and potential lower lows.
Discipline, patience, robust strategies, and trading tactics are the only ways you can make it long-term in this market.
MyCryptoParadise
iFeel the success🌴

This Hidden Altcoin Could Explode—But Only If THIS Level Holds!Yello Paradisers, have you seen what’s quietly brewing on REZUSDT? A high-probability bullish reversal setup is forming, and if this level holds, it could lead to one of the cleanest altcoin plays we’ve seen recently. This isn’t just about one signal—REZUSDT is showing a rare confluence of bullish indicators that deserve your full attention.
💎Currently, REZUSDT is moving within a descending channel while printing a bullish divergence on momentum indicators. At the same time, a textbook W-pattern has just formed, and what makes this even more significant is that it’s happening right at a support zone. This triple confluence—descending channel, bullish divergence, and W-pattern at support—is increasing the probability of a bullish breakout in the coming sessions.
💎From an entry perspective, those looking for more favorable risk-to-reward (RR) could benefit from a deeper pullback. That would offer a higher probability setup and tighter risk management. However, for aggressive or short-term traders, the current level still offers a 1:1 RR, which, while not optimal, is acceptable under strict trade management and position sizing.
💎That said, there’s a critical invalidation point that must be respected. If the price breaks down and closes a full candle below the support zone, it would invalidate the entire bullish structure. In such a case, the only professional move is to stay out and wait for cleaner confirmation or a better-developed setup. There is no room for hope in trading—only strategy and discipline.
🎖Strive for consistency, not quick profits. Trade smart, Paradisers. This setup could be a gift for the patient and a trap for the impulsive. The key is always the same—discipline, patience, and strategic execution. Stay sharp, stay focused, and keep protecting your capital.
MyCryptoParadise
iFeel the success🌴

UNIUSDT: A Massive Bullish Move Loading… or a Trap?Yello, Paradisers! Is UNIUSDT finally gearing up for a major breakout, or is this just another fake move before a deeper correction? Let’s break it down.
💎UNIUSDT is currently trading within a descending channel, increasing the probability of an upcoming bullish move. The key support zone is holding strong, and we might be witnessing the early signs of a double-bottom formation—a classic reversal pattern.
💎However, confirmation is everything in trading. To increase the probability in our favor, we need to see: Bullish divergence, Bullish I-CHoCH (Internal Change of Character), Bullish reversal patterns such as a W-pattern or inverse head and shoulders from our support zone.
💎If UNIUSDT retraces further, we expect a bounce from the strong support zone—but again, we must wait for clear bullish confirmations before taking any positions.
💎The invalidation level? If price breaks and closes candle below the strong support zone, the entire bullish setup gets invalidated. In that case, we wait patiently for better price action before considering any new trades.
🎖Patience and discipline are key, Paradisers. Many traders will get trapped in bad positions, but those who wait for the right confirmations will be the ones making money. Trade smart & stick to high-probability setups only.
MyCryptoParadise
iFeel the success🌴

Is SUSHIUSDT About to Bounce or Break? Yello, Paradisers! SUSHIUSDT is setting up an intriguing scenario after reacting to a key resistance trendline. Let’s break this down:
💎If SUSHIUSDT shows a bullish I-CHoCH (Internal Change of Character) from the key support zone—previously a resistance level—it could signal a higher probability of a bounce. However, patience is key here; we need to wait for confirmation of a bullish I-CHoCH on lower timeframes to take action.
💎On the flip side, if the price experiences further drops or shows signs of panic selling, the best approach would be to wait for it to reach a stronger support zone. At that point, we’d need to look for bullish patterns such as A W formation or An Inverse Head and Shoulders on lower timeframes to stack the odds in our favor.
💎If the price breaks down and closes a candle below the strong support zone, it will invalidate the bullish thesis entirely. In that case, it’s smarter to wait for a clearer structure to develop before considering any entries.
🎖 Remember, Paradisers, disciplined trading is the only way to achieve long-term success. Avoid impulsive decisions and always prioritize confirmation over speculation. The market rewards patience and preparation—stay sharp, stay focused.
MyCryptoParadise
iFeel the success🌴

ADA Is Approaching a Trap Zone ? Yello Paradisers, are you watching how ADA is slowly coiling up near a crucial level while pretending nothing’s happening? Don’t be fooled — this is the calm before the storm, and the next move could wipe out the unprepared.
💎#ADAUSDT is currently respecting a well-established ascending channel. We’ve already seen three meaningful reactions at the ascending support, each triggering fresh bullish momentum. At the same time, the price is pressing just above a key demand zone around the $0.73–$0.74 region. This level remains absolutely critical for the bulls to defend if the structure is to remain intact.
💎What adds strength to this setup is #ADA’s current trading position above both the 50 EMA and 200 EMA on the daily timeframe. This reinforces the short-to-mid-term bullish bias. The 50 EMA is starting to slope upward, signaling that momentum could be gradually building, while the 200 EMA sits well below as solid structural support.
💎As long as the price continues to respect the ascending support line and stays above the demand zone, we expect a continuation move toward the $0.8728 moderate resistance. A successful break and close above that could open up the next leg toward $1.0011, where a strong supply zone sits waiting.
💎The real danger lies below $0.6495. A daily close under this level would not just invalidate the current setup it would completely shift market structure and expose ADA to deeper downside, likely towards the $0.60 area or lower.
Discipline, patience, robust strategies, and trading tactics are the only ways you can make it long-term in this market.
MyCryptoParadise
iFeel the success🌴

SNX About to Explode or Collapse?Yello Paradisers, are you watching SNXUSDT closely? Because if not, you might be missing one of the cleanest opportunities for bulls in this current market cycle. The setup is forming right at a critical decision point — and how price reacts here could define the next major move.
💎SNXUSDT is currently showing a bullish internal CHoCH (Change of Character) while trading directly inside a strong support zone. This zone isn’t just standing alone — it’s backed by the powerful 200 EMA and a well-respected support trendline. This confluence of support significantly increases the probability of a bullish bounce from this level, making it a high-reward setup for those paying attention.
💎Zooming out to the higher timeframe, the structure becomes even more interesting. SNXUSDT appears to be forming a bull flag pattern — a bullish continuation signal that often precedes explosive upside moves. When such a formation aligns with key support zones, it suggests that the market is simply consolidating before the next leg up.
💎However, traders must proceed with caution. If price breaks down and closes below the current support zone, this would invalidate the entire bullish scenario. In such a case, it’s best to step aside and wait for better confirmation rather than rushing into a compromised setup. Emotional decisions are the fastest way to ruin sound trading strategies.
🎖Strive for consistency, not quick profits. Treat the market as a businessman, not as a gambler. Discipline, patience, and strategic entries will always outperform emotional trades. Stay focused, Paradisers — the opportunity will always favor those who are prepared.
MyCryptoParadise
iFeel the success🌴

WIF/USDT About to Explode or Collapse?Yello Paradisers, have you prepared yourself for what’s about to unfold on SEED_WANDERIN_JIMZIP900:WIF ? Because this setup is screaming opportunity but only for those who are ready to act with precision and patience.The current price structure is forming a classic descending wedge, a pattern that historically resolves with explosive moves. But here’s where it gets really interesting.
💎#WIFUSDT is now grinding toward a key demand zone between 0.82 and 0.87, where there is a high probability of a strong rebound. This zone aligns perfectly with the 50 EMA, further reinforcing the potential for a bullish reversal.
💎If the demand holds, we could easily see price break out from this compression pattern and push toward the moderate resistance near 1.22. Above that, the major resistance zone around 1.42 to 1.45 remains the next magnet a zone where large players are likely to take profit or even reverse positions.
💎However, we’re not ignoring the bear case either. If this demand fails to hold, and the price we are expecting for a bullish rebound from the lower demand at $0.719 closes below 0.642, the setup becomes invalidated, and the door opens for a deeper correction—possibly driving price toward or even below the 0.50 level. That would flush out overleveraged positions and trap breakout traders on the wrong side once again.
Patience and precision will be your edge in this volatility. Be a pro. Trade smart. Stay disciplined.
MyCryptoParadise
iFeel the success🌴

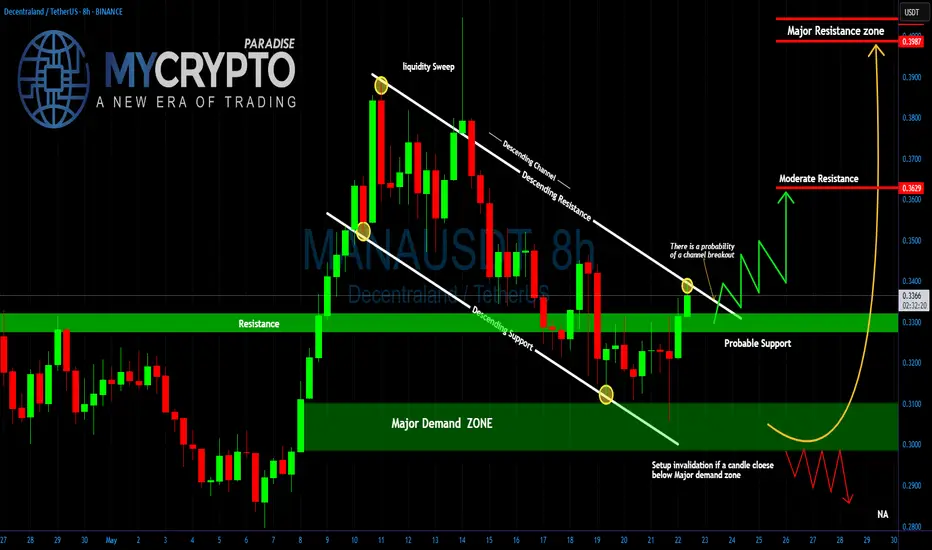
Is MANA About to Break Out?Are You Ready for It?Yello Paradisers, can you feel the calm before the storm? MANAUSDT is quietly setting up for what could become a major breakout move and most traders won’t see it coming until it’s already too late. That’s exactly the kind of opportunity we love to prepare for in advance.
💎#MANAUSDT has been consolidating inside a clearly defined descending channel, marked by consistent lower highs and lower lows since its liquidity sweep above $0.39. This cooling-off phase has allowed the market to reset after that aggressive move, but now, the structure is starting to shift.
💎What’s important here is the price action around the horizontal resistance-turned-support level near $0.33. Price is currently hovering just above this zone, and early signs of a breakout are beginning to show. A clean candle close above the descending resistance of the channel will be the confirmation signal that many smart traders are waiting for and it could set off a wave of FOMO driven momentum.
💎Below the structure, we see a well-defined major demand zone between $0.2950 and $0.3100. This is where buyers stepped in aggressively after the channel lows were tested. As long as price stays above this zone, the bullish setup remains valid. However, if we get a confirmed candle close below that demand zone, the entire structure becomes invalidated, and further downside becomes likely.
It’s not about catching every move it’s about catching the right ones with proper validation and risk control. Trade smart, Paradisers.
MyCryptoParadise
iFeel the success🌴
FETUSDT : Massive Opportunity or Fakeout Trap?Yello Paradisers, have you been watching FET lately? If not, now is the time to pay close attention—because this setup could be gearing up for a serious move, and missing it might mean missing one of the cleanest opportunities this month. Let’s break it down before it’s too late.
💎FETUSDT is currently displaying a bullish market structure on the higher timeframes, signaling growing strength beneath the surface. Even more compelling is the fact that it has just formed a classic falling wedge pattern—a powerful reversal setup—paired with a bullish divergence. This combination significantly increases the probability of a bullish breakout from current levels.
💎Right now, price is sitting right on a key support zone, which is reinforced by the 200 EMA. This confluence of support gives added confidence to the setup and boosts the probability of an upside move. The risk-to-reward ratio from this zone is also highly attractive, making this one of those clean opportunities that traders should never ignore. The bullish outlook remains valid as long as price holds above our invalidation zone.
💎However, if the price breaks down and closes below this invalidation level, then the entire bullish idea is off the table. In that scenario, it’s wiser to stay patient and wait for stronger, more reliable price action to develop before re-entering the market. There’s no need to rush a trade when better setups are always around the corner.
Discipline, timing, and execution will always separate the professionals from the crowd. Stay focused, Paradisers—the market rewards those who move with purpose, not panic.
MyCryptoParadise
iFeel the success🌴

LTC will this Demand Zone Trigger a Reversal or a Full Crash?Yello,Paradisers! Is this the calm before a major bounce, or the final warning before Litecoin breaks down completely? This current zone is absolutely critical ignore it, and you risk missing the next big move.
💎#LTCUSDT has completed a strong 5-wave impulsive move within an ascending channel. The recent correction has now brought the price back down into a very important demand zone near $90. This level isn’t just a random number it’s sitting right on top of a previous major support zone that held back in early April, just before the entire leg up began.
💎Price is now also testing the lower boundary of the ascending channel. As long as #Litecoin holds this demand zone between $90 and $93, the bullish structure remains intact. This could be the perfect reload zone for bigger players preparing for the next leg up. If the price begins to form higher lows from here and reclaims the $96–98 region with strength, it could open the path toward the moderate resistance at $110. And if that level breaks with momentum, we’re likely looking at a full extension into the major resistance above $115.
💎However, if #LTC closes a candle below major support at $80 with volume and structure confirming the breakdown, the setup will be invalidated. In that case, we’re potentially heading for a much deeper flush into the $72–75 range, which aligns with the next HTF liquidity pool and potential weekly support.
Stay sharp, Paradisers. The market will soon decide and if you're ready, you'll be on the right side of the move.
MyCryptoParadise
iFeel the success🌴

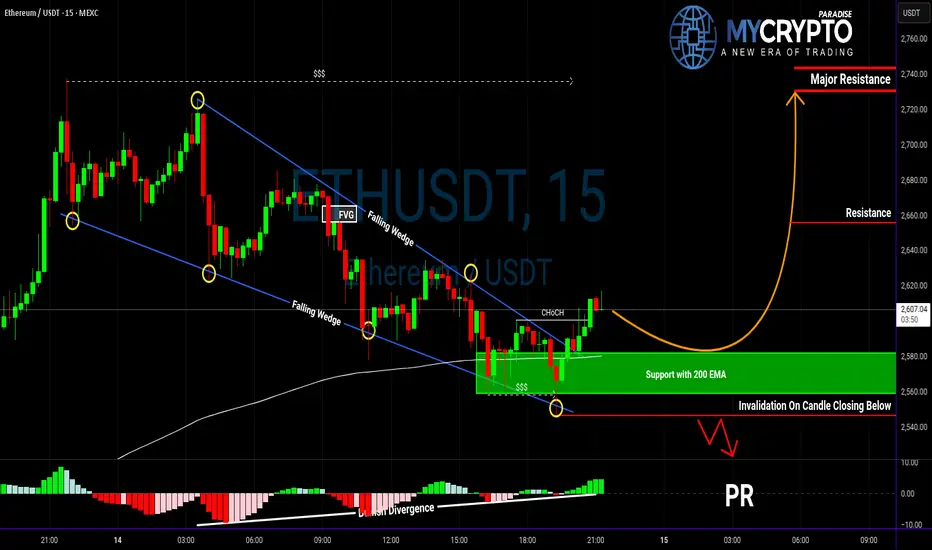
ETH Bulls on Alert: Is This the Move We've Been Waiting For?Yello Paradisers, did you catch that bullish breakout on ETH or are you still stuck waiting for confirmation?
💎Ethereum has officially broken out of its falling wedge pattern, which is a well-known bullish structure often signaling a trend reversal. What gives this breakout even more weight is that ETH has established a support zone exactly at the 200 EMA—an area that historically acts as a key level for institutional traders.
💎Adding to the bullish case, we’ve also identified a bullish divergence on the momentum indicators, which often suggests weakening selling pressure and the potential for upside. More importantly, there has been a clear bullish CHoCH (Change of Character), confirming that market structure is shifting in favor of the bulls. With all of these signals aligning, the probability of a continued bullish move is significantly higher.
💎However, the most disciplined traders understand that no setup is perfect without confirmation. A pullback to the support zone would offer a textbook opportunity for a high-risk-to-reward entry—ideal for bulls who are patiently waiting for a safer entry point rather than chasing the move. This kind of setup allows us to manage our risk properly and act only when the odds are clearly in our favor.
💎That said, if the price breaks down and closes below the support zone, the bullish idea is completely invalidated. This is the level where we draw the line and step aside. Being able to invalidate your own bias is what separates traders who survive from those who don't.
🎖We are playing it safe right now. If you want to be consistently profitable, you need to be extremely patient and always wait only for the best, highest probability trading opportunities.
MyCryptoParadise
iFeel the success🌴
GLMR Explosion or Final Trap? Yello Paradisers — are you truly ready for one of the cleanest, most deceptive setups we’ve seen on GLMR in weeks? If you’ve been following our latest insights, you already know — this is not the moment to get distracted. A decisive move is on the horizon… but the trap is also well set. The only question is: will you be the one who catches it or gets caught?
💎#GLMRUSDT has just completed a clear 5 wave rising wedge, a classic structure that often signals the end of a move and it has now pushed directly into a key resistance zone. This level has rejected price multiple times in the past (as previously marked), and unsurprisingly, price has stalled here once again.
💎The support at $0.095 is now critical. If this level holds, this current pause could easily evolve into a bullish consolidation before the next impulsive leg upward.But just below, we’re eyeing the demand zone near $0.085. If the $0.095 support breaks and price dips into this zone, we’ll be watching for signs of aggressive buying. A fast rebound here could present a golden long entry, but only if we see clear strength returning immediately after the retest.
💎To the upside, our next moderate resistance lies at $0.1313, and beyond that, the real game begins in the major supply zone between $0.145 – $0.155. That’s where smart money will likely begin distributing their positions, and you should be ready to follow.
💎However, if price breaks below $0.0709, the entire bullish structure gets invalidated. That becomes our flip level — if breached, we will turn bearish and prepare for lower lows.
Discipline, patience, robust strategies, and trading tactics are the only ways you can make it long-term in this market.
MyCryptoParadise
iFeel the success🌴

ADA Breakdown Ahead? Don’t Let This Bull Trap Fool YouYello Paradisers—are you ready for what could be a classic trap before a deeper drop? ADAUSDT is flashing multiple bearish signals that are difficult to ignore, and if you're not paying attention, this setup could catch you off guard.
💎ADAUSDT recently took a firm rejection from a key resistance zone, failing to push higher. Following that, price action broke down from a well-formed descending channel, and we’ve now seen a clear bearish Change of Character (CHoCH). These three factors together significantly increase the probability of a bearish continuation.
💎If ADAUSDT pulls back and grabs liquidity, that could offer a highly favorable opportunity to enter on the short side. The ideal scenario would be a return to the resistance zone, followed by the formation of bearish price patterns—such as rejections or bearish engulfing candles. This would confirm the intent to move lower and offer a strong risk-to-reward short setup.
💎However, if the price manages to break and close decisively above the resistance zone, this would invalidate the current bearish outlook. In that case, it's critical to remain patient and wait for cleaner, higher-probability price action to form. Forcing trades in an uncertain setup can lead to unnecessary losses, so discipline is essential here.
Strive for consistency, not fast profits. The most successful traders are the ones who wait for the market to show its hand clearly. Stay focused, stay sharp, and trade smart.
MyCryptoParadise
iFeel the success🌴

XRPUSDT on the Edge: Is a Major Breakdown Coming? Yello Paradisers! Are you ready for what could be a huge bearish trap unfolding right now on XRPUSDT?
💎Currently, XRPUSDT is flashing serious warning signs. The formation of a rising wedge pattern is significantly increasing the probability of a bearish move. When analyzing the broader market structure, it appears this recent uptick is merely a retracement within the larger bearish trend—keeping the probability on the bearish side still very high.
💎If XRPUSDT bounces, grabs liquidity and starts forming clear bearish patterns from that resistance area, it could set up an excellent opportunity with a high risk-to-reward (RR) ratio for shorts.
💎However, if the price breaks out and closes a candle clearly above the resistance zone, our bearish thesis will be invalidated. In that case, it would be much smarter to stay patient and wait for a more reliable price action setup before considering any new trades.
🎖Remember Paradisers, the key to surviving and thriving in this market is to stay disciplined, patient, and smart. Trade what you see, not what you feel! Stick to the plan, and never rush decisions under emotional pressure. Play it safe, and stay focused—our time will come!
MyCryptoParadise
iFeel the success🌴

SHIBUSDT Is Flashing Major Bearish Warnings – Are You Ready??Yello Paradisers, Have you been keeping an eye on SHIBUSDT? If not, now is the time. The market is showing clear signs of weakness that could lead to a significant bearish move, and many traders may not be prepared for what’s coming.
💎SHIBUSDT is currently looking bearish after forming a clear bearish Change of Character (CHoCH) on the higher timeframe. Adding to this, the price action on the lower timeframe is showing an internal Change of Character (I-CHoCH) originating from a 4-hour bearish Order Block (OB). This setup substantially increases the probability of a continuation to the downside.
💎What we are focusing on now is the potential pullback. If SHIBUSDT pulls back to fill the Fair Value Gap (FVG) or develops a bearish pattern from the Order Block, it would provide a strong short opportunity with an excellent risk-reward profile.
💎However, it is crucial to remain cautious: if the price breaks out and closes a candle above the identified Order Block, it would completely invalidate the bearish idea, and we would need to step aside from any short positions.
Remember, Paradisers, sustainable trading success comes from patience and disciplined execution. There is no need to rush. Waiting for confirmation will always keep you on the winning side. Be smart, wait for the right setup, and always trade like a professional. This is the only way you will make it far in your crypto trading journey.
MyCryptoParadise
iFeel the success🌴
