DOGE growThere is a tradition in Crypto world to say, that when DOGE start to grow, alts season begins. Can't say its absolutely true, but if you think of DOGE, as a symbol of absolute worthless coin having no fundamentals of future development roadmap, it becomes very logical, that if THAT coin start to grow, any other shitcoin should =)
Cryptotrades

ETH longWhat a nice direction fibonacci based MAVW (navy color) draw =)
Red zone between roughly 189 and 191 is resistance, that has most chances of rejecting ETH price back. And it might do so at the first test. But in case of breakout targets are 195 - 200 - 205

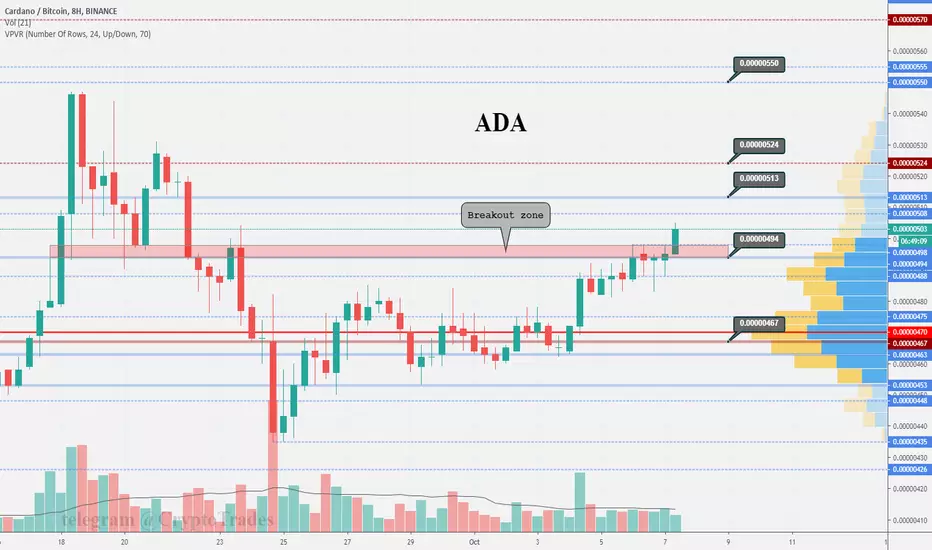
ADA breakoutDA finally breakout 500 resistance. Look bullish. Nearest targets marked on chart - 515 - 535 - 550.
NEO bottomedNEO doesn't make huge moves, at least recently. But now looks like found the bottom, so in case of hodling might bring some good profits.
Buy zone 1/3 size +/- 905-910
Buy zone 2/3 size +/- 888 (sell <900 or hold for targets)
Main target 955 (~5%)
Bonus targets 990 - 1050 - 1100 loss below 870 (~2.5% from average cost)

This is HOTAnyone feel HOT? Exponential moving averages show that HOT is close to potential reversal. Won't risk entering a coin worth 8 satoshi, but can't deny what I see - it can easily make 50%

Just look at this beautyETH has such a nice profit potential, just like BTC, it missed couple of support zones that are now resistances acting like a magnet to the price. Most obvious at 181.7 already hit. Next comes 190 and 197.
Of cause better enter lower around 175-177

ETH bullish but pulling backOn September 24th ETH received huge volume bouncing from ~190 support, and now seem to fight for the uptrend. Resistance at 207 push it down, so we may expect next bounce to happen around 202-203 (considering we expect bullish scenario). If drop below 195-197 will be the next support to hold for.

Litecoin dump targetsSince we are all bearish for BTC, LTC price in dollars should also drop. This is the plan for the upcoming month. Not necessary will go down to the bottom, but we may expect second leg coming after a small bounce back to 60.

BTC descending triangle and targetsHope I saved you 10-15% yesterday by warning about upcoming dump. Since classical TA worked out well so far (1st warning was given on 9th of September), I'll add another quote from John Murphy (I personally consider this book a TA bible): "The measuring technique is the height of the triangle (AB) projected down from the breakout at point C".
Take height of triangle ~4500 and subtract it from 9300 = 4800$. That is our target. Time distance can be measured by drawing a parallel channel from triangle. So we have 25th October as target date. Lets see if this forecast comes true.

BTC finally dumped, but bounce expectedAs forecasted, price found first support at ~9600. Got some volume back, but at day chart it is still decreasing. That was the first stage, that leaves both bearish and bullish scenarios open. Surely the picture is bearish and going long seems to be too risky now. Dominance grown near 70.8 resistance, so we may expect it to pull back a little, letting alts breath out and recover small % from yesterday dump. In current situation I do not recommend alts over trading. Just close the position you had and look for dip buys for future ones. Whatever will be the direction, alts will dip again.
If I was whale, I would push price up to collect liquidity in bull trap around 9850 - 10000 range, the higher, the more retailers will jump in there. That would be a perfect spot to dump it lower.
BTC dominance growing as King fallsBTC dominance started to grow on September 18th and since then constantly increasing. But alts got dumped only when BTC price fell. Currently market money are located in USD and BTC mostly. When market makers will see, that BTC stabilized, we will see alts come back. But that is possible only with stable dominance chart and BTC price. So far BTC only bounced from 9600 and that doesn't end bearish momentum.

XRP chart reviewMost obvious scenario came true and XRP fell down to 0.27 support and bounced twice. Bearish momentum is slowing down, although it may test same support again. Scalp to 0.28 resistance is possible now. Thats ~2% multiplied by up to 25x leverage at ByBit.
Last telegram post: XRP slowly falling forming a descending triangle with lower highs at each step. If broke down, support levels for bounce are at ~0.28-0.283 and ~0.27. If breakout, nearest resistance at 0.297 and 0.302.

Wow BTC volatilityBTC had a bearish chart for many past days and today it was even worse. But that wick down and up, that covered 600 USD in 30 minutes makes me think, that there might be a reversal of trend. More of a hope, as volume on bigger timeframe is still low and not enough to call the reversal. We need day chart to show some volume pump - then it will be it. After all, nobody promised BAKKT will make the change in the first hour it opens.

EOS at supportDon't feel too much bullish about EOS despite hard fork it has. But in the end, all depends if current support at 3.7-3.75 will push price up, or let it through. Bouncing would be a very good signal for new uptrend and even if not, it will still be able to get to 3.88 - 3.97 - 4.05. If break down, next support at 3.55 should bounce the price.

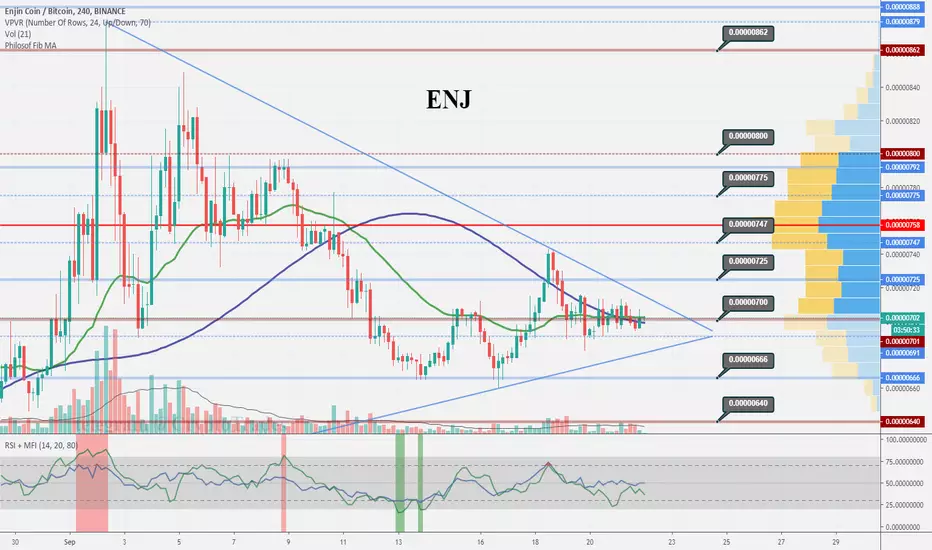
ENJ getting ready for the moveEnjin been squeezing into narrow channel and almost ready to make the move within 1-2 days. Chances are equal, and depend on BTC (which seem to be falling, but you never know), but looks promising
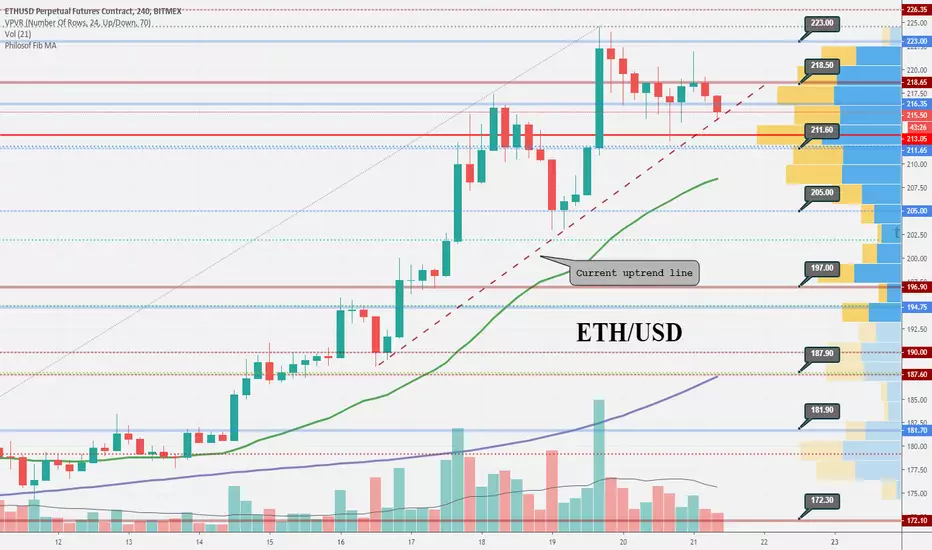
ETH will fall if BTC doesOK, so we have BTC potentially falling, so Ethereum price should do the same. Where we may expect it to bounce? Nearest support zones are at 210-211, then 205, then 195-197. Support zones are targets for shorts and potential long entries.
Nearest resistance is at 216 and 218 - consider it as short entry zone
WTC near breakoutWTC getting close to resistance level, that was tested several ties already, and if breakout, will cause price impulse move.

ELF accumulationHad this coin in plans since end of August, but its accumulation period last much longer than expected, although 8% profit was already collected and trade closed. Now it is time to open it again. Expecting to see it pullback a little once again and then finally move towards marked targets.

XLM bullish volumeStellar shows some bullish volume last 4 hours, bouncing from 555 support. Would have called long trade, if not BTC, that worries me and I expect it to do some sharp move soon, that will cause alts to dip. But alts still do have at least half a day for some bullish action, Lets see it XLM will make it through the trendline.

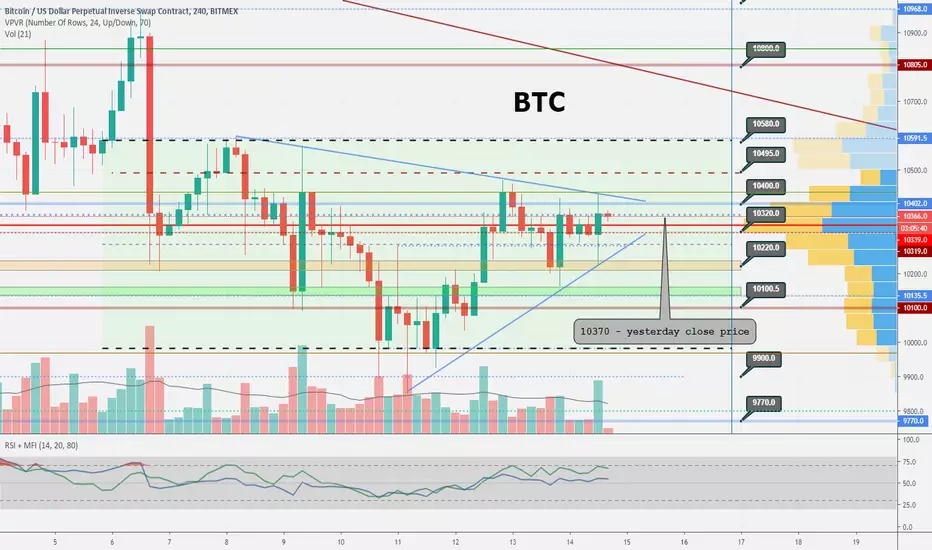
Parallel channel BTCRevised Bitmex chart a little. Descending parallel channel broken and no longer valid. Trading range of new horizontal parallel channel is 10000 - 10600. Blue vertical line at the end of channel is approximate 0.75 length of grand Triangle. Either sharp impulse before it, or moving within this channel uncertain time
P.S. Most of last 4H volume came from that wick dump - bull trap. But I'm sure we will see more bulls in the nearest time.
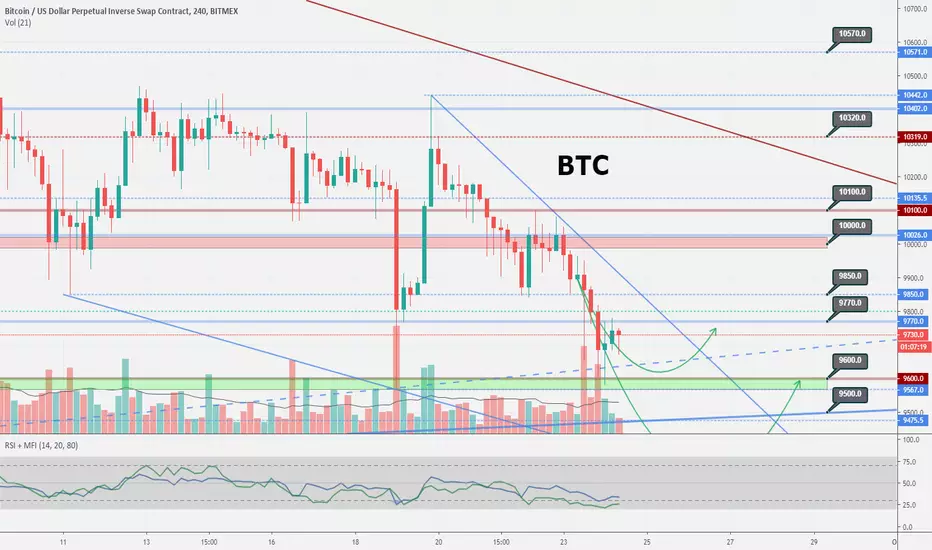
BTC falling wedgeThis bullish pattern is very popular as it is easy to spot and works very often. Usually we see it at alts charts, but this time the King himself showed it. So if it work out, we may expect BTC to bounce from ~9800. If it fails, it will fall lower to 9600-9300. If grand triangle will broke down, we will see much lower values.

FUEL accumualtionFUEL been moving sideway for some time. Nice accumulation zone, from where it can pump to profits starting from 20%

IOTX bullishPossible reversal here for IOTX, or at least start of consolidation period, after which it can give nice profits. Main targets marked on chart.
