GLMR Explosion or Final Trap? Yello Paradisers — are you truly ready for one of the cleanest, most deceptive setups we’ve seen on GLMR in weeks? If you’ve been following our latest insights, you already know — this is not the moment to get distracted. A decisive move is on the horizon… but the trap is also well set. The only question is: will you be the one who catches it or gets caught?
💎#GLMRUSDT has just completed a clear 5 wave rising wedge, a classic structure that often signals the end of a move and it has now pushed directly into a key resistance zone. This level has rejected price multiple times in the past (as previously marked), and unsurprisingly, price has stalled here once again.
💎The support at $0.095 is now critical. If this level holds, this current pause could easily evolve into a bullish consolidation before the next impulsive leg upward.But just below, we’re eyeing the demand zone near $0.085. If the $0.095 support breaks and price dips into this zone, we’ll be watching for signs of aggressive buying. A fast rebound here could present a golden long entry, but only if we see clear strength returning immediately after the retest.
💎To the upside, our next moderate resistance lies at $0.1313, and beyond that, the real game begins in the major supply zone between $0.145 – $0.155. That’s where smart money will likely begin distributing their positions, and you should be ready to follow.
💎However, if price breaks below $0.0709, the entire bullish structure gets invalidated. That becomes our flip level — if breached, we will turn bearish and prepare for lower lows.
Discipline, patience, robust strategies, and trading tactics are the only ways you can make it long-term in this market.
MyCryptoParadise
iFeel the success🌴
Cryptotrading

"BTCUSD Smart Money Setup: Fair Value Gap + Weak Highs🚨 Bitcoin (BTCUSD) Smart Money Play Unfolding!
Let’s break down what’s happening on this 15-minute BTCUSD chart and why we could be gearing up for a powerful bullish reversal:
📍 Liquidity Sweep + Market Structure Shift
Price aggressively pushed into a weak low, grabbing liquidity from late sellers and stop orders. Smart Money behavior detected as price forms a potential Change of Character (ChoCH) at a discount zone.
This shift signals a transition from bearish pressure to potential bullish intent.
📍 Fair Value Gap (FVG) as Re-entry Zone
We’ve marked a clean Fair Value Gap (pink box) just below current price action, aligning with the 78–79% retracement zone. Smart Money loves these inefficiencies — they act as magnets for price to rebalance before strong directional moves.
🟣 This FVG is your 1st key zone for entries. If price respects this, we could see an explosive move toward the buy-side liquidity.
📍 Confluence: Fibonacci + Imbalance
Notice how this FVG perfectly aligns with the Fibonacci Golden Zone (70.50–79.00%). This adds extra confluence that this area could act as a powerful springboard for long positions.
📍 Buy-Side Liquidity & Weak Highs Targeted
Above current price lies a Buy Side Liquidity pool and a marked Weak High, signaling that Smart Money may be targeting these inefficiencies next.
🎯 These are the obvious targets if price reacts from the FVG:
First TP at 104,680
Second TP at 104,887
Optional continuation beyond if price grabs liquidity and breaks structure
📊 Risk-to-Reward (R:R) Play
Entry near FVG with stop just below the Strong Low offers an attractive R:R setup. Targeting the weak high gives a multi-R potential.
🟢 High probability setup if price shows bullish reaction (engulfing, BOS) in the FVG zone.
🧠 Smart Money Logic:
Manipulation ✅
Imbalance/FVG ✅
Liquidity Grab ✅
Structure Shift ✅
Clean Targeting of Buy Side Liquidity ✅
This is a textbook SMC long setup in development.
⚡ Game Plan:
Wait for confirmation in the FVG zone (e.g., bullish engulfing or BOS on lower TF).
Set longs with tight stop below 103,535 (Strong Low).
Secure partials at first TP and trail for extended target.
🚨 Risk Management Reminder:
Stick to your trading plan.
Let price come to you.
Never risk more than you can afford to lose.
✍️ In summary:
BTC is sitting at a beautiful discount level with a clear inefficiency to fill. If Smart Money reacts here, we’re looking at a smooth climb into higher liquidity zones. This could be the cleanest setup of the day — if you know how to play it right.
💬 Comment “BTC READY” if you’re planning to enter this setup!
👥 Tag a crypto buddy who needs to see this!

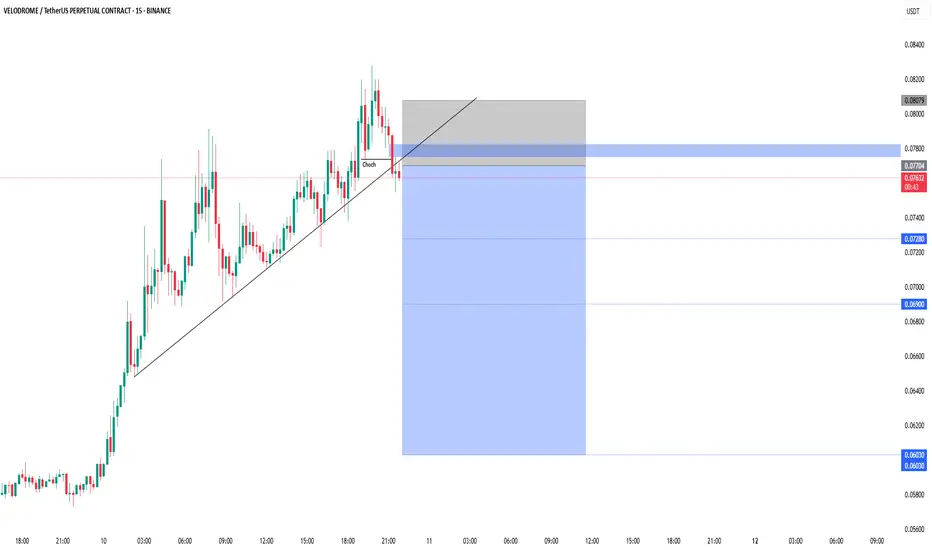
VELODROME/USDT — Trendline Break, Down is coming??Price has broken the ascending trendline and formed a clear Change of Character (ChoCh) to the downside.
This retest offers a potential short opportunity if rejection confirms from this zone.
Entry: Around 0.0770–0.0780
Stoploss: Above 0.0807
Target Levels:
• TP1: 0.0728
• TP2: 0.0690
• TP3: 0.0630
A break below 0.0728 could accelerate momentum to the downside. Waiting for price action confirmation is recommended before entry.
ALTSEASON: Market to skyrocket to a 1.6 Trillion cap.The Cycle's Channel Up on the Crypto Total Market Cap (exc BTC and ETH) technically started its new bullish wave, which is translated to what is known as an altseason. Based on this chart, it is expected to rise by at least +139%, bringing the market to a $1.6 Trillion cap. Time to invest heavily in altcoins.
## If you like our free content follow our profile to get more daily ideas. ##
## Comments and likes are greatly appreciated. ##

SUIUSD: Enormous rally started, targeting $10Sui just turned overbought on its 1D technical outlook (RSI = 70.835, MACD = 0.285, ADX = 33.014) but doesn't seem to even take a breather here as it rebounded on its 1D MA200, establishing it as its new long term Support. The underlying pattern of this Bull Cycle is a Channel Up and technically the market has started its new bullish wave. A +500% rise from the bottom (which was accomplished on both prior bullish waves) suggests a long term TP = $10.000.
See how our prior idea has worked out:
## If you like our free content follow our profile to get more daily ideas. ##
## Comments and likes are greatly appreciated. ##

Bitcoin, MACD and what we may get over the weekend - STILL BULLS
Just a quick post to explain how Ia m looking at this weekend with Bitcoin and I will use the MACD as amajor player here.
The BTC chart above is Daily, we can see the "Cuo " pattern, we can see the Long term rising Libne of support, we can see the red 236 Fib circle we shot through and the up coming 618 fib circle, that may or may not be trouble.
And that 2.618 Fib extension I can easily see us returning to to test as support.
WHY ?
The MACD on numerous timeframes...
What is MACD ?
MACD, short for Moving Average Convergence Divergence, is a technical indicator used in the analysis of securities prices. It was developed by Gerald Appel in the late 1970s and is widely used to identify changes in the strength, direction, momentum, and duration of a trend in a stock's price
OK, So, Lets start witht he 4 hour MACD -
I zoomed out on this a little so we can get a long term look at this and you can clearly see, we are already gettign near the High side, overbought levels where, historically, MACD turns Bearish, crosses over the Signal line ( red) and heads back down to cool off befoe heading higher again.
We are not yet as high as we were in Late April but it is not far off. Safe to assume this will turn down.
So now, lets see the Daily MACD
This is the daily MACD from around Nov last year and, again, we are heading into an area where it is prudent to be Bullish and Cautious.
Remember, the moves in the 4 hour are a lot quicker than the daily.
Go back and Look at the 4 hour, see where MAY began and what the MACD did in that time
See what that was on the Daily ? It was that little Blip on the rise up , that we are now continuing.
So, we have more room to go on the Daily.
and now the Master MACD, The WEEKLY ,the one that told us we were going to range in 2024, 2025 and will once again tell us when PA has reached Exhaustion later in this run
In this chart, you can see the 2 ATH's in 2021, you can see the Bear market and the recovery and everything ever since.
And you can also see that we have Still to cross the Signal line here to really enter a bullish state.
We have SO FAR to go here.....BUT with the high price now now have with BTC, it take more to push it higher. See how high MACD had to go to push PA up this last time ? The same height as it had to go in the 2024 push and yet we went twice as high on PA.
So, th be realistic here.....We are entering a bullish push but a $1 million BTC is NOT going to happen just yet.
SO, back to this weekend, the shorter term.
the 4 hour is high, already starting to turn as I write.
I can see BTC PA ranging or, maybe, as I said, testing the 2.518 as support at around 98K.
What people also need to watch os that BTC.D I talled about yesterday to guage if ALTS will Dip back lower or not.
Some alerady seem to be Dipping
SO, Bullish Caution for the weekend....Hang in there.....We only just begun

“+$25K Profit & Still Long – Don’t Chase, Trade Smart”Since the drop to 74K, we've seen an incredibly fast and powerful rally over the past month—and I’m currently sitting on a realized profit of over $25,000 during this move.
One of the most bullish signals in this entire structure is that since the reversal in April, we’ve never seen a proper correction or trend-reversing retracement. As I mentioned in previous updates, this shows exceptional strength and suggests the uptrend remains firmly intact.
In fact, we’re climbing without breaking any key lows—what I like to call a “step-by-step” grind upward. On higher time frames, these look like strong bullish candles, meaning more buyers than sellers, and aggressive market orders pushing price higher. That’s a characteristic of strong trends—remember that.
Now, with the historical ATH at $109,000 getting closer, I do not expect an immediate breakout to new highs. Instead, we might see a healthy consolidation—either price-wise or time-wise—around this major supply zone. This is not the time to FOMO in.
The recent surge was fueled by comments from President Trump, and that breakout candle was significant. But sharp moves often bring sharp corrections. If price pulls back to the 96–95K zone and finds support, that could be the base for a new push toward all-time highs.
If you’re not in a position right now:
🚫 Do NOT rush into the market.
We are at a spot where both a breakout and a reversal are possible. Whether you’re using the lower or higher time frame, wait for clear confirmation—a pullback, a base, a proper setup.
Look to long only after strong support is confirmed, or short if price keeps failing to break highs. Either way, keep a tight stop and let your winners run—there’s still opportunity here, but only with proper risk-reward.
I’ll say it again because it’s important:
If you missed this long, it’s okay.
The market will correct—whether sharply or slowly—and your edge is not in chasing, but in being ready. Don’t let impulsive trades erase your capital or your confidence.
Oh, and by the way—I’m still holding my long position.

Solana - Here Comes The Bullish Reversal!Solana ( CRYPTO:SOLUSD ) might head for new all time highs:
Click chart above to see the detailed analysis👆🏻
Just a couple of months ago, Solana perfectly retested the previous all time high and created an expected short term rejection. However, with the current major support area and a potential bullish reversal, Solana remains in a strong market, potentially heading for new all time highs.
Levels to watch: $120, $250
Keep your long term vision,
Philip (BasicTrading)

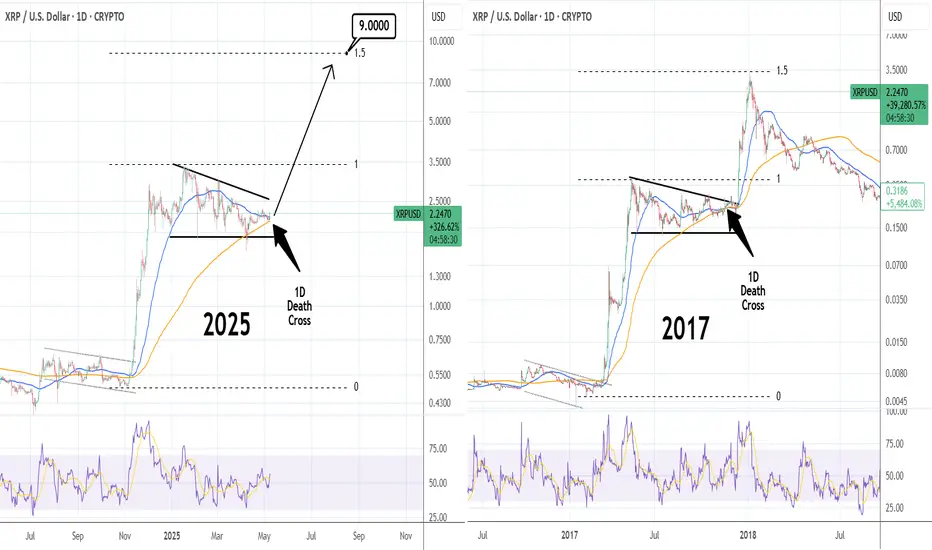
XRPUSD: Can this 1D Death Cross push it to $9.000? XRP is neutral on its 1W technical outlook (RSI = 54.799, MACD = 0.197, ADX = 30.423) which showcases the strong upside potential of the coin. 1D is about to form a 1D Death Cross, the first in over 1 year and even though it is technically a bearish pattern, this time it may work in Ripple's favor. At least that's what happened in November 2017, when the market was coming out of a similar Descending Triangle like this year's (2025). The rally that followed topped on the 1.5 Fibonacci extension. It is possible to see it hit the new 1.5 Fib (TP = 9.000) before the year ends given enough institutional involvement.
## If you like our free content follow our profile to get more daily ideas. ##
## Comments and likes are greatly appreciated. ##
BTCUSD: Reclaimed 100k after 3 months! Next wave to $190k.Bitcoin has turned overbought on its 1D technical outlook (RSI = 73.178, MACD = 2904.000, ADX = 30.769) as it reclaimed the $100,000 marke after exactly 3 months. This is a very structured bullish pattern that consists of a Bullish Wave that peaks and leads to a Megaphone consolidation, which in turn starts the next Bullish Wave. Both waves so far have been around +16.30%. As the 8H MA50 perfectly held Tuesday's low, the pattern has already started the new Bullish Wave, which technically aims for yet another +16.30% rally (TP = 109,000).
## If you like our free content follow our profile to get more daily ideas. ##
## Comments and likes are greatly appreciated. ##

A Table to show you Money Flow when BITCOIN DOMIANCE MOVES
A Simple Rule of Thumb can be followed when BITCOIN DOMINANCE moves up or down and it can save you a fortune if you use it properly.
BTC.D - BTC - ALTS
increase - increase - Decrease
increase - Decrease - Decrease Rapid
increase - Stable - Stable
Decrease - Increase - Increase Rapid
Decrease - Decrease - Decrease / Stable
Decrease - Stable - Increase
Currently we are seeing BTC.D Decreasing and yet the BITCOIN Price in Increasing and ALTS are INCREASING
Tjhis is Great BUT you need to watch BTC.D like a Hawk now because when that changes and begind to rise again, as it will do one day, maybe soon maybe in a month....then the likly hood of ALTS dropping Quickly is high
Bitcoin is now in heavy resistance and pushing through.
Pay attention to how long it can do that
The table above is your Saviour

BTCUSD – 1H Long Setup | Discount Entry With RR 1:5+🧩 BTCUSD – 1H Reversal Play | May 5, 2025
We’re deep in Discount Territory, and the market just showed signs of strength with a bullish reaction from the OB. The Risk-to-Reward on this one is chef’s kiss 👨🍳💋
🧠 Smart Money Breakdown:
📉 Market Context: Prolonged bearish leg forming equal lows — liquidity engineered ✅
📍 Entry Point: EQ/OB level @ ~$93,736
🟢 SL: Below OB at ~$92,730
🚀 TP: Previous structure high ~97,912
🧮 RRR: Around 1:5+ (massive potential)
🔎 Narrative & Confluence:
🔄 Price reacting to OB zone after taking liquidity
🧲 Potential inducement below = liquidity swept
⚠️ Engulfing bullish candle = signs of LTF accumulation
📈 Expectation: Push back into premium zone above 97K
🧠 Execution Tips:
Set and forget, or trail aggressively above 94,800
Watch M15-M5 for CHoCH + order flow confirmation
Add to position on micro pullbacks with tight risk
Partial TP around 96,000 zone, full exit at 97,912
📣 Chart Ninja Tip:
“Discount isn't just a price zone — it's where patience meets precision. Let price hunt liquidity, then strike!”
💬 Drop a 💎 if you caught this sniper long.
📊 Save this setup and tag a fellow price action beast.
🔁 Share if your RR game strong today!

SANDUSD: The recovery back to 1.07350 has started.Sandbox (SANDUSD) is marginally bearish on its 1D technical outlook (RSI = 43.227, MACD = -0.001, ADX = 35.488) as it dropped below its 1D MA50 again. However, the breakout over its 5 month LH trendline has already happened and calls for a long term recovery. As you can see the Fibonacci retracement levels form fairly symmetric Resistances with the previous LH levels, so we expect them one by one to get filled (final TP = 1.07350).
## If you like our free content follow our profile to get more daily ideas. ##
## Comments and likes are greatly appreciated. ##

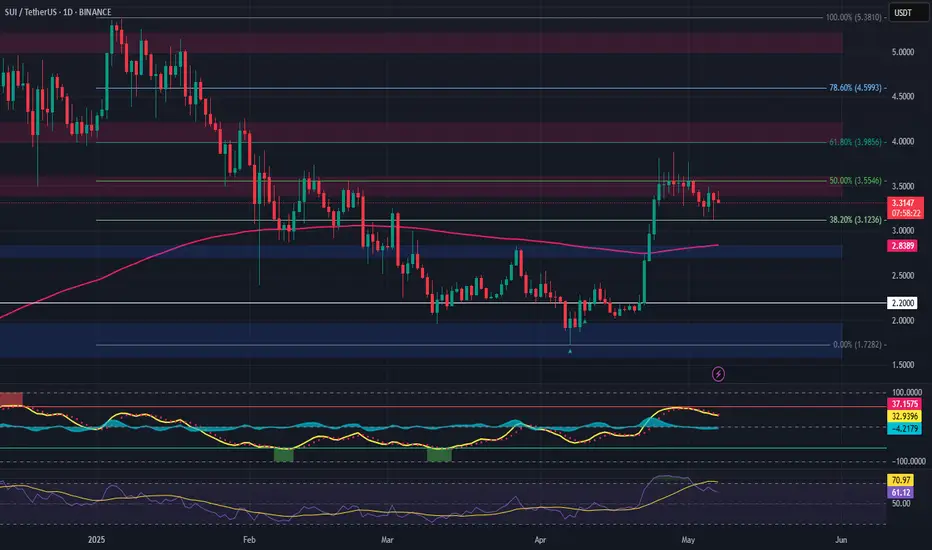
SUI – Long Trade Setup After Trend ReversalSUI has broken out of its downtrend, hitting all prior upside targets and now pulling back toward a key support area and the 200-day EMA, potentially forming a higher low—an ideal spot for re-entry.
🔹 Entry Zone:
Around $2.80
🎯 Take Profit Targets:
🥇 $3.40 – $3.60
🥈 $4.00 – $4.20
🥉 $5.00 – $5.20
🛑 Stop Loss:
Daily close below $2.20
📌 Strategy Notes:
Look for bullish confirmation (e.g., wick rejections, bullish engulfing candle) near $2.80
Structure remains intact as long as price holds above $2.20
EMA retests often precede strong continuation if trend strength remains
XTZ/USD Main trend. Downward channelLogarithm. Time frame 1 week. Main trend.
Idea for understanding the local work zone for traders in the main trend. It will also be useful for investors to understand the cheap/expensive zones for investing.
Linear price chart.
Secondary trend. Downward channel. Area to work. Time frame 3 days.
XTZ/USD Secondary trend. Downward channel.

No Altseason Until BTC.D Hits 70%?Bitcoin Dominance (BTC.D) is currently climbing and approaching a major resistance zone between 71.38% and 73.06%. This area has proven to be a strong turning point in the past, acting as a top back in December 2017, September 2019, and again in 2021. These repeated rejections suggest that this zone is likely to remain a key resistance.
Right now, BTC.D is sitting around 64.66% and still has room to push higher. However, if it enters the resistance zone again, there’s a strong chance it may face selling pressure and start reversing. The white arrow on the chart shows the possible move into resistance, while the red projection outlines the expected rejection and potential decline back toward the 54.63% level—another important support zone from the past.
In simple terms, BTC dominance might be nearing its peak, and once it reaches the upper zone, we could start seeing altcoins gain more strength as dominance falls. This chart helps anticipate when the market might shift from BTC-led rallies to altcoin outperformance.

Tue 6th May 2025 BTC/USD Daily Forex Chart Sell SetupGood morning fellow traders. On my Daily Forex charts using the High Probability & Divergence trading methods from my books, I have identified a new trade setup this morning. As usual, you can read my notes on the chart for my thoughts on this setup. The trade being a BTC/USD Sell. Enjoy the day all. Cheers. Jim

BTCUSD: 1H Death Cross might be dangerous but expect $100k if inBitcoin remains bullish on its 1D technical outlook (RSI = 61.614, MACD = 2557.800, ADX = 37.923) despite the correction since Friday's high. This is because the underlying pattern is a Bullish Megaphone which just bottomed. On the other hand, the 1H timeframe just formed a Death Cross. If this is invalidated and the price remains inside the Bullish Megaphone (also see that the 1H RSI is on a Bullish Divergence), we can see $100k on the next leg up (1.5 Fib extension like the 2 HH before). If the Bullish Megaphone breaks, testing the 1D MA200 at least, is veyr likely.
## If you like our free content follow our profile to get more daily ideas. ##
## Comments and likes are greatly appreciated. ##

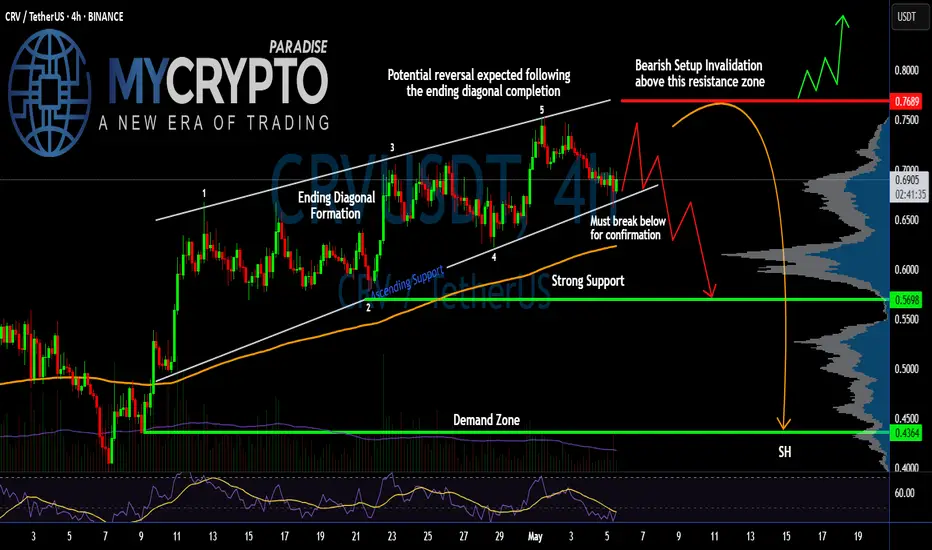
Is #CRV Ready for a Reversal or Not? Key Levels to Watch Yello Paradisers! Are we about to witness another brutal trap as #CRV finishes its final leg up and prepares to flush all late longs? Let’s break down the setup for #CurveDAOToken:
💎#CRVUSDT is currently trading around $0.6948, and what we’re seeing here is a classic Ending Diagonal Formation, a pattern well-known for luring in unsuspecting bulls before reversing violently. The structure has completed its five-wave sequence, and the price is now teetering just above key support.
💎The resistance zone near $0.7689 is where the whole game flips. This level has been clearly rejected before, and it now marks the invalidation point for any bearish outlook. A sustained move above this region with solid momentum would invalidate the diagonal and potentially send the price toward the $0.80+ mark. However, without that breakout, the bearish reversal remains the dominant scenario.
💎#CRVUSD is holding above rising trendline support, but this support is critical. A break below it confirms the end of the diagonal and should trigger a strong sell-off. The first target on a breakdown is the $0.5698 area, a zone previously respected and backed by significant volume profile interest.
💎If sellers gain traction and that level breaks down too, we’re watching for a move toward the demand zone at $0.4364, which aligns with the lower volume shelf—this is where the real pain could begin for over-leveraged traders caught on the wrong side.
Play it safe, respect the structure, and let the market come to you!
MyCryptoParadise
iFeel the success🌴
One Last Drop Before Take Off?Price is still in a pullback phase, and the next potential target zone is around 0.07488 – 0.07334.
We might see one last dip before BINANCE:STPTUSDT resumes its uptrend.
If the price reaches this pullback zone with a bullish divergence, that would be a strong confirmation for a possible reversal.
But even without divergence, we can still rely on candlestick patterns to signal a potential reversal at that level.
What do you think — will BINANCE:STPTUSDT bounce from this zone or break lower?

Is the CGPT Retest a Setup-Are You Ready for It?Yello, Paradisers! Have you been watching CGPT closely? Because what we’re seeing now could be a textbook setup to liquidate early longs before a brutal downward move. This is the exact type of trap that punishes undisciplined traders and rewards those who wait.
💎After weeks of bullish momentum with clean higher highs and higher lows, #CGPTUSDT has now printed a clear change of character (CHoCH). The previous low was taken out, and now price has pulled back right into a high-probability resistance zone. This zone, between $0.115 and $0.118, aligns perfectly with a broken ascending trendline adding confluence that strengthens our bearish bias. Traders who aren't careful might interpret this retest as a sign of strength, but this could just be the market setting up its next liquidation wave.
💎Adding even more weight to this bearish thesis is the fact that #CGPT is currently trading below its 50 EMA on the 4H timeframe, showing clear weakness and confirming that the short-term momentum has already shifted in favor of sellers. This acts as dynamic resistance and makes it even harder for price to reclaim bullish control without a significant effort from buyers.
💎The structure is showing all signs of a classic trap. Price action is hesitant at resistance, and with momentum waning, a rejection from this level could spark a swift move down toward $0.09188, our first support zone. But that may not be the end of it. If selling accelerates, we are eyeing the $0.07133 area as a potential major demand zoneour strong support and where true smart money will likely accumulate. However, we must always remain tactical. If CGPTUSDT flips above $0.12526, this bearish scenario is invalidated and we would reassess for possible bullish continuation.
Discipline, patience, robust strategies, and trading tactics are the only ways you can make it long-term in this market.
MyCryptoParadise
iFeel the success🌴

ORDIUSDT — channel, high risks, high rewards.ORDI is the first BRC-20 token based on the Ordinals protocol on Bitcoin. Since its launch in March 2023, the token quickly gained popularity and a significant market cap, being integrated into the Bitcoin blockchain. This integration is made possible through the Ordinals protocol developed by Casey Rodarmor. The protocol allows inscriptions - text, images, audio, or video - to be made directly on satoshis, the smallest unit of Bitcoin, giving Bitcoin new functionality that was not originally envisioned. You can now create NFTs and other digital assets and trade them directly on the blockchain.
____________
The token was listed at a fortunate time - late 2023 - amid overall market growth and positive sentiment. At the time, everything looked promising, but now the price has dropped by 94% from the zones where “hype was being sold.”
🔻 Structure:
The token is moving within a large descending channel. Recently, the price tested the outer support of this channel.
A local downtrend channel was also broken - its retest and a rise within the main trend are possible.
📊 Scenarios:
Retest and upward movement as part of a correction.
Consolidation in the current zone with a possible breakout to the upside.
Further decline amid overall negative market sentiment.
💥 Risks:
The token is traded on all major exchanges, including Binance. However, if it gets delisted (which has been happening more often recently), this is the main risk: loss of liquidity!
🎯 Approach:
With such tokens, it’s crucial to distribute volume wisely and accept risk in advance. I mark out interesting zones and place limit orders accordingly.
Considering the overall market and news backdrop, the token does have bounce potential, especially now that faith in the project is nearly lost.
💭 Opinion:
From my years of experience, I’ll say it again: the goal isn’t to guess where the price will go - it’s to be ready for it. Not everyone will understand that, but then again, not everyone consistently makes money in this market.
_________
📌 Not financial advice. This material reflects personal observations and a risk management approach.

MEMEFI/USDT Bearish Rejection at Supply Zone Incoming? Down!!Price is currently approaching a key supply zone after a sharp drop, with signs of weakness on the lower timeframe. The recent bullish push appears corrective, forming a potential lower high structure.
Looking for price to tap into the highlighted supply area and show rejection — this could confirm a short opportunity.
Entry: 0.00447
Stoploss: 0.00466
Target:
• TP1: 0.00428
• TP2: 0.00412
• TP3: 0.00398
• Final TP: 0.00370
This setup aligns with a bearish continuation bias unless price breaks cleanly above the zone.
