Total Market Cap: Testing the 200 MA as Resistance (Daily Chart)28.04.2025
Price is currently testing the 200 MA as resistance.
Last time we saw a similar test, price rejected and soon after, the infamous **death cross** occurred (50 MA crossing below the 200 MA).
Today, the internal structure looks better:
✅ MLR > SMA > BB Center > PSAR – positive alignment, signalling early momentum shift.
However, for a real bullish confirmation, price must flip the 200 MA from resistance into support.
Until then:
⚠️ Watch for rejection at this level.
⚠️ Patience — wait for the structure to fully align before considering heavy positioning.
Discipline first, excitement second.
Cryptotrading

"BTC Just Triggered ChoCh! Are You Ready For The Next Big Play?"⚡ BTCUSD Analysis - 15M Timeframe | April 28, 2025
📈 What's Happening:
BTC hunted liquidity above the previous highs (notice those $$$ grabs 🔥).
A sharp sell-off followed = Clear ChoCh (Change of Character) printed.
Price is now marching back into the Fair Value Gap sitting right inside the Premium Zone.
🚨 Critical Levels Highlighted:
Strong High = Ultimate invalidation for bears if price closes above.
Fair Value Gap (FVG) = First supply area.
Order Block (OB) = Deeper, higher probability short zone.
🧠 Key Observations:
Smart Money grabbed liquidity to trap breakout buyers.
Now price retraces into the imbalance = prime sniper setup.
🎯 2-SCENARIO PLAN:
Plan A — Short Setup (Main Bias):
✅ Wait for rejection signs inside FVG or OB.
✅ Trigger short entries only after bearish structure forms (M5 or M1 timeframe).
✅ TP1 = Previous minor low. TP2 = Weak Low (~92,800 zone).
✅ SL = Above Strong High (~95,400).
Plan B — Breaker Play (Alternative):
✅ If price smashes through OB + Strong High with strength, flip bias.
✅ Look for bullish Breaker structure (retest + continuation).
✅ Target fresh liquidity zones above.
📊 Risk Management Tip:
"React to confirmation, not prediction. Let price prove itself before you jump."
🧘♂️ Summary:
✅ Liquidity swept
✅ ChoCh confirmed
✅ Premium Zone retest incoming
✅ High Risk-Reward opportunity forming
🔥 This is where patience = profits.
➡️ Mark this setup, and let's trade like Smart Money, not like retailers.
➡️ Comment "PATIENT SNIPER" if you’re waiting for the perfect trigger!

Is #LTC on the Edge of a Major Breakdown? Watch Key Levels Yello Paradisers! Is #Litecoin about to collapse after completing a suspicious Ending Diagonal pattern? Let’s dive into this critical setup on #LTCUSDT:
💎#LTC is currently trading around $87, sitting just below a major resistance zone between $92 and $97. Price has been moving inside a textbook Ending Diagonal formation, and based on the current structure, the 5th wave of this diagonal appears to still be unfolding—but the clock is ticking.
💎Volume has been fading even as price attempts to push higher, a classic warning sign deep inside a wedge. At the same time, momentum indicators are showing bearish divergence, hinting that the strength behind this up-move is running out of steam.
💎The red Resistance Zone above is absolutely critical. If #LTCUSD manages to break and hold above $96, the bearish setup would be invalidated, opening the path for a strong impulsive move toward $104 and beyond. However, unless that breakout happens with convincing volume, the odds strongly favor the downside.
💎If price fails to push higher, the first sign of confirmation will be a break below the ascending support trendline near $86–$84. A decisive move below this support would likely trigger a fast drop toward the next major support around $76. If that fails to hold, a full breakdown into the $64 region becomes very likely, as that's where strong historical demand exists according to the Volume Profile.
Play it safe, respect the structure, and let the market come to you!
MyCryptoParadise
iFeel the success🌴

Stromm | SOLANA Key Zones for Next MovesWe've seen a very solid reaction here — similar to Bitcoin, but still with its own flavor.
The Previous Monthly Low was swept and then reclaimed, which is always a strong bullish signal.
On top of that, the Monthly Open was reclaimed and successfully retested, flipping market structure back to bullish.
No doubt: the trend right now leans upward.
The big question is: where do we go from here?
When you look left on the chart, you see two massive candles:
One day, +30% straight up,
Followed by -22% the very next day.
Pure chaos.
Now, price is pushing back into that zone — and we need to watch how it reacts inside those previous candles.
For targets:
The Weekly Fair Value Gap near the Previous Monthly High is a major zone to watch.
After that, there’s the 2h Fair Value Gap around the Yearly Open — the next big magnet for price.
And it’s worth noting:
Compared to Ethereum, Solana’s Yearly Open is way closer and much more realistically within reach. Another subtle hint that SOL is showing way better relative strength.

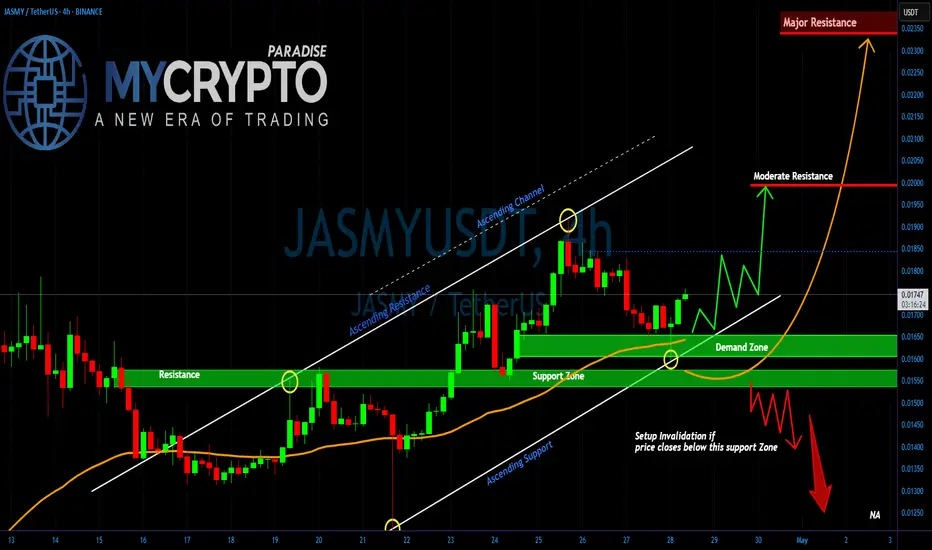
JASMY at a Breaking PointYello, Paradisers! Have you been watching JASMY closely? If not, you might be about to miss one of the most explosive opportunities we've seen in recent days. A major breakout or breakdown is brewing, and the market is preparing for a decisive move!
💎Right now, #JASMYUSDT is sitting above a critical Demand Zone after successfully flipping a strong historical resistance into support. Price action is following an ascending structure, respecting both the Ascending Support and the broader Ascending Channel pattern. As long as the price continues to hold this support region and maintain the bullish market structure, there is a high probability of a breakout towards the Moderate Resistance level around 0.01994. A clean break above this area could fuel a sharp rally straight towards the Major Resistance zone at 0.02337.
💎However, caution is absolutely necessary here. If JASMY fails to hold the current Demand Zone and we see a confirmed close below the support at 0.01540 level, it would invalidate the bullish setup. In that case, a rapid sell-off is likely, with downside targets opening towards the 0.01397 region and possibly even lower levels. This would create a high-risk environment where inexperienced traders could get trapped very quickly.
Stay focused, Paradisers. Be the hunter, not the hunted.
MyCryptoParadise
iFeel the success🌴
Two Bullish Scenarios to Watch on ETHUSDTThis week, BINANCE:ETHUSDT has shown a significant upward movement, and there's a good chance it could continue its bullish momentum.
There are two bullish scenarios developing on BINANCE:ETHUSDT :
1. After a pullback, we could see an impulsive move that breaks the previous high (marked with the red arrow) and pushes the price towards the first target at 1,911 – 1,957.
2. The price could move sideways for a while, forming a bullish pennant pattern. In this case, a correction towards 1,756 – 1,731 might occur before the price resumes its move to the first target at 1,911 – 1,957.
Both scenarios remain valid as long as the price holds above 1,722.
If the second scenario plays out, the pullback to 1,756 – 1,731 can be considered a good buy zone (for those who are not in position yet).
Remember: wait for a confirmation candle before entering and place your stop-loss just below the confirmation candle.

SUI/USDT.P Short Setup — Ride the Wave to Profits!Trade Details:
Entry: 3.56 - 3.6 USDT
Stop-Loss: 3.6935 USDT
Take-Profit Levels:
TP1: 3.4215 USDT
TP2: 3.2700 USDT
TP3: 3.0640 USDT
With clear targets set and a tight risk management strategy, this setup offers a great opportunity to ride the wave of the market’s next move.
Patience and discipline are key. Stay focused, follow your plan, and let's make this trade count!

MEME: HOW THE HUMAN BRAIN WORKSSuper in-depth infographic detailing how the human brain works. Crypto People TOO! 🤣🤣🤣🤣
You can right-click the image below and select "Save As..." to download and share it with your friends.
Have FUN!

Bitcoin Following 2013-2017 Fractal UPDATE for APRIL- looks GOODInitially we can see we got the expected bounce in approximatly the are we expected it due tot he MACD reaching the bounce zone near Neutral.
Currently, PA is hoovering around the Marker near the Circle.
I did expect that to take longer and so the PA would be within the circle but I am not complaining
As it stands of today. we may still see PA reach that circle as the Daily chart shows.
Shoudl PA range across, it would take 1 whole month to reach the centre. I would be surprised if that happens as Weekly MACD is only just returning to BULLISH and the Daily still has plenty of Room to conintue its bullish climb.
BUT, and I do mean this seriously, We could see a reversal and return to Bearish still.
This has happened before
So, Lets remain cautious for now, even though we are near the Neutral line and sentiment predicts a further push higher, Caution is the better part of Valor.
But on the Longer Term, Which Path are we taking >?
We have begun rising right between the two options and, so for now, I am inclinded to Favour the Dashed Arrow that points to a 250K ATH.
And to many extents, this will still follow the Fractal, even if we are now below....
The amount of Money required to push Bitcoin up into the Bold Arrows Path and Get PA back ontop of the Fractal is truly Eye watering.
But I will Always say Never say Never.
Bitcoin is on a Cross roads. As I have mentioned in other posts, PA is under a VERY Long Term line Arc of resistance right now.
The chart for this is beow. this is a rough version but clearly shows the problem
To break over this, we need to Pass and remain above 118K USD
On the Fracta, this region os part of a Sustained push higher, as PA would normaly do in an area of High resistance...To Break through.
And we are sitting Just below this point right now....With the ability to push through
We have to wait and see which arrow we follow....My bet ois on the dashed for now....
Time will always tell us.....
Stay safe everyone.....

SUI/USDT Update - Approaching Channel Resistance! Let’s dive into the 1H chart for SUI/USDT.
Sui is riding a solid rising channel, showing strong bullish momentum!
Price has climbed from $2.25 since 22 April and is now at $3.59, with potential extention to the channel’s resistance at $4.00.
Key support holds at $3.00, with an intermediate level at $3.50.
If we break above $4.00, we could see a big move higher. But if rejected, expect a pullback toward $3.50 or $3.00.
Keep an eye on volume and price action at this resistance!

TRUMPUSDT LongTRUMP buy signal on M15 Timeframe. Triangle pattern was succesfully broken on bullish side. Now bullish target is 8.66 level, Risk reward 1/5. On higher TimeFrame bullish target is 9.4 level.

AR Trade Setup – Watching for Market Structure ShiftAR is showing early signs of strength after defending the $5 key level a crucial support that bulls needed to hold. Now, the focus is on a potential shift in market structure around $6, which could lead to a strong upside move.
📍 Entry Zone:
Enter around $6 after confirmation (e.g., reclaim with strong volume or bullish candle close)
🎯 Take Profit Targets:
🥇 $12
🥈 $16
🥉 $22
🛑 Stop Loss:
Below $5

Crypto Bulls Awaken – Is This Just the Beginning?In the past 48 hours, the crypto market has brought joy to traders and investors who managed to buy near the bottom.
(Sorry to the cryptobros still holding floating losses—your time will come too! 😊)
Some of you might be thinking it's too late to ride this bull run. But if you zoom out and look at the bigger picture, there's still plenty of room for the bull to run.
Just switch to a higher timeframe like the weekly or monthly chart, and you'll see the potential upside.
One coin that looks particularly interesting is BINANCE:SUIUSDT .
There's been a pullback from 2.1829 - 1.7997, and it's supported by bullish divergence, suggesting a continuation of the impulsive move with 7.6108 as the first major target.
This bullish scenario remains valid as long as the price holds above 1.7174.
You might be wondering,
" So can I just buy/long BINANCE:SUIUSDT now? "
Not yet.
For a better entry and a more favorable risk-reward ratio, I suggest using the daily chart.
Wait for a pullback, then look for confirmation using candlestick patterns.
(I'll cover those patterns in my next post—stay tuned!)

LINK Trade Setup – Pullback to SupportLINK has made a solid move from ~$10 to $15 over the past couple of weeks. With that rally showing signs of slowing, a pullback into support presents a potential opportunity to catch the next leg up.
📍 Entry Zone:
$13.00 – $14.00
🎯 Take Profit Targets:
🥇 $15.00 – $16.00
🥈 $17.00 – $18.00
🥉 $19.50 – $20.50
🛑 Stop Loss:
Just below $12.00

BITCOIN (BTCUSD): Detailed Support & Resistance Analysis
Here is my latest structure analysis for Bitcoin.
Resistance 1: 94300 - 95600 area
Resistance 2: 98300 - 100200 area
Resistance 3: 101400 - 102600 area
Support 1: 90500 - 92800 area
Support 2: 85300 - 88900 area
Support 3: 82600 - 83700 area
Consider these structures for pullback/breakout trading.
❤️Please, support my work with like, thank you!❤️

Risky Scalp Short | $ETH @ CMP 1778 | 5x–7x LeverageHigh-risk scalp short on ETH based on intraday price action and overextension signs.
Trade Plan:
Entry 1: CMP ~1778
Entry 2: 1812
Leverage: 5x to 7x
SL: To be updated (Max 3% risk)
Quick scalp — watch closely for volatility & potential fakeouts.
⚠️ High-risk trade. Not financial advice. For educational purposes only. Use proper risk management.

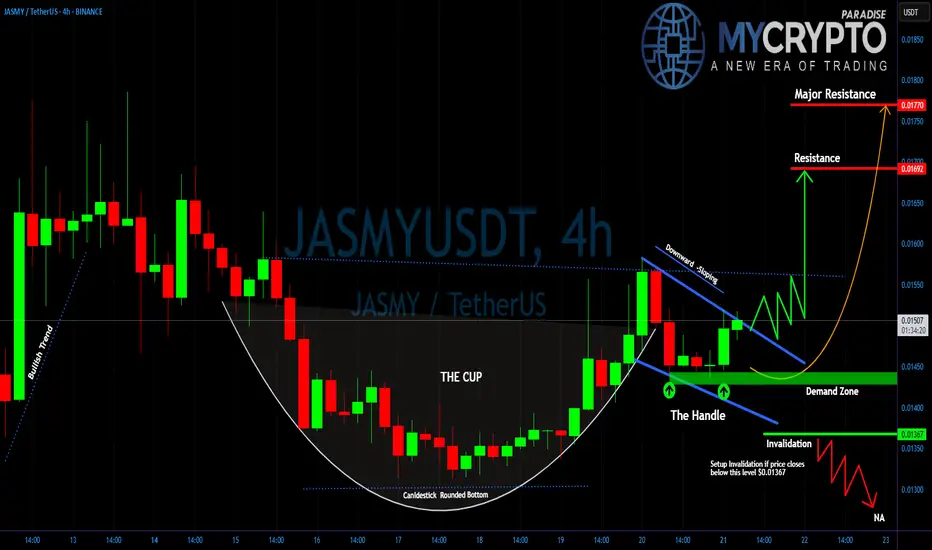
JASMY: Will You Catch the Breakout or Get Caught in the Trap?Yello Paradisers, did you catch the textbook pattern quietly forming on JASMY while most of the market remains distracted? Because what comes next could catch the majority off guard.
💎#JASMYUSDT is currently forming a classic Cup and Handle pattern. After a strong impulsive move, the price retraced in a rounded bottom structure, completing what now looks like the cup. The current consolidation has created the handle a downward-sloping corrective move that’s showing early signs of exhaustion.
💎What adds even more strength to this setup is that the price is now trading above both the 50 EMA and 200 EMA on the 4H timeframe. This signals a solid bullish bias and confirms that the overall momentum remains in favor of the bulls. When the price holds above both moving averages during a consolidation phase, it often indicates that a strong continuation move is brewing.
💎The price is also respecting a well-defined demand zone between 0.01430 and 0.01450. As long as this area holds, the probability of a bullish breakout remains high. A break above the descending handle resistance will be the first true confirmation.
💎If that breakout is supported by volume and sustained price action, we expect a move toward the first resistance at 0.01698. Beyond that, the final target for this pattern lies at the major resistance zone around 0.01785, where significant selling pressure could return. However, discipline is key. If JASMYUSD breaks below 0.01367, the handle structure would be invalidated.
Stay focused, Paradisers. Be the hunter, not the hunted
MyCryptoParadise
iFeel the success🌴
BTC has just bounced, game a long entry from weekly support..110
“🔍 BTC has just bounced off our weekly support—here’s why I’m eyeing $110k next…”
Analysis bullets:
🛑 Risk: stop-loss around $78–80k (weekly close below red band)
▶️ Entry: current weekly close above the descending trendline
🎯 Target: $110k resistance (green zone)
Call to action:
“What do you think — will we break out or retest lows? Comment below! 👇”

#HBAR Current Setup Showing Warning Signs | What's Next?Yello Paradisers! Is #HBAR teasing one last move up before everything collapses? Let’s break down what this suspicious structure on #Hedera is telling us:
💎#HBAR is currently trading at $0.183, sitting just beneath a heavy resistance zone around $0.190–$0.200. Price has been unfolding inside a clear Ending Diagonal structure—one of the most deceptive patterns in technical analysis. Wave 5 is still technically in play, but momentum indicators and volume behavior are telling a different story.
💎Volume has been steadily declining even as the price has been climbing, which is never a good sign this deep into a wedge pattern. On top of that, the RSI is pushing into overbought territory, showing that buyers are pushing the market higher, but with weakening strength behind them.
💎The resistance zone above current price is absolutely key. If #HBARUSD manages to break above the red zone and sustain momentum above $0.200, this would invalidate the current bearish setup and could open the door for an impulsive extension toward $0.220 and even higher. However, that scenario currently remains the less likely one unless we see a clear and strong breakout above the zone backed by volume.
💎Until then, bears are in control of the probabilities. The market structure favors a reversal from the Ending Diagonal, and if that plays out, the move could unfold quickly. First, we’ll be watching how price reacts at $0.142, which is the first major support and likely target if the wedge breaks down. A confirmed close below that level would likely lead to a continuation of the drop, with the next strong support zone near $0.125. This area has acted as a solid demand level previously and is also the region where the Volume Profile starts to spike again.
Play it safe, respect the structure, and let the market come to you!
MyCryptoParadise
iFeel the success🌴

BITCOIN (BTC) Trading Plan.Bitcoin (BTC) Trading Plan:
Resistance Level: $88,000
Support/Channel Level: $85,000
Target Levels:
If price rejects $88,000 and breaks below $85,000,
Sell target: $78,000
If price holds above $85,000 and breaks out above $88,000,
Buy target: $93,000

Sui Buy IdeaHow do you know a good breakout?
According to Edward and Maggie in their classic charting book, a breakout should around 3% of the candle closing outside the pattern.
And if you can see Sui has broken out of it's 4 months trendline.
I see more bullish moves ahead.

FARTCOIN/USDT.P – Smells Like a Clean Short Entry’s cooking, and this setup is dripping with RR juice. Let's break it down:
📍 Entry Gameplan:
Short Zone: 1.0660 – 1.0710
SL: 1.1195 (tight and right above the wick)
TP1: 1.025
TP2: 0.9835
TP3: 0.9055 (send it 💨)
Why I Like This Setup:
That choch ➝ BOS combo? Chef's kiss.
Price tapped into supply and reacted fast = strong sellers present
Beautiful RR — no overcomplications, just structure, imbalance, and timing
This thing's been cooking sideways long enough. Now that it’s broken structure and filled its pockets with early buyers, we might finally see a solid dump.
Let’s see if FART delivers the gas.

FINAL LEG OF THE ZIGZAG CORRECTION ?Yello, Paradisers! Are we about to see the end of this correction, or is there still one more shakeout coming? Let’s break it down.
💎The market is currently unfolding within a Zigzag Correction (A-B-C) pattern, and we appear to be in Wave C the final leg of this structure. Wave A has already played out with a sharp downward move, followed by Wave B, which acted as a countertrend rally. Now, Wave C is in progress, forming the last phase of this corrective cycle.
💎Since this is a 5-3-5 Zigzag Correction, the third wave of Wave C has already developed, meaning the market is nearing a critical Demand Zone at 4.0283. This level is a strong support zone where a potential reversal could occur. If the price reacts positively from this area, it could mark the end of the correction and signal the beginning of a new bullish phase, starting Wave 1 of the next uptrend.
💎However, if the price remains trapped between the Moderate Support and Moderate Resistance zones, we may see an extended period of sideways consolidation before any decisive move. A key confirmation to watch is the RSI approaching oversold conditions, which would indicate that downward pressure is weakening and the probability of a bullish reversal is increasing.
As always, Paradisers, the key to profiting in this market is waiting for high-probability setups. If this correction is indeed ending, the next move could be explosive. Stay sharp, stay disciplined, and trade smart!
MyCryptoParadise
iFeel the success🌴
