Will STX Outperform Bitcoin?In the crypto market, if you want to beat the market, your benchmark is $CRYPTO:BTCUSD. That means to outperform the crypto market, you need to outperform Bitcoin.
One way to measure this is by watching crypto/BTC pairs, such as $BINANCE:STXBTC. If $BINANCE:STXBTCgoes up, it means STX is stronger than BTC. If it goes down, BTC is stronger than STX.
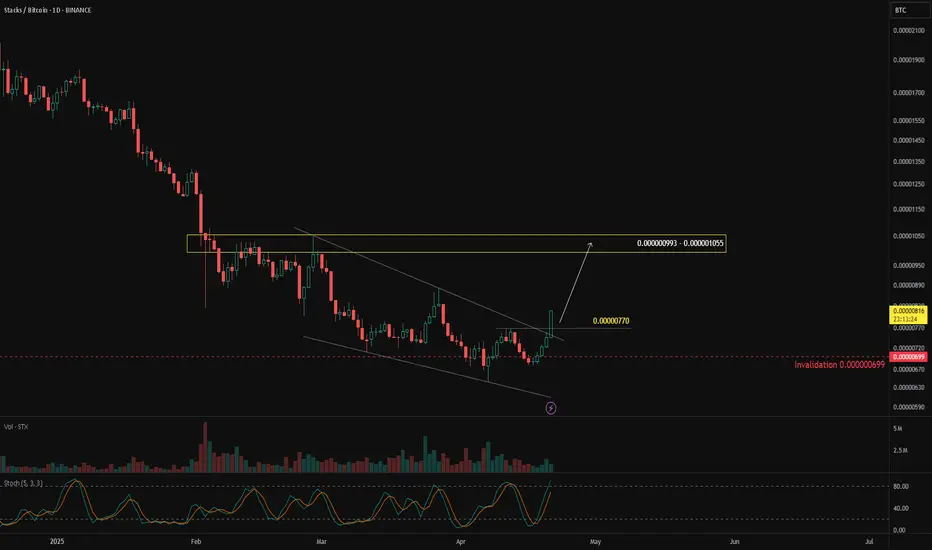
On the daily chart, BINANCE:STXBTC has been moving downward, but over the past month, sellers seem to be losing momentum—indicated by a falling wedge reversal pattern.
A bullish breakout above 0.000000770 would confirm the pattern, with a potential upside target at 0.000000993 – 0.000001055. This scenario remains valid as long as price holds above 0.000000699.
Cryptotrading
ZRO: Altcoin hero?If you find this information inspiring/helpful, please consider a boost and follow! Any questions or comments, please leave a comment!
ZRO is worth keeping on the radar. Out of most altcoins it arguably has the cleanest setup for a potential bullish reversal—at least structurally.
While it could be done here, I’m leaning on the idea that the Y wave still needs one more leg down. That’s typically the behavior we see: Y waves tend to be slower and more drawn out compared to the W wave. If that holds true again, the ideal target zone falls between $2.12 and $1.88. That would allow for a proper test of structure while staying within the bounds of the larger corrective patterns most likely target.
This is still a bullish interpretation—but only after one more low and a meaningful reaction from it.
That said, both the bull and bear counts are pointing down in the near-term. My personal invalidation sits above the (c) wave high. If ZRO clears that, this setup likely needs to be re-evaluated. Until then, any move beyond the orthodox end of wave A of the Y leg should be considered “enough” from a pattern swing perspective.
Patience here could pay off—especially if price enters the key zone and shows strength.
Trade safe, trade smart, trade clarity.

If the market reaches the $88,490 level, we'll look for selling.BTCUSDT Weekly Analysis: Navigating the Range-Bound Market
Bitcoin (BTC) is currently trading in a range-bound market, showcasing a delicate balance between buying and selling pressures. As traders, it's essential to identify key levels and potential trading opportunities.
Key Selling Area: $88,490
We've identified a crucial selling area at $88,490, where sellers are actively participating. This level has the potential to cap upward movements, and we're waiting for the market to reach this zone.
Trading Strategy:
1. Sell Setup: If the market reaches the $88,490 level, we'll look for selling opportunities, targeting lower levels and taking advantage of potential downward momentum.
2. Alternative Scenario: If the market doesn't reach the $88,490 zone, we'll wait for a clear breakdown from the current range, with a candle closing below the range. This would signal a potential shift in market sentiment.
Market Outlook:
The range-bound market presents both challenges and opportunities. By monitoring key levels and waiting for confirmation, we can make informed trading decisions and navigate the markets effectively.
What to Watch:
1. $88,490 Level: A key selling area that could determine the next move.
2. Range Boundaries: Monitoring the current range and waiting for a breakdown or breakout.
3. Market Sentiment: Keeping an eye on market sentiment and adjusting our strategy accordingly.
By staying vigilant and adapting to market conditions, we can capitalize on potential trading opportunities and navigate the complexities of the cryptocurrency market.

VOXEL/USDT – The Trap Has Been Set! Short From Smart Money ZoneA clean structure-based short setup with clear risk and reward levels. Wait for bearish confirmation on entry zone if not already in position.
Trade Details:
• Entry: 0.124
• Stop Loss: 0.132
• Targets: 0.112 – 0.100 – 0.0828
• Leverage: Cross 10x – 15x
Key Confluences:
• ChoCH confirmation
• Price tapped into FVG + 0.5–0.618 Fib zone
• Bearish reaction expected from supply area
A clean structure-based short setup with clear risk and reward levels. Wait for bearish confirmation on entry zone if not already in position.

Golden Cross means Golden Opportunity?Here's What You Need to Know About Moving Averages
One of the signs of the beginning of a bullish trend is the golden cross — a crossover between two moving averages. The shorter-period moving average (closer to the price) crosses above the longer-period moving average (farther from the price).
When this happens, it could be a signal to consider buying or opening a long position, especially if supported by candlestick confirmation. The target is usually set higher than the previous high.
Case Study: BINANCE:STEEMUSDT
The price began trading above the EMA 20 (white line) and EMA 50 (pink line), then the EMA 20 crossed above the EMA 50 — forming a golden cross.
But instead of entering immediately, you should wait for a price retracement back to the EMAs, allowing them to act as support (also known as dynamic support, since EMAs move with price).
In this case, a bullish engulfing candlestick pattern appeared right at the EMAs. The confirmation level is at 0.1303, which means the price needs to close above this level to validate the bounce from the EMAs. The invalidation level is below the bullish engulfing candle — at 0.1270.
Target prices:
Target I: 0.1570 – 0.1632
Target II: 0.1802 – 0.1887
You might be wondering: How do I choose which target to aim for?
Let me explain — the main target is 0.1802 – 0.1887 because it’s above the previous high (in a bullish trend, price tends to form higher highs).
Then why include 0.1570 – 0.1632? Even though we aim for the higher target, we still need to be cautious of potential resistance in that zone. Once the price hits that level, observe how it reacts.
If there’s a significant rejection or price drop, consider reducing your position to secure profits. But if the price keeps pushing up with strong momentum, let the profits run.
So in this case, 0.1570 – 0.1632 acts more like a level of awareness rather than a fixed take-profit target.
Let me know what you think about this post!
Would love to hear your thoughts and how I can support your trading journey with more technical insights or educational content like this. 🙌

Bullish Triangle Pattern on ProgressIn my previous update on BINANCE:CRVUSDT , I mentioned three potential scenarios: a bullish triangle formation, sideways movement, and a double top pattern.
Right now, it looks like the bullish triangle pattern is playing out. If this continues, I expect the price to reach the 0.7853 – 0.8343 target zone. But before that, all eyes are on the key resistance at 0.6667 — the prior high.
The best-case scenario would be a strong breakout above 0.6667, ideally with a solid bullish candle showing strong buyer momentum.
However, stay cautious. If price breaks the resistance but quickly falls back into the triangle and breaks the low of the breakout candle, that could be a false breakout (or what some might call a liquidation sweep). In that case, reducing exposure could be a wise move, as price might enter a sideways phase.
On the other hand, if price gets rejected (before breakout) at 0.6667 with a large red candle, that’s still acceptable — as long as price holds above the invalidation level at 0.5781.
Let’s keep watching how price reacts around key levels. Market structure still favors the bulls, but risk management is key.

GMTUSDT – Trendline Breakout, and Potential for Continuation!GMT has finally shown signs of strength after a prolonged downtrend. The pair has broken out of its descending trendline, a key structure that had been capping price action for weeks. This breakout is more than just a technical event — it signals a potential shift in market sentiment 🧠.
One of the most important developments is the break above the previous lower high, which confirms a short-term bullish market structure. With this structure change, bulls have gained the upper hand — at least for now 🐂.
Currently, we are seeing what looks like a re-accumulation phase just above the breakout zone. This consolidation is healthy and typical after a strong impulse move. If GMT manages to hold above this area, we could be looking at the early stages of a bullish continuation, targeting the strong resistance zone around 0.074 🔥.
However, it’s also important to be prepared for a possible pullback. If that happens, the demand zone between 0.0487 and 0.0533 will be crucial. A retest of this zone could act as a springboard for the next upward move. 📈
🔍 Key Technical Highlights:
📉 Demand Zone: 0.0487 – 0.0533
📈 Next Target: 0.074 (Strong Resistance Area)
Final Thoughts:
Momentum is building, but confirmation is key. Watching how price reacts in the coming sessions — especially around the consolidation and demand zones — will be crucial for spotting the next big move. If bulls maintain control, we could see GMT pushing toward new short-term highs in the coming days. Patience and proper risk management are your best friends here.

Trading opportunity for IOTXUSDTBased on technical factors there is a Buy position in :
📊 IOTXUSDT
🔵 Buy Now
🪫Stop loss 0.01475
🔋Target 0.02800
📏 R/R 3,3
💸RISK : 1%
We hope it is profitable for you ❤️
Please support our activity with your likes👍 and comments📝

BTCUSDT – System-Based Long Signal (3D Timeframe)
📅 April 19, 2025
Yesterday’s 3D candle closed with a clear PSAR flip, shifting from bearish to bullish — an early signal of potential trend reversal.
In addition, price is now trading above the 200 MA, which confirms a return into long-term bullish territory.
🟢 Based on these two system signals, we have a valid long entry setup forming.
However, the system is not fully aligned yet:
⚠️ MLR < BB Center < SMA
This suggests the internal momentum structure is still weak.
We are above 200MA and have a PSAR trigger, but the trend metrics aren't in full confluence.
📌 Strategy suggestion:
- Consider a partial spot entry only
- Avoid leverage until full confirmation
- Wait for MLR to flip above BB Center for added strength
This is a trigger-before-confirmation type of setup — and in such cases, discipline > excitement.

CAKEUSDT Short Setup – Watching 2.40 Zone for RejectionHey Traders,
CAKEUSDT is currently trading within a well-defined downtrend, consistently forming lower highs and lower lows. The recent move appears to be a corrective rally, bringing price back toward a key daily resistance zone around 2.40, which also aligns with the descending trendline.
I’m monitoring this area closely for potential bearish price action to develop, signaling a continuation of the dominant bearish trend.
Key Confluences:
Major daily resistance at 2.40
Approaching descending trendline
Market still in a clear downtrend
Possible lower high formation in progress
Trade Plan:
If I see bearish confirmation in this zone (e.g. rejection candles, bearish structure break on lower timeframes, or weakening momentum).
A strong break and hold above 2.40 would invalidate the setup!

Is #BNB About to Break Down or Not? Don't Get Caught Yello, Paradisers! Is #BNB teasing one last move up before the trapdoor opens? Let’s break down what this suspicious structure of #BinanceCoin is really telling us:
💎#BNBUSDT is currently trading around $589, which is right under 200 EMA resistance. The price has been developing inside a clear Leading Diagonal Formation. Here’s the twist: Wave 5 is still in progress, and there’s growing evidence that the move might fail before it even completes.
💎We’re seeing Bearish Divergence flashing on the MACD histogram, which historically signals fading momentum. This divergence could drag #BNBUSD down before Wave 5 finishes, causing an early breakdown of the entire structure. This would completely shift the market bias in favor of the bears.
💎Key resistance levels are stacked around $599, right under the 200 EMA. A confirmed breakout and hold above this zone would invalidate the bearish setup and open the door for a potential bullish extension above $620, but that scenario remains the less probable one for now.
💎Until then, all eyes are on support zones at $533 and the critical swing low at $471. If price closes below the diagonal’s lower boundary and drops beneath $533, it’s likely to trigger a heavy selloff toward the next major demand level at $471, which could form the next Swing Low.
Play it safe, respect the structure, and let the market come to you!
MyCryptoParadise
iFeel the success🌴

BTCUSD: 4H Golden Cross to skyrocket it to $100kBitcoin has stabilized from the strong correction earlier in the month and that is reflected on its neutral 1D technical outlook (RSI = 53.619, MACD = 70.800, ADX = 32.691). This suggests that the market has priced a bottom and since it already broke over the LH trendline, the 4H Golden Cross that was just formed today may be the trigger to resume the long term bullish trend. The bottoming pattern is a very favorable Inverted Head and Shoulders, which technically targets the 2.0 Fibonacci extension. With the 1D RSI already on a HL bullish divergence, we are buying this breakout, aiming at the 2.0 Fib extension (TP = 100,000), which is very conveniently just under the 0.786 Fib from the ATH, typically a recovery's first target.
## If you like our free content follow our profile to get more daily ideas. ##
## Comments and likes are greatly appreciated. ##

Trading opportunity for SOLUSDTBased on technical factors there is a Sell position in :
📊 SOLUSDT
🔴 Sell Now
🪫Stop loss 151.00
🔋Target 97.00
📏 R/R 2
💸RISK : 1%
We hope it is profitable for you ❤️
Please support our activity with your likes👍 and comments📝

RAYSOL/USDT – READY TO BLAST OFF? PRIME LONG SETUPThis is where smart money is likely to reaccumulate before pushing price higher.
We're targeting internal liquidity levels and prior highs with a clean risk-reward structure.
Confirmation can come from a bullish reaction or engulfing candle within the zone.
Entry Zone: 2.25 – 2.28
Targets:
TP1: 2.365
TP2: 2.485
TP3: 2.660
Stop Loss: 2.151
DYOR:
This idea is for educational purposes and reflects a personal trading plan.
Always do your own research, use strict risk management, and wait for confirmation before executing.
#RAYDIUM #RAY #RAYSOL #RAYUSDT

Is This The End of Pullback?BINANCE:SUPERUSDT has entered the support zone between 0.5142 – 0.4754 after a strong impulsive move to the upside.
This support zone is considered valid due to multiple rejections that occurred within this area in the past—indicating strong buyer interest.
Ideally, this is where we expect price to bounce and resume the bullish trend. The first sign of confirmation would be a break above 0.5272, which may open the path toward higher targets.
However, the bullish scenario remains valid only if the price stays above 0.4983—a key invalidation level.
Note:
If this level is breached before a clear candlestick confirmation, the candle pattern being used to validate the move becomes invalid.
Even if the price breaks below the invalidation level, as long as it remains within the support zone, the support is still valid — but it would require the formation of a new bullish candlestick pattern to re-confirm the potential for an upward move.

Still Have a Chance in This Sideways MarketPrice is currently moving within a wide sideways range between 2.670 – 4.000, which is roughly a 50% price fluctuation—still a tradable range if we can identify key reversal zones and market structure.
From the structure, we can see that BINANCE:ORCAUSDT has broken the previous high and formed a Higher High (HH)—a sign of strong buying momentum. This shift suggests that the support zone around 3.164 – 3.073 could hold and prevent the price from falling back to the bottom of the range at 2.670.
If the price revisits the support area (3.164 – 3.073), we can wait for bullish confirmation candles before entering. The potential upside target would be in the 3.862 – 4.000 zone.
Additional Notes:
Watch for signs of Higher Low (HL) confirmation around support
If HL forms successfully, this could be a base for continuation to the upper range

SUPERUSDT – Dual Timeframe Long Signal (1D & 3D)📅 April 13, 2025
So, we have another long system entry — but this one is a bit special.
✅ The long signal is confirmed on both the 1D and 3D timeframes, which adds confidence to the setup.
✅ MLR > SMA > BB Center – strong technical confluence
✅ Price > PSAR – trend shift confirmed on both timeframes
However, risk context matters:
⚠️ On the 3D, price is still below the 50 MA
⚠️ On the 1D, price is still below the 200 MA
That means momentum is building, but we’re not in full bullish structure yet.
📌 My advice:
- Don’t use leverage on this entry
- Spot only, partial size
- Don’t go all-in — system says “yes,” but structure says “wait and scale”
Discipline protects you. Emotions don’t.

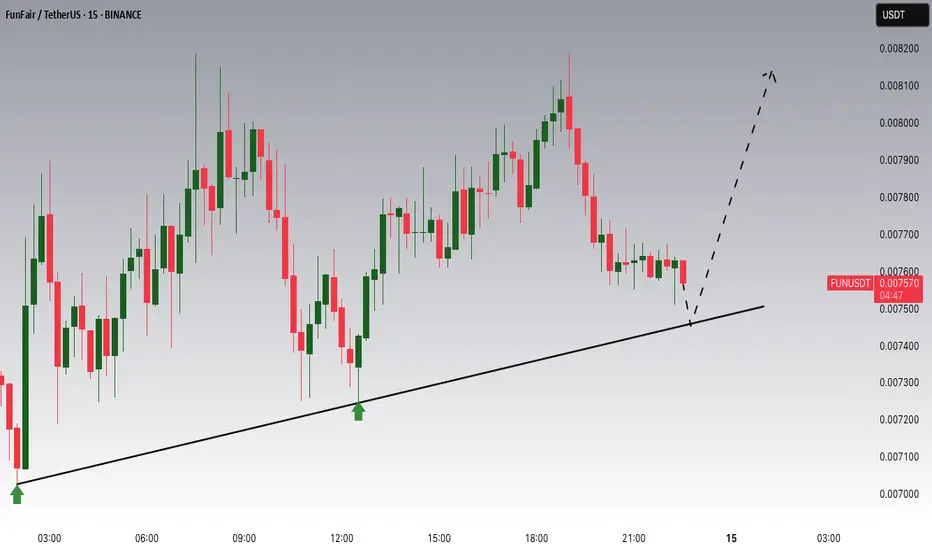
FUN/USDT In an Uptrend, Watching for Correction at Key SupportFUN/USDT has been in a solid uptrend, but we are now seeing a correction phase. The price is approaching a critical support zone around 0.007460, where previous price action has shown both support and resistance. This level is important to watch, as it could provide a potential buying opportunity if price reacts here. A break below could suggest further downside, but if support holds, a bounce toward the recent highs is possible. Monitoring closely for confirmation at this key level.
Is crypto dead? NO! IP might save the day!Price Action Analysis
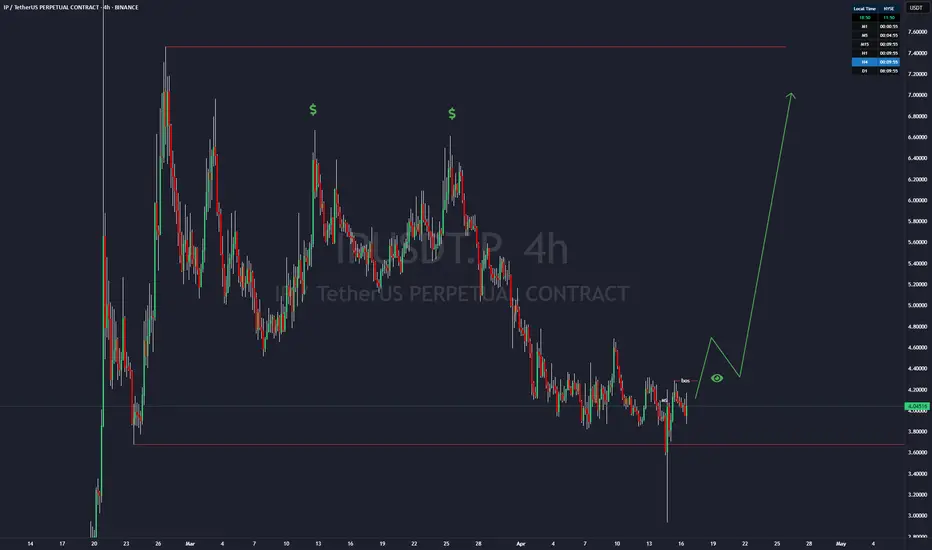
NYSE:IP recently declined to the $3.67 level, effectively sweeping external liquidity by triggering stop-loss orders below key support. This move was followed by a strong recovery, with price fully absorbing the bearish momentum and closing within the global trading range. This price action resulted in a Market Structure Shift (Change of Character, or ChoCH), indicating a potential reversal from bearish to bullish sentiment. The ChoCH suggests institutional buying interest, as the market rejected further downside and reestablished bullish structure.
However, caution is warranted. Bitcoin ( CRYPTOCAP:BTC ), a key market driver, may experience a corrective move lower, potentially influencing NYSE:IP ’s price action. As such, immediate entries are premature without further confirmation of bullish momentum.
Key Levels and Trade Setup
Break of Structure (BoS) at $4.28
The $4.28 level on the daily timeframe is pivotal, representing a potential Break of Structure (BoS). A decisive close above this level would confirm bullish continuation, signaling the start of a significant upward move. Should this occur, NYSE:IP is likely to target the following resistance zones:
$6.61: Initial target, likely aligning with prior swing highs or liquidity pools.
$6.98: Secondary target, potentially coinciding with a Fair Value Gap (FVG) or institutional sell-side liquidity.
$7.46: Final target, representing a high-probability zone for profit-taking.
Entry Confirmation
To ensure a high-probability trade, the following conditions must be met:
Daily BoS Confirmation: A clean break and close above $4.28 on the daily chart, supported by elevated trading volume.
4-Hour Timeframe Validation: A breakout above $4.28 on the 4-hour (4H) or higher timeframe, ideally accompanied by a bullish Fair Value Gap (FVG). An FVG forming on the 4H chart post-breakout would serve as an optimal entry zone, minimizing risk by aligning with institutional order flow.
Pullback to FVG: Post-breakout, a retracement to a 4H bullish FVG (e.g., $4.20–$4.25) that holds as support would confirm the setup for a long position.
Trade Execution
Set Alerts: Configure price alerts at $4.28 to monitor for a daily or 4H breakout. Ensure alerts trigger on a candle close above this level to confirm BoS.
Risk Management: Risk no more than 1–2% of trading capital per trade. Position size should be calculated based on a stop-loss placed below the FVG or recent swing low (e.g., $4.00–$4.10), targeting a minimum risk-reward ratio of 5:1.
Exit Strategy: Take partial profits at $6.61 (50–70% of position) and trail stops for the remaining position toward $6.98 and $7.46, monitoring for signs of rejection or bearish structure at these levels.
Bitcoin Correlation
Given CRYPTOCAP:BTC ’s influence on altcoin price action, monitor its key levels closely. A potential corrective move in CRYPTOCAP:BTC could lead NYSE:IP to retest lower supports (e.g., $3.85 or $3.67). Set a secondary alert at $3.85 to watch for a bounce in case of a broader market pullback. Conversely, a stabilization or bullish breakout in CRYPTOCAP:BTC would enhance the likelihood of NYSE:IP ’s bullish setup materializing.
Conclusion
NYSE:IP presents a compelling technical setup, with a ChoCH at $3.67 signaling a potential bullish reversal and $4.28 as the critical level for BoS confirmation. Traders should set alerts at $4.28, await a clean 4H or daily breakout with FVG formation, and execute entries with disciplined risk management. Monitoring CRYPTOCAP:BTC ’s price action is essential to avoid adverse market-wide corrections. This setup offers a high-probability opportunity for significant upside, provided the outlined conditions are met.
BNB/USDT: Key Support Zone Holds Potential for Bullish ReversalThe BNB/USDT market recently bounced from the 560 support level, a notable swap zone that has acted as a key turning point in past price action. The current pullback from the downward trendline appears to be directing price back toward this historically significant support area.
On the weekly timeframe, a bullish candle has formed, while the daily chart shows a pattern of higher lows, pointing to growing buying pressure. If the price revisits the 550–560 zone, a bounce is likely, potentially sparking a bullish move. With technical signals aligning across multiple timeframes, this zone stands out as a prime area of interest. The next target is the resistance zone around 613

XRP Long Swing Setup – Key Support IncomingXRP is pulling back and now approaching a critical support zone between $1.85 - $2.00. This area has historically acted as a launchpad for bullish momentum, and with the broader market eyeing a bounce, it offers a strong risk-to-reward opportunity.
🛒 Entry Zone:
$1.85 – $2.00
🎯 Take Profit Targets:
🥇 $2.20 – $2.35
🥈 $2.60 – $2.75
🛑 Stop Loss:
Just below $1.70 (keep an eye on daily candle closes)

XLM Is About to Trap Thousands of Traders ?Yello Paradisers are you prepared for the next major move on XLM, or are you walking straight into the bull trap? We’re now approaching a critical decision point on XLMUSD that could shake out a lot of traders who are only reacting instead of planning. Here's exactly how we're playing it, step by step.
💎#XLMUSDT is currently trading inside a descending channel. As of now, we see a high-probability scenario where the price gets rejected from the descending resistance, setting up an ideal short opportunity with the current structure still favoring sellers. Should this rejection play out, we expect a breakdown of the moderate support level, with our target set at the $0.1970 zone.
💎Adding more weight to this bearish outlook is the fact that XLM is trading below both the 50 EMA and 200 EMA. This technical alignment confirms broader weakness in the trend and reinforces that any breakout attempts at this stage are likely to be reactive rather than sustainable simply small retracements within a dominant bearish macro setup.
💎However, if price fails to respect the descending resistance and pushes higher, our next major decision area is the supply zone at $0.2537. At that point, as always, we’ll wait with full discipline for confirmation. We’ll be watching closely for clear bearish reversal patterns, such as an Evening Star or a Shooting Star, before taking action. Only a strong and confirmed breakout above the $0.2537 level would invalidate our bearish outlook and shift the market structure into bullish territory.
Stay focused, Paradisers. Be the hunter, not the hunted.
MyCryptoParadise
iFeel the success🌴

BITCOIN (BTCUSD): Potential Scenarios Ahead of Powell Speech
Bitcoin is consolidating for 5 days within a narrow range on a daily.
Today's Powell speech can be a trigger for a strong bullish/bearish movement.
Depending on the today's rhetorics, here are potential scenarios.
Bullish
If the price breaks and closes above the resistance of the range (86500),
we can expect upward movement to 87500 resistance.
Bearish
If the price breaks and closes below the support of the range (82500),
Bitcoin may drop way lower and reach 79600 level.
Wait for a breakout and then follow the market.
❤️Please, support my work with like, thank you!❤️
