GRASS/USDT –Trend Confirmation & Profit Target StrategyTrading Setup: GRASS/USDT Perpetual Contract
Entry Point: $1.61
Stop Loss: $1.5198
Take Profit Targets:
TP1: $1.7163
TP2: $1.7895
TP3: $1.8853
Strategy Overview
Trend Confirmation: Monitor price action for Break of Structure (BOS) or Change of Character (ChoCH) for entry validation.
Risk Management: Position size adjusted to maintain optimal risk-to-reward ratio..
This setup ensures a structured trade approach while managing risk efficiently. If you need refinements or additional indicators, let me know!
Cryptotrading

TRXUSDT Eyes Breakout Amid Bullish StructureThe TRXUSDT market appears to be forming an ABC extension pattern, characterized by a series of higher lows, while the highs remain relatively flat. The price has been consistently testing the 0.2400 resistance area, indicating the possibility of a breakout and a sustained move above this level. Recently, the price surpassed the previous week's high, which may signal either a short-term pullback or continued upward momentum. A retest of the support zone is anticipated before the market potentially resumes its upward trend. The next key resistance level is projected around the 0.2500 mark

The Most Overlooked Setup in Trading: Your Own Decision ProcessTrading psychology at its finest — where the real edge begins.
Over time, I’ve realized that most traders obsess over systems, setups, and signals... but very few ever stop to ask: “How do I actually make decisions?”🧩
The truth is — every trade I take is a result of an internal process. Not just some rule from a strategy, but a sequence of thoughts, comparisons, and feelings I go through (sometimes without even realizing it). And when I mapped it out, it changed the way I approached the market. 🔄
Here’s what I found:
1.There’s always a trigger.
Sometimes it’s a chart pattern. Other times, it’s a shift in sentiment or an alert I’ve set. But that moment when I *start* to consider entering — that’s the spark. Recognizing that moment is the first step. ⚡
2.Then comes the operation phase.
That’s when I begin scanning. I look for setups, patterns, confluences — not just at face value, but through the lens of my experience. I start running mental “what-if” simulations, visualizing what the trade could become. 🔍
3.The test phase is critical.
This is where I mentally compare the current opportunity with past winners or losers. Does it “look right”? Does it “feel like” a good trade? That moment where a setup clicks isn’t just about indicators — it’s about internal alignment. 🧠
4.Exit isn’t just a price level — it’s a decision threshold.
Knowing when to act (or not) often comes down to a shift in internal state. For me, it’s usually a combination of visual confirmation + a gut signal. When both align, I act. 🎯
📌 Why does this matter?
Because most failed trades aren’t just “bad signals” — they’re *poorly made decisions*. If I don’t understand my internal process, I’m flying blind. But when I do, I can refine it, track it, and improve it.
If you’ve never mapped out your decision-making strategy, do it. You’ll learn more about your trading than any indicator could ever teach you. 💡
👉 Keep following me for decision-making insights and real trading psychology facts — the stuff that actually moves the needle.

Thu 10th Apr 2025 BTC/USD Daily Forex Chart Buy SetupGood morning fellow traders. On my Daily Forex charts using the High Probability & Divergence trading methods from my books, I have identified a new trade setup this morning. As usual, you can read my notes on the chart for my thoughts on this setup. The trade being a BTC/USD Buy. Enjoy the day all. Cheers. Jim

BTCUSD: Attacking the 2025 Resistance looking for huge breakout!Bitcoin turned neutral on both its 1D (RSI = 47.243, MACD = -1813.400, ADX = 31.557) and 1W (RSI = 45.530) technical outlooks following the 90-day tariff pause. Technically it is going after the LH top of the Falling Wedge from its ATH and the 1D MA50, which has been the main Resistance since February 4th 2025. There is a key Bullish Divergence on the 1D RSI too, being on HL as opposed to the LL of the Falling Wedge. A breakout above the Wedge typically sets a technical target on the 2.0 Fibonacci extension, which falls just under the ATH Resistance Zone. Be ready to go long if the breakout takes place (TP = 106,000).
## If you like our free content follow our profile to get more daily ideas. ##
## Comments and likes are greatly appreciated. ##

LINK Long Spot Trade Setup – Major Support TestLINK has retraced sharply and is now sitting at a critical support zone ($10.00–$11.00), historically a strong base for reversals. This offers a solid risk/reward opportunity for a potential bounce and test of upper resistance zones.
📌 Trade Setup:
Entry Zone: $10.00 – $11.00
Take Profit Targets:
🥇 $17.00 – $17.70
🥈 $21.70 – $22.40
Stop Loss: Around $8.80

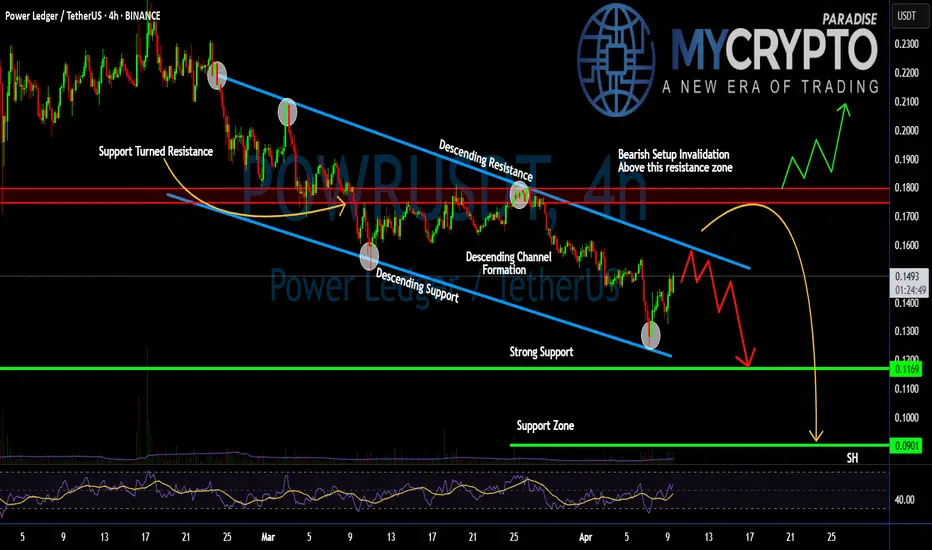
Is #POWR Bouncing Before the Breakdown? Don’t Get Caught Yello, Paradisers. Have you spotted how quietly #POWR is building up a sneaky trap? This move by #PowerLedger could wipe out impatient bulls and overly confident bears in one go:
💎#POWRUSDT is currently trading inside a clean descending channel structure, where both resistance and support levels have been perfectly respected over the past few weeks. The most recent bounce from the lower boundary (around 0.1169) was anticipated, but let’s be clear — this move is still within a bearish market structure.
💎The price is approaching a key resistance level near 0.155–0.160, which also aligns with the descending trendline. A temporary spike higher to test this area — even up to 0.179 — is likely, but don’t get fooled. These types of moves are often engineered to liquidate early short positions before the true direction resumes. Classic bull trap behavior.
💎As long as #POWR remains below the critical resistance zone at 0.180, there is no bullish market shift. This is the invalidation point for any bearish setup — and the price must close and hold above this level to suggest a sustained trend reversal. Until then, this is just another lower high in a broader downtrend.
💎On the downside, the key support levels to monitor are 0.1169, and then 0.0901 — where the strong historical support lies. If the price fails to hold 0.1169, a sharper markdown move into the 0.09 zone becomes increasingly likely. Volume remains muted and momentum indicators are not showing any strong reversal signals yet. Until we see a breakout and confirmation, every bounce is just an opportunity for the market to trap late longs.
Patience and precision are key in these conditions wait for strong confirmation before making your moves.
MyCryptoParadise
iFeel the success🌴
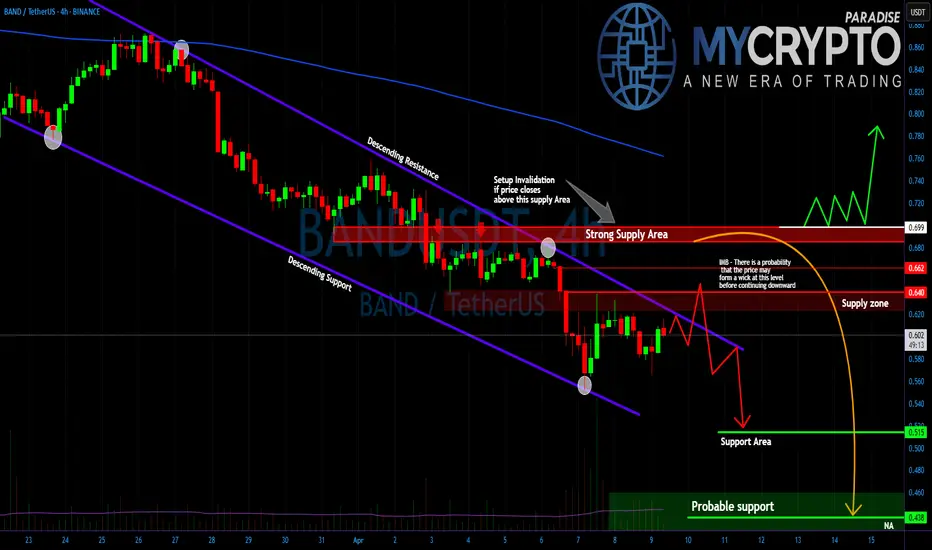
BANDUSDT Breakdown or Reversal?
Yello, Paradisers. Have you been watching #BAND lately? The setup is tightening, and it’s only a matter of time before a major move plays out one that could trap both early bulls and stubborn bears. The key now is preparation, not prediction.
💎#BANDUSDT continues to move within a clean descending channel, respecting both trendline resistance and support. The broader structure shows a clear downtrend, and at this stage, there's a strong probability that price may first push upward with a wick to fill an existing imbalance only to reject and continue lower. These kinds of deceptive moves are common during market weakness and are often designed to trap breakout traders before the real direction is confirmed.
💎#BAND price remains firmly below both the 50 and 200 exponential moving averages, which confirms that the larger trend is still bearish. The 50 EMA is currently acting as dynamic resistance, capping any short-term upside attempts. Meanwhile, the 200 EMA adds further weight to the bearish case, as price has consistently failed to reclaim or hold above it.
💎The most important level to the upside is 0.699. This is a clear supply zone, and unless the price can break and sustain above this level and reclaim both EMAs there will be no real shift in market sentiment. On the downside, 0.515 remains a critical support level. If price holds here, a short-term bounce is possible. However, if 0.515 breaks with momentum, the next key downside target becomes 0.438, marking a deeper markdown phase.
Stay focused, Paradisers. Be the hunter, not the hunted.
MyCryptoParadise
iFeel the success🌴
ETH (D1) : BUY AND HOLD NOWI recommend for long ETH in D1 timeframe
- Reason : Have got a good demand zone
- Entry : 1350-1450
- Target : 1800-2000

BTCUSD: Last chance to prove the Bull Cycle is still intact.Bitcoin remains bearish on its 1W technical outlook (RSI = 40.819, MACD = 1234.500, ADX = 47.185) as it is on the 3rd red 1W candle in a row, which just hit the 1W MA50. First contact since Sep 2nd 2024. The weeky low is also almost at the HL bottom of the Bull Cycle's Channel Up. Needless to say, it has to hold in order for the bullish trend to continue. Practically this is the market's last chance to prove that the Bull Cycle is still intact. So far the -32% decline is no different that all prior inside the Channel Up but an Arc shaped bottom needs to start forming. If it does and that's the new bottom, expect $160,000 by September.
## If you like our free content follow our profile to get more daily ideas. ##
## Comments and likes are greatly appreciated. ##

ETHEREUM (ETHUSD): Strong Bullish Move Ahead?!
It looks like we have a valid liquidity grab after a test
of a key weekly structure on Ethereum.
After a false violation of the underlined area,
the price formed a cup and handle pattern
and violated its neckline with a bullish imbalance on an hourly chart.
I think that the market can remain bullish and reach at least 1700 level.
❤️Please, support my work with like, thank you!❤️

BTCUSD: Can this M2 supply signal trigger a massive rally?Bitcoin has neutralized the previously oversold levels on its 1D technical outlook (RSI = 35.383, MACD = -1887.100, ADX = 31.814) as it is making a strong technical rebound on the 1W MA50. Today's analysis features the Global M2 supply, which is a leading indicator for Bitcoin. Both in July 2024 and November 2022 (the last two major bottoms for the market) when the M2 started to rise aggressively, Bitcoin declined and consolidated. It followed the bullish trend of the M2 with a rise of its own much later. This is similar to what the market has been experiencing since January 2025, when the M2 started rising but Bitcoin peaked on its ATH and started a decline that continues to this very date. If the pattern gets repeated then by end of April - start of May we are in for a strong Bitcoin recovery (if not earlier).
## If you like our free content follow our profile to get more daily ideas. ##
## Comments and likes are greatly appreciated. ##

Trading opportunity for SUPERUSDTBased on technical factors there is a Sell position in :
📊 SUPERUSDT
🔴 Sell Now
🪫Stop loss 0.6550
🔋Target 0.3925
📏 R/R 1,8
💸RISK : 1%
We hope it is profitable for you ❤️
Please support our activity with your likes👍 and comments📝

Will #SHIB Continue Pumping or a Bull Trap is Waiting for Bulls?Yello, Paradisers! Will #SHIBUSDT continue flying, or are we about to witness a brutal rejection straight into the demand abyss? Let’s break it down.
💎#SHIB has recently broken out of a Descending Broadening Wedge Formation on the 4H chart, a pattern that historically signals potential bullish reversals. This breakout was strong, but the price has now hit a critical Supply Zone between 0.00001530 – 0.00001650, and has already shown signs of rejection from this area.
💎The structure shows #SHIBUSD facing Strong Resistance just below 0.00001711—a level that acts as Bearish Setup Invalidation. If the price closes decisively above this zone, bears will lose control, and we could see a sharp squeeze up toward 0.00001900.
💎However, the more probable scenario for now is a retest and rejection from the supply zone, followed by a deeper pullback. Based on volume profile and historical price behavior, the Support Zone around 0.00001181 is a key level to watch for a possible bounce. If this level is lost, SHIB could fall to sweep the swing low (SH) at 0.00001081 to complete a liquidity grab before resuming any bullish trend.
💎RSI is currently near overbought territory, suggesting SHIB may be due for a short-term correction or consolidation. This lines up with the visual expectation of a potential ABC correction back into support, where Wave A has started and Wave B might complete soon.
Patience and precision are key in these conditions wait for strong confirmation before making your moves.
MyCryptoParadise
iFeel the success🌴

Is This the Final Drop Before a Major Reversal? Read This NOW! Yello, Paradisers! Are we about to witness the final leg of this move, or is one last shakeout coming before a massive reversal? Let’s break it all down using Elliott Wave principles.
💎Wave 1 initiated the downtrend, marking a strong sell-off from higher price levels. Volume surged during this phase, signaling institutional selling and overall market panic. This aggressive downward move set the foundation for the corrective Wave 2.
💎Wave 2 began as the price rebounded after hitting the local low at $1.406. This move aligns with a typical Elliott Wave correction, often retracing 50%–61.8% of Wave 1. The recovery phase pushed the price back up, potentially reaching as high as $1.964 before the next major move.
💎Wave 3, the strongest and longest in the sequence, started once the price failed to sustain above $1.964. This move could extend all the way down to $0.809, a critical level where selling pressure is expected to peak. Historically, volume is highest during Wave 3, indicating aggressive selling and potential accumulation zones forming.
💎Wave 4 might be unfolding right now, forming a short-term recovery. If the price retraces toward $1.392 but fails to break above it, the bearish wave count remains intact. It’s crucial to note that Wave 4 must NOT enter the price range of Wave 2—if it does, the entire Elliott Wave structure is invalidated, suggesting an alternative pattern like an ending diagonal or a larger correction.
💎Wave 5 is the final impulse wave. If Wave 4 faces rejection below $1.392 and consolidates, the market could see the beginning of Wave 5, pushing price toward the $0.746 support zone. This phase typically marks the last exhaustion move before a potential market reversal or a shift in structure.
Patience and strategy win the game, Paradisers! The market is designed to shake out weak hands before the real move happens.
MyCryptoParadise
iFeel the success🌴

ARBUSDT: What Happens Next Could Shock ManyYello, Paradisers! Are you watching this key level hold by a thread? The market is giving us signals, but most traders are too distracted to see them. If you're not careful here, you’ll be on the wrong side of the next big move.
💎ARBUSDT is currently trading below both the 50 EMA and the 200 EMA, confirming a strong bearish bias in the market. The trend remains in a clear markdown phase, with price action continuing to respect the descending channel, and no clear signs of bullish reversal just yet.
💎We’re approaching a moderate resistance level around $0.32 has already shown signs of weakness if price fails again at this area, it will likely confirm that sellers are still dominating, increasing the probability of a renewed leg down.
💎If the market rejects at current levels, the first key support to watch is around $0.2847, which could be hit quickly. However, the real danger lies below. A breakdown beneath the $0.2847 zone would expose the market to significant downside pressure, opening the path for a much deeper correction.
💎With ARB trading below the 200 EMA, we must remain cautious. The trend remains bearish, and any short term rally into resistance is more likely to present a shorting opportunity than a bullish breakout.
💎Still, if the market manages to close decisively above the $0.35 mark, it could shift the structure and momentum, targeting $0.37 and higher in the short term. Until then, the bias remains with the bears.
Stay focused, Paradisers. Be the hunter, not the hunted.
MyCryptoParadise
iFeel the success🌴

SUSHI is Bleeding Out — Is This the Calm Before the Final Dump? Yello, Paradisers! Have you been ignoring SUSHI lately? That might be a mistake — because the price action is showing signs that a deeper drop could be just around the corner, and those not paying attention could get caught off guard. Let’s break it down.
💎#SUSHIUSDT is still trading below both the 50 EMA and the 200 EMA, a clear confirmation that the broader market structure remains decisively bearish. The 50 EMA continues to act as dynamic resistance, repeatedly rejecting price during short-lived pullbacks, while the 200 EMA sits significantly higher, further emphasizing the strength of the existing downtrend.
💎Adding to the bearish pressure, there’s a strong supply zone between $0.620 and $0.640. This zone has capped every bullish attempt, confirming heavy distribution at these levels. Until this zone is broken with volume and conviction, upside potential remains extremely limited.
💎One key level to watch in the short-term is the 50% Fibonacci retracement at $0.586, which has turned into a reliable interim rejection level. We expect the price to tap this level again before any meaningful downside continuation is likely to unfold.
💎As long as price fails to close above the $0.568 level, the structure will remain under pressure. A breakdown below the moderate support at $0.522 would likely trigger a move into the $0.485–$0.451 major support zone, where we could see more aggressive buyers or a potential reversal setup.
💎The only scenario that would invalidate this bearish outlook is a clean breakout and sustained close above $0.640, which would reclaim the supply zone and force shorts to cover. Until then, the path of least resistance remains to the downside.
Stay focused, Paradisers. Be the hunter, not the hunted.
MyCryptoParadise
iFeel the success🌴

Bitcoin: Breaking Below $80K Soon,10% Correction on the Horizon?Hey Realistic Traders, Bitcoin is consistently hitting new lower lows. Could this signal that the bear market is here to stay? Let’s dive in.......
On the H4 chart, Bitcoin is clearly in a bearish phase. It consistently trades below both the trendline and the EMA 200, reinforcing the downtrend. Additionally, a rising wedge pattern has formed and broken out, and the MACD has shown a bearish crossover. This crossover is a key indicator, signaling that momentum is shifting from buyers to sellers.
Together, these signals suggest that Bitcoin may drop toward our first target at 79,081. After reaching this level, a short pullback is expected as traders take profits before the price continues its descent toward a new low at 73,633.
This outlook remains valid as long as the price moves below the stop-loss level at 89,557
Support the channel by engaging with the content, using the rocket button, and sharing your opinions in the comments below.
Disclaimer: "Please note that this analysis is solely for educational purposes and should not be considered a recommendation to take a long or short position on Bitcoin.

Bitcoin's Symmetrical Triangle – a short trade possible here!Bitcoin is currently forming a symmetrical triangle on the 15-minute chart, with a falling resistance trendline and a rising support trendline. This setup is a classic indication of consolidation, and the price is likely to move for downside soon as it is reversing from upper band now. If Bitcoin manages to break above 83,737, we could see a breakout of this symmetrical triangle, On the flip side, if it breaks below the rising support, 82,313 could breakdown for downside and we can see further downside then, but now we are playing inside the symmetrical triangle only and we will try to book profit once price reaches lower band of the symmetrical triangle pattern.
Disclaimer: This analysis is for educational purposes only. Please consult a financial advisor before making investment decisions.
If you Found this helpful? Don’t forget to like, share, and drop your thoughts in the comments below.

BTC/USD Long Setup – Bullish Reversal PlayAfter a sharp drop, BTC is testing a key liquidity zone around 78.2k. The market structure suggests a potential bullish reversal, with a fakeout and recovery in sight.
📌 Trade Idea:
Entry: After confirmation of a reclaim and bullish structure break (above ~79.3k)
SL: Below recent low ~77.6k
TP: 82.8k zone
RRR: ~3.2
📅 Timeframe: 30min
📈 Bias: Counter-trend long
🔁 Watch for: Price reaction at current support and market structure shift
🚨 Wait for confirmation – patience is key in volatile conditions!

Trading opportunity for MNTUSDTBased on technical factors there is a Sell position in :
📊 MNTUSDT
🔴 Sell Now
🪫Stop loss 0.8860
🔋Target 0.7000
📏 R/R 1,8
💸RISK : 1%
We hope it is profitable for you ❤️
Please support our activity with your likes👍 and comments📝

Trading opportunity for API3USDTBased on technical factors there is a Sell position in :
📊 API3USDT
🔴 Sell Now
🪫Stop loss 1.250
🔋Target 0.820
📏 R/R 1,5
💸RISK : 1%
We hope it is profitable for you ❤️
Please support our activity with your likes👍 and comments📝

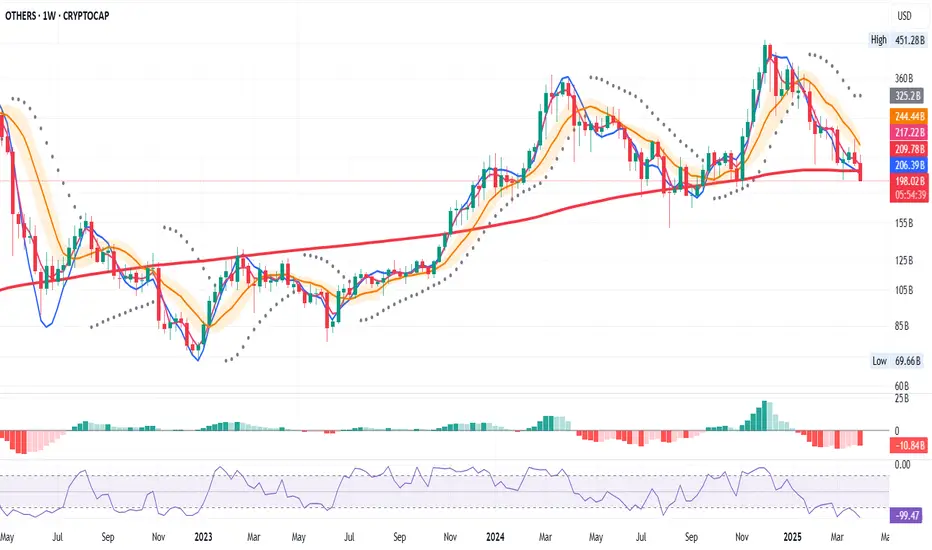
OTHERS Weekly – Testing Critical Support 200MA
The altcoin market is in a fragile state. On the weekly, OTHERS is about to close below the 200 MA—a key structural level. Meanwhile, the system remains fully bearish:
- LR < SMA < BB center
- PSAR above price
- No setup, no trade
This is where discipline saves capital. It’s easy to feel urgency when the chart looks rough, but reacting emotionally only leads to losses. Even now, I remind myself: structure first, sentiment second. When rules align, I’ll act. Until then, I protect capital, not pride.
Most of trading is waiting. The rest is having the mindset to know why.