Bitcoin (BTC/USD) 1-Hour Chart Analysis – Professional BreakdownThis BTC/USD 1-hour chart showcases a falling wedge breakout, indicating a potential bullish reversal after a downtrend. The analysis suggests that Bitcoin could move toward its next resistance target of $87,550, offering a profitable long setup for traders. Let's analyze the chart in detail.
1️⃣ Market Context: Understanding the Trend
📉 Previous Downtrend
Before the wedge formation, Bitcoin was in a strong downtrend after reaching a resistance level near $87,000–$88,000.
Sellers took control, creating lower highs and lower lows, forming a descending wedge pattern.
The price declined sharply, reflecting profit-taking, increased supply, and weak demand.
📊 Current Market Setup
Bitcoin found strong support around $81,412, a level where buyers have stepped in multiple times.
The price action compressed into a falling wedge, a classic bullish reversal pattern, indicating that bearish momentum was weakening.
The breakout from the wedge suggests that bulls are regaining control, signaling a potential uptrend.
2️⃣ Key Technical Levels & Market Structure
🔹 Resistance Level ($87,000–$88,000)
This zone has acted as a strong supply area where Bitcoin previously struggled to break through.
If Bitcoin approaches this level again, a break and retest scenario would be ideal for further continuation.
🔹 Support Level ($81,412)
This area has provided multiple bounces, confirming it as a demand zone where buyers are actively defending.
A break below this support would invalidate the bullish setup and could lead to a downward move.
📍 Breakout Confirmation
The falling wedge breakout is confirmed by bullish price action and strong buying pressure.
Bitcoin is now forming higher lows, indicating a potential trend reversal.
3️⃣ Technical Chart Pattern: The Falling Wedge
📌 What is a Falling Wedge?
A falling wedge is a bullish pattern that forms when price consolidates between two converging downward-sloping trendlines before breaking out upward.
✅ Characteristics of a Falling Wedge in This Chart
Series of lower highs and lower lows, forming a contracting price range.
Decreasing bearish momentum, seen by smaller candles near the support zone.
Bullish breakout with strong momentum, signaling a reversal.
💡 Implication:
A breakout from a falling wedge often leads to a strong upward move, especially if volume supports the breakout.
4️⃣ Trading Setup & Strategy
📍 Entry Strategy
A confirmed breakout above the wedge with a strong bullish candle.
A pullback and retest of the breakout level can provide a high-probability entry point.
🎯 Target Levels
Primary Target: $87,550 (Projected based on wedge height).
Extended Target: Above $88,000 if momentum continues.
🛑 Stop-Loss Placement
Below the support zone at $81,412 to minimize risk.
If Bitcoin falls below this level, it invalidates the bullish setup.
5️⃣ Risk & Considerations
⚠️ Potential Risks to Watch
Fake Breakouts: If BTC fails to hold above the breakout level, it could result in a bull trap, causing a price reversal.
Market Volatility: Crypto markets are highly volatile, and external factors (such as macroeconomic news or regulatory updates) could impact price movements.
Resistance Pressure: The $87,000–$88,000 zone could act as a strong resistance, leading to possible consolidation before a decisive move.
✅ Risk Management Tips:
Keep a tight stop-loss below key support.
Adjust position size based on volatility.
Wait for confirmation before entering trades to avoid false breakouts.
6️⃣ Conclusion: Bullish Bias but Caution Advised
📈 Bitcoin is showing signs of a potential uptrend after breaking out from the falling wedge pattern. However, traders should watch for a confirmation of strength before entering long positions.
Key Points to Watch:
BTC needs to hold above $83,500 to sustain bullish momentum.
A strong candle close above $85,000 will further confirm bullish control.
The $87,550–$88,000 resistance zone will be a crucial test for the next move.
🚀 Bullish outlook remains valid unless BTC drops below $81,412.
Hashtags for TradingView Idea
#Bitcoin #BTCUSD #CryptoTrading #TechnicalAnalysis #FallingWedge #CryptoSignals #TradeSetup #TradingStrategy
Cryptotrading

Bitcoin Monthly Candle close colour patterns since 2011We got the expected RED March close but it was a close thing.
but, this creates better Odds for a continued push to ATH.
We have had only 3 occasions when we had a Green Jan, Red Feb, Red March ( arrows)
2 of those went on to an ATH the following Year !
The other one was entering a Bear Market.
Of the previous 7 RED March Closes, 5 were followed by a Green April
And of those 5, 4 were followed by consecutive Green candles closes for the following Months.
As you can see, April, May and June do have more GREEN closes than Red on average but May and June is near 50/50
It could be said that March Candle close was a "Spinning Top", showing in-balance / indecision in the market. This is possibly driven by Macro events.
We had a similar situation in 2012 and April was Green, as were the following months.
We had 2 other occasions with small Red candle bodies in March, both were Hammer Candles, one inverted, that led to a red April, the other was not and let to a green April.
The March close we just had, had a Long Upper Wick. To me, this shows the BEARS had the upper hand, keeping driving down.
And thats OK, PA needed to reset but we now need a GREEN April
Statistically, April should close Green - We currently have a Score of 8 Green to 5 Red month closes for April.
April seems to have opened GREEN and I hope to see it close that colour though we do need Caution
Because of the Colour sequence over recent months, there are not many comparisons to use.

TONUSD: New bullish wave started. Next stop $9.000.Toncoin recovered its bullish 1D technical condition (RSI = 62.631, MACD = 0.117, ADX = 36.295) as this is the 4th straight week of gains following the bottom on the 3 year Channel Up. With the 1W RSI rebounding also after being oversold on March 3rd, we have a strong indication that the new bullish wave has technically started. If it only follows the weaker leg of +300% at the start of the Channel Up, it can reach $9.000 by September.
## If you like our free content follow our profile to get more daily ideas. ##
## Comments and likes are greatly appreciated. ##

BTCUSD: Bollinger squeeze paving the way for $160k.Bitcoin remains marginally neutral on its 1W technical outlook (RSI = 46.017, MACD = 2013.300, ADX = 45.410) and started last week a Bollinger Bands squeeze process. This squeeze has been present inside the 2.5 year Channel Up every time after it bottomed. Only July-August 2024 made a slightly lower low because the squeeze process turned out to be longer. Even in the event, what follows all Bollinger squeezes is an expansion rally, especially after a 1W STOCH RSI Bullish Cross and the pattern shows that by this September, we can reach $160,000.
## If you like our free content follow our profile to get more daily ideas. ##
## Comments and likes are greatly appreciated. ##

Trading opportunity for UNIUSDTBased on technical factors there is a Buy position in :
📊 UNIUSDT
🔵 Buy Now
🪫Stop loss 5.450
🔋Target 7.070
📏 R/R 2
💸RISK : 1%
We hope it is profitable for you ❤️
Please support our activity with your likes👍 and comments📝

BTC/USDT: Range-Bound Movement with Rebound Potential from Key SThe BTC/USDT market recently tested last week’s high but pulled back after encountering resistance near the 89,000 level. On the daily timeframe, the latest candle formed a doji, signaling weakening selling pressure.
The price has reached the two-week low, where underlying liquidity may trigger a bounce—especially around the psychological 80,000 level. With the market consolidating after recent sell-offs, a move toward the 85,000 area is possible. A monthly doji close is also anticipated, reflecting the broader indecision. The next upside target is the resistance zone around 84,000

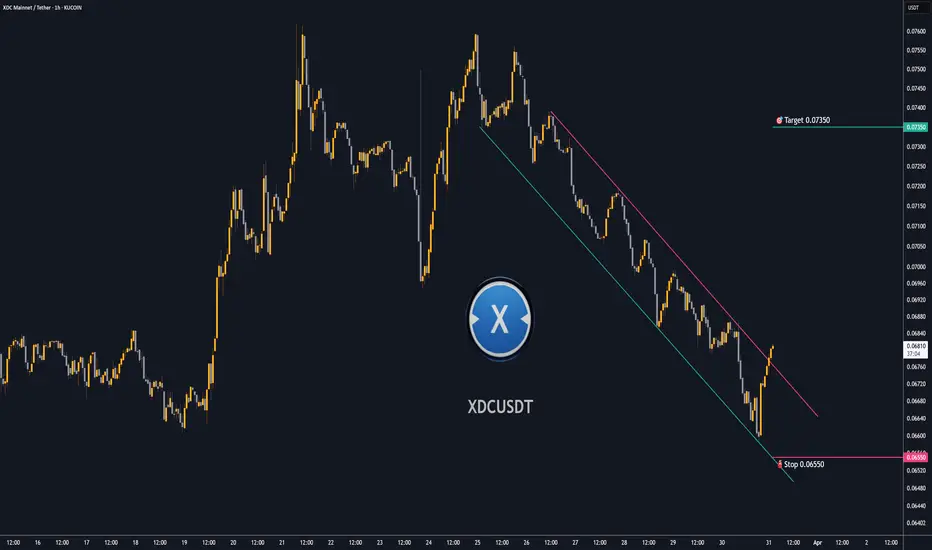
Trading opportunity for XDCUSDTBased on technical factors there is a Buy position in :
📊 XDCUSDT
🔵 Buy Now
🪫Stop loss 0.06550
🔋Target 0.07350
📏 R/R 2
💸RISK : 1%
We hope it is profitable for you ❤️
Please support our activity with your likes👍 and comments📝
"ETH/USD: Breakout Incoming? Buy Signal from Falling Wedge!"It illustrates a downward trend with a falling wedge pattern, which is a bullish reversal pattern.
Key Observations:
Falling Wedge Pattern:
The price has been trading within a downward-sloping channel.
The wedge pattern suggests a potential breakout to the upside.
Breakout Opportunity:
The price is currently near the lower boundary of the wedge, suggesting a potential buying opportunity.
A buy signal is indicated at a key support level.
Target Price:
The chart has a target zone around $2,531 – $2,562, which suggests an expected upward move.
Technical Indicators:
The price is currently around $1,815, indicating a possible bottom formation.
A bullish move from this level is expected.
Trading Idea:
Entry: Buy near the current price ($1,815).
Target: $2,531 – $2,562.
Stop-Loss: Below $1,723 for risk management.
This analysis suggests a bullish reversal with a potential breakout from the falling wedge. However, traders should confirm with volume and other indicators before entering a trade.

Chaos to Clarity: Mastering the Discipline Mindset5min read
Looking back on my journey as an investor, I can see how much my mindset shaped my path. When I first started, I was a mess—chasing every hot tip, jumping into trades without a plan, and letting my emotions call the shots. I’d feel a surge of excitement when price spiked, but the moment it dipped, I’d panic and sell, locking in losses. It was a chaotic rollercoaster, and I was losing more than I was gaining. I knew something had to change, but I wasn’t sure where to begin.
One day, I took a step back and really looked at myself. I realized the market wasn’t my biggest problem—I was. I was reacting to every little fluctuation, letting fear and greed drive my decisions. I started paying close attention to how I felt when I made trades. Was I anxious? Overconfident? I began noticing patterns. When I was stressed, I’d make impulsive moves that almost never worked out. But when I was calm and focused, my choices were better, and I’d often come out ahead. That was my first big revelation: my state of mind was the key to everything.
I decided to get serious about controlling my emotions. I started small, setting strict rules for myself. I’d only trade when I was in a good headspace—calm, clear, and ready to stick to my plan. If I felt off, I’d step away from the screen, no exceptions. It was tough at first. I’d catch myself itching to jump into a trade just because everyone else was talking about it. But I learned to pause, take a deep breath, and check in with myself. Over time, I got better at staying steady, even when the market was a whirlwind.
I also realized how much my beliefs were holding me back. I used to think I had to be in the market constantly to make money. If I wasn’t trading, I felt like I was missing out. But that mindset just led to burnout and bad calls. I started to change my thinking—I told myself it was okay to sit on the sidelines if the conditions weren’t right. I began to see that success wasn’t about being the busiest; it was about being the smartest. I focused on quality over quantity, and that shift made a huge difference. My wins started to outnumber my losses, and I felt more in control than I ever had.
One of the toughest lessons came when I stopped blaming external factors for my failures. If a trade went south, I’d point the finger at the market, the news, or even the system I was using. But deep down, I knew that wasn’t the whole truth. I had to take responsibility for my own actions. I started treating every loss as a chance to learn. What was I feeling when I made that trade? Was I following my rules, or did I let my emotions take over? By owning my mistakes, I began to grow. I became more disciplined, more aware of my own patterns, and better at sticking to what worked.
I’m not going to pretend I’m perfect now—I still make mistakes, plenty of them. At the beginning of this week, I came into trading loaded with personal problems from real life. I didn’t even pause to clear my head; I just dove straight into the charts and started opening long positions without much thought. By Friday, I realized what I’d done—I’d let my distracted, emotional state drive my decisions. So, I closed all my positions except one, cutting my losses quickly and stepping back to reassess. That’s what’s changed: I recognize those mistakes almost immediately now. I don’t hang on to them or let them spiral. I catch myself, fix the problem fast, and move on without beating myself up. That ability to pivot quickly has been a game-changer. I’m not stuck in the past anymore—I’m focused on getting better with every step.
Over time, I learned to tune out the noise and focus on what I could control. I stopped worrying about what other people were doing and started trusting my own process. I’d remind myself that investing isn’t just about the numbers—it’s about the person behind the trades. The more I worked on my mindset, the more consistent my results became. I learned to stay present, keep my emotions in check, and approach every decision with a clear head. That’s what turned me into the investor I am today—someone who’s not just chasing profits, but building a sustainable, successful approach to the markets, mistakes and all.

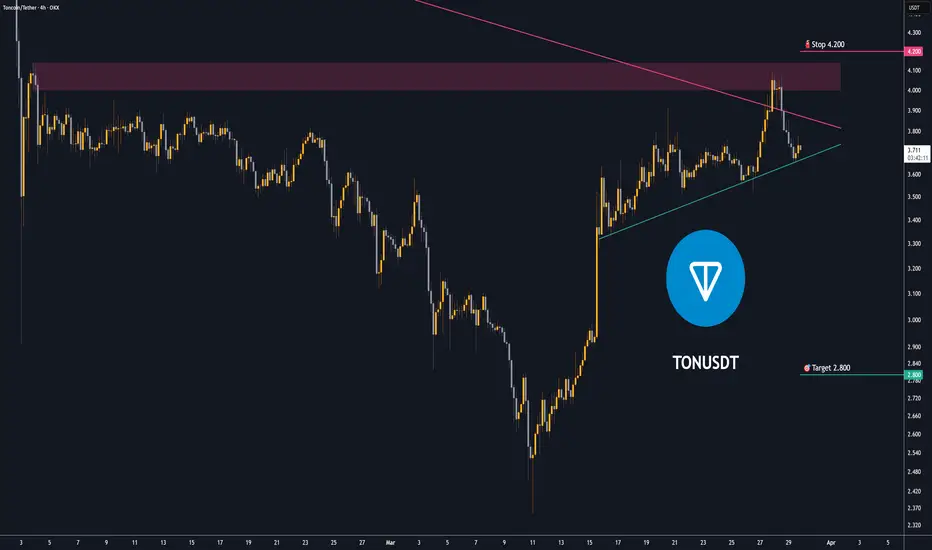
Trading opportunity for TONUSDTBased on technical factors there is a Sell position in :
📊 TONUSDT
🔴 Sell Now
🪫Stop loss 4.200
🔋Target 2.800
📏 R/R 2
💸RISK : 1%
We hope it is profitable for you ❤️
Please support our activity with your likes👍 and comments📝
Trading opportunity for GRASSUSDTBased on technical factors there is a Sell position in :
📊 GRASSUSDT
🔴 Sell Now
🪫Stop loss 1.9000
🔋Target 1.3200
📏 R/R 1,5
💸RISK : 1%
We hope it is profitable for you ❤️
Please support our activity with your likes👍 and comments📝

Trading opportunity for SSVUSDTBased on technical factors there is a Sell position in :
📊 SSVUSDT
🔴 Sell Now
🪫Stop loss 8.37
🔋Target 6.85
📏 R/R 2
💸RISK : 1%
We hope it is profitable for you ❤️
Please support our activity with your likes👍 and comments📝

HPOS10IUSDT.P : Bullish Setup Brewing (Daily Chart)Timeframe: Daily
Analysis:
MLR Nearing SMA: The MLR (blue) is below but approaching the SMA (pink), hinting at a potential bullish crossover.
MLR > BB Center: MLR exceeds the Bollinger Bands Center Line (orange), signaling growing bullish momentum.
PSAR: PSAR dots (black) are below the price, supporting an uptrend.
No SMA 200: SMA 200 unavailable - proceed with caution.
Trade Idea:
Entry: Consider a long position at the daily close.
Stop Loss: Place SL at yesterday’s PSAR level to limit downside risk.
Follow Me: Follow me for exit or profit-taking opportunities.
Outlook: MLR is poised to take SMA, which could confirm a bullish surge alongside PSAR and BB support. Stay vigilant for the crossover or reversal signals.
Risk Warning: Not financial advice, trade at your own risk.

DEEPUSDT.P | Bullish Setup Brewing (Daily Chart)Timeframe: Daily
Analysis:
MLR Nearing SMA: The MLR (blue) is below but approaching the SMA (pink), hinting at a potential bullish crossover.
MLR > BB Center: MLR exceeds the Bollinger Bands Center Line (orange), signaling growing bullish momentum.
PSAR: PSAR dots (black) are below the price, supporting an uptrend.
No SMA 200: SMA 200 unavailable - proceed with caution.
Trade Idea:
Entry: Consider a long position at the daily close.
Stop Loss: Place SL at yesterday’s PSAR level to limit downside risk.
Follow Me: Follow me for exit or profit-taking opportunities.
Outlook: MLR is poised to take SMA, which could confirm a bullish surge alongside PSAR and BB support. Stay vigilant for the crossover or reversal signals.
Risk Warning: Not financial advice, trade at your own risk.

Long Entry Signal for DGB/USDT DigiByteMLR Nearing SMA: The MLR (blue) is below but approaching the SMA (pink), hinting at a potential bullish crossover.
MLR > BB Center: MLR exceeds the Bollinger Bands Center Line (orange), signaling growing bullish momentum.
PSAR: PSAR dots (black) are below the price, supporting an uptrend.
Price > SMA 200: Price is above the 200-period SMA (red), indicating long-term bullish strength
Trade Idea:
Entry: Consider a long position at the daily close.
Stop Loss: Place SL at yesterday’s PSAR level to limit downside risk.
Follow Me: Follow me for exit or profit-taking opportunities.
Outlook: MLR is poised to take SMA, which could confirm a bullish surge alongside PSAR and BB support. Stay vigilant for the crossover or reversal signals.
Risk Warning: Not financial advice, trade at your own risk.

FARTCOIN Long Entry Signal for FARTCOIN / USDT 3Day Time FrameTicker: FARTCOINUSDT
Timeframe: 3D
Analysis:
MLR > SMA: The MLR (blue) is above the SMA (pink), signaling a bullish trend.
MLR > BB Center: MLR exceeds the Bollinger Bands Center Line (orange), showing strong bullish momentum.
PSAR: PSAR dots (black) are below the price, reinforcing the uptrend.
Price > SMA 21: Price is above the 21-period SMA (GREEN), indicating mid to long-term bullish strength for the 3Day time frame.
Trade Idea:
Entry: Consider a long position at this bar close.
Stop Loss: Place SL at the last PSAR level to limit downside risk.
Follow Me: Follow me for exit or profit-taking opportunities.
Outlook: All indicators align for a bullish move. Stay alert for reversal signals or trend shifts.
Risk Warning: Not financial advice, trade at your own risk

BTCUSD: Such consolidations end up very well for Bitcoin.Bitcoin just turned bearish again on its 1D technical outlook (RSI = 44.578, MACD = -918.200, ADX = 29.021) and with 1W still neutral, we are again on strong long term buy levels. Today's chart is yet another illustration of the market dynamics and the similarities with the previous Cycle. The market is well on its way towards the 1.618 Fibonacci extension target, which now translates to $175,000. Unless the 1W MA50 support breaks, BTC is a buy opportunity on every pullback.
## If you like our free content follow our profile to get more daily ideas. ##
## Comments and likes are greatly appreciated. ##

XRPUSD: The 5 year Channel Up is targeting 6.500XRP is neutral on its 1W technical outlook (RSI = 53.399, MACD = 0.310, ADX = 41.023) as since the Jan 13th High, the uptrend took a pause and turned into a sideways consolidation. As long as the 1W MA50 is intact, the Bull Cycle will be supported and since the dominant pattern is a 5 year Channel Up, we are on the latest bullish wave. As a matter of fact we have technically entered the last year of the bullish wave, which is so far identical to the March 2020 - April 2021 wave (also on RSI count). The market is currently (March 2025) on a consolidation much like March 2021. We estimate a similar +1,648% rise (TP = 6.500).
## If you like our free content follow our profile to get more daily ideas. ##
## Comments and likes are greatly appreciated. ##

TON/USDT: Bullish Continuation Builds Above Key Breakout ZoneThe TON/USDT market is maintaining its upward momentum after breaking out of a consolidation phase, currently testing the psychological level of 4.00. Although a pullback toward the support level and upward trendline remains possible, the breakout and close above the consolidation zone suggests that this area may now act as support.
On the daily timeframe, a bullish engulfing candle has formed, reinforcing the presence of strong buying pressure. If the market retests and holds above the breakout zone, further upside is likely. The next key target is the resistance zone around 4.40, with potential to extend toward the 4.50–4.80 range

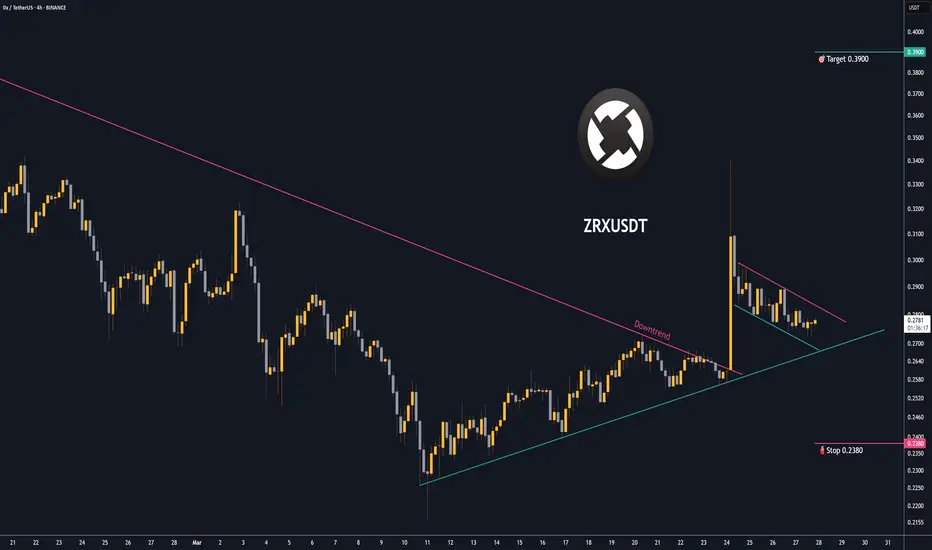
Trading opportunity for ZRXUSDTBased on technical factors there is a Buy position in :
📊 ZRXUSDT
🔵 Buy Now
🪫Stop loss 0.2380
🔋Target 0.3900
📏 R/R 2,7
💸RISK : 1%
We hope it is profitable for you ❤️
Please support our activity with your likes👍 and comments📝
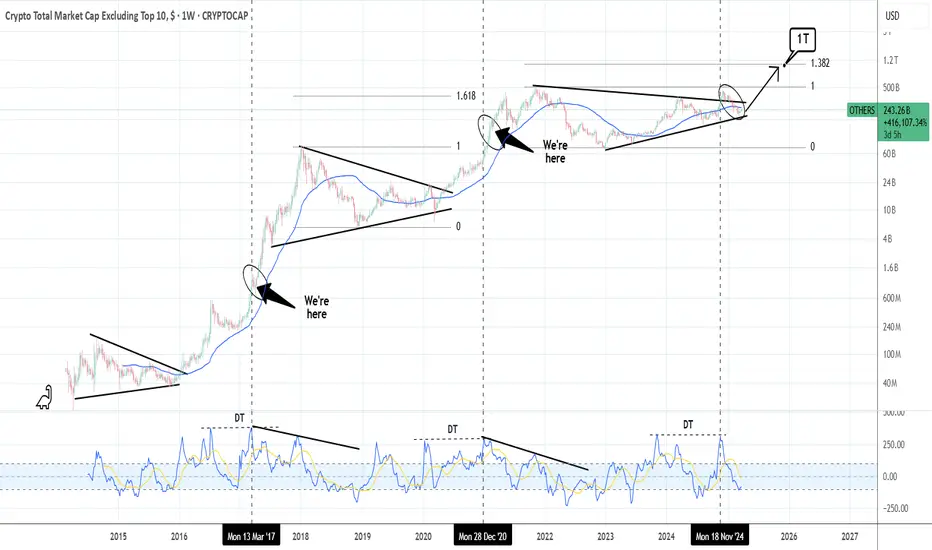
ALTSEASON: Is it really just around the corner?The Crypto Total Market Cap (excluding the Top 10) seems to agree. And it's simply because the price has already broken past the Cycle's Triangle and despite the correction, remains supported on the HL bottom trendline. According to the 1W CCI we are currently well in line with the previous two Cycles and even though the market is unlikely to reproduce the strong returns of especially the first Cycle, it does suggest that there is one last (All Time) High left. A mere 1.382 Fibonacci extension test, will give us the much sought 1 Trillion USD target.
## If you like our free content follow our profile to get more daily ideas. ##
## Comments and likes are greatly appreciated. ##
BTCUSD: What if it's just a Channel Up to $175k?Bitcoin remains neutral on its 1D technical outlook (RSI = 51.175, MACD = -714.800, ADX = 31.665) as it is stuck between the 1D MA50 and 1D MA200 but it's the wider timeframes that are particularly critical right now and more specifically the 1W, which is causing the current rebound on the 1W MA50. We can argue that the pattern since the Dec 2017 Top is a Channel Up, even though the last Bear Cycle bottom didn't make exact contact with its bottom.
We can equally however assume that the new Cycle High won't make direct contact with the Channel's Top either. And that's also backed up technically by the Fibonacci levels of the previous Cycle, which saw BTC making a Top just over the 1.618 Fib extension. Consequently we can assume the new Top to hit at least $175,000 (Fib 1.618 currently). The bullish wave is also a direct Channel Up since the November 2022 bottom after all. Even on the previous Cycle, if we exclude the COVID crash price distortion, the bullish wave was a Channel Up as well.
## If you like our free content follow our profile to get more daily ideas. ##
## Comments and likes are greatly appreciated. ##

Trading opportunity for CTCUSDTBased on technical factors there is a Buy position in :
📊 CTCUSDT
🔵 Buy Now
🪫Stop loss 0.6100
🔋Target 0.9500
📏 R/R 2,2
💸RISK : 1%
We hope it is profitable for you ❤️
Please support our activity with your likes👍 and comments📝
