$BAN ANALYSIS!MIL:BAN has strongly broken below the green support level 🟩.
🔵 What’s next? If the price approaches the blue zone, there is a potential bounce up 📈 as buyers could show interest in this area.
Cryptotrading

$LCX ANALYSIS!TSXV:LCX is testing the red resistance zone 🟥.
✅ If breakout is successful, the first target is the green line level 🟩.

Can #OM Bulls Save the Day or Not? Bears Ready For a Showdown Yello, Paradisers! Is #OM gearing up for a massive breakdown, or will the bulls step in to save the day? Let's analyze the #Mantra's latest trade setup:
💎#OMUSDT is flashing clear warning signs of weakness after forming a classic bearish divergence on the 8H timeframe. While price made higher highs, the oscillator showed lower highs, signaling a loss of bullish momentum. This is a textbook setup for an impending reversal unless buyers step in aggressively.
💎The key level to watch is the $7.48 support zone—a critical area that bulls must defend. If OM closes a candle below this level, expect a sharp drop toward the $5.00 support, with an ultimate downside target of $3.17 if the selling pressure intensifies.
💎On the flip side, the bearish setup gets invalidated above $9.26. If bulls manage to break this resistance with strong volume, we could see #OM pushing higher. However, until that happens, the bias remains bearish, and lower levels look far more likely.
The market is at a crucial tipping point—will #OMUSD crash or bounce? Let us know your thoughts in the comments. Are you shorting, or do you see a surprise rally coming? Let’s discuss.
MyCryptoParadise
iFeel the success🌴

$HNT ANALYSIS!FWB:HNT is testing the red resistance zone 🟥.
✅ If breakout is successful, the first target is the green line level 🟩.

$FWOG ANALYSIS! If price reaches the green support zone 🟩, there is a potential long entry 📈 as buyers could step in and push the price up again.
⚠️ Waiting for confirmation before entering a long position from this zone.

$PROM ANALYSIS! TURQUOISE:PROM is testing the red resistance zone 🟥.
✅ If breakout is successful:
First target: Green line level 🟩
Second target: Blue line level 🔵

$CLANKER ANALYSIS!$CLANKER is testing the red resistance zone 🟥.
✅ If breakout is successful:
First target: Green line level 🟩
Second target: Blue line level 🔵

$VEE ANALYSIS! TSX:VEE is testing the red resistance zone 🟥. If it breaks out, the target is the green line level 🟩

$GLM ANALYSIS! CSE:GLM is testing the red resistance zone 🟥. If it breaks out, the target is the green line level 🟩.

$XPR ANALYSIS!$XPR is testing the red resistance zone 🟥. If it breaks out, the first target is the green line level 🟩

Long Entry Signal for DUCK/USDT - Trading System Confirmation
Given the daily chart for DUCKUSDT and the specified indicators:
MLR vs. SMA: MLR (blue) is above SMA (pink), indicating a bullish trend.
MLR vs. BB Center: MLR is above the BB Center Line (orange), suggesting bullish conditions.
PSAR: PSAR dots (black) are under the price, confirming a bullish trend.
Exception: Since the 200-period SMA is not available, we're making an exception by proceeding without this long-term confirmation.
Current Strategy: With the entry conditions met (MLR above SMA, MLR above BB Center Line, PSAR under price), we are ready to enter a long position despite the absence of the 200 SMA for long-term trend confirmation. Proceed with caution and closely monitor for any changes or additional confirmations.

$BAN ANALYSIS! MIL:BAN has broken out of the red resistance zone 🟥, which has now turned into a green support level 🟩.
✅ If the price pulls back to this green zone, buyers could step in and push the price up again, making it a potential entry 📈.

$TST ANALYSIS!LSE:TST is testing the red resistance zone 🟥.
🟢 Option 1: If breakout occurs, the first target is the green line level 🟩.
🔵 Option 2: If it fails and retraces to the green zone, there is a potential entry 📈 for a bounce back up.

SWARMS ANALYSIS! SWARMS is testing the red resistance zone 🟥. If it breaks out, the first target is the green line level 🟩.
📢 Join me for more trade setups!

PEPE ANALYSIS!If price returns to the green support zone 🟩, there is a potential bounce up 📈 as buyers could step in again in this demand zone.
📢 Join me for more trade setups!

AVAIL ANALYSIS!If price returns to the green support zone 🟩, there is a potential bounce up 📈 as buyers could step in again and push the price higher.

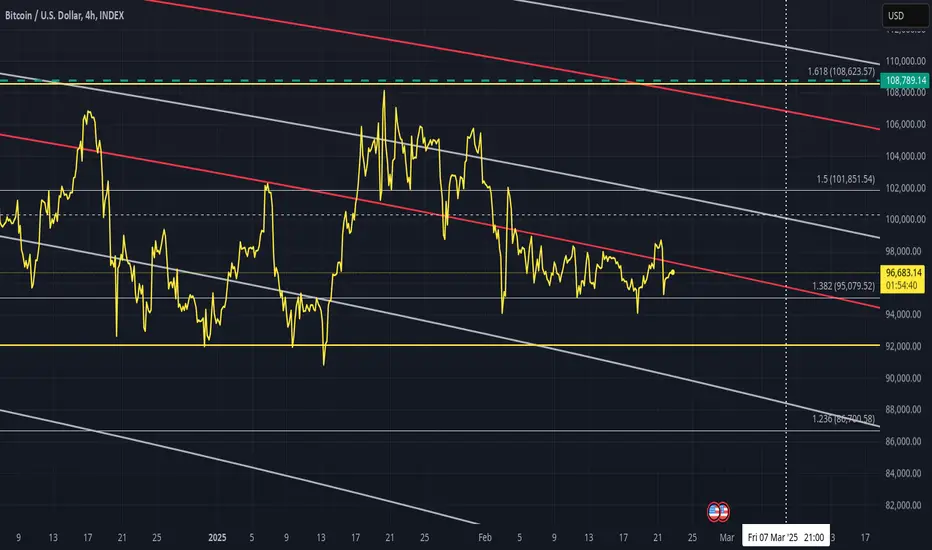
Bitcoin Short Term Price will have to move before Mid MarchThe chart is a Bitcoin 4 hour chart.
I am using the "line" to take away the noise of candle colours.
These are Fib Circle that are falling from left to right and they are strong.
The RED ones are 236 Fib circles and usualy cause rejection and you can see that currently as PA is stuck under one
We are also using the 1.382 Fib extension as support.
this is creating a closing gap, or Squeeze that will push PA to react before Monday 10 March, The date of the APEX of that triangle
And as I always say, PA will 99% of the time, react BEFORE that apex, hence the line I draw at 7th March. PA will likely move over that weekend, 8th or 9th
PA may move before hand and has the strength to push higher in a short term push but unlikely to break out of current Range of 91K - 109K till later ( Yellow Rectangle )
DOGE: Paws and ReflectIf you find this information inspiring/helpful, please consider a boost and follow! Any questions or comments, please leave a comment!
DOGE Bull Variant: Key Levels & Bullish Confirmation
Dogecoin (#DOGE) is showing some bullish potential, but it’s far from a done deal. While we’ve seen a reaction out of the Golden Corner Pocket, the bulls still have work to do before confirming a sustained move higher. Here’s what I’m watching to determine if this setup is worth my money.
Golden Corner Pocket Reaction – But Is It Enough?
A reaction from a Golden Corner Pocket is often a strong technical signal that suggests a potential continuation in trend. However, a reaction alone isn’t enough—it’s the follow-through that matters. Right now, DOGE has made a move, but I need clear bullish confirmation before considering a trade.
Step 1: Breaking Above $0.25 in an Impulse
For bulls to prove themselves, $0.25 is the first key level to clear in a strong impulse. This move would indicate buying strength and a willingness to push beyond resistance zones. Without this break, the reaction out of the Golden Corner Pocket could be nothing more than a short-term bounce.
Step 2: Taking Out a Lower High
After breaking $0.25, the next sign of strength will be taking out a prior lower high. This would indicate a shift in market structure and signal a stronger bullish trend development rather than just a temporary push up. Until this happens, the setup remains unconfirmed.
Risk Management: If Bulls Don’t Deliver, I’m Out
I’m not in the business of hopium trades—if the bulls fail to step up, DOGE doesn’t get my money. Simple as that. Without a clean breakout and confirmation of bullish intent, I’ll remain on the sidelines and wait for a better opportunity.
Final Thoughts
Right now, DOGE is at a crucial moment—a reaction out of the Golden Corner Pocket is promising, but $0.25 needs to break with conviction, and we need to clear a lower high to establish bullish control. Until then, I’m watching but not committing.
What’s your take? Do you think DOGE bulls have what it takes, or are we looking at another failed rally? Drop your thoughts below!
Trade safe, trade smart, trade clarity.

Long Entry Signal for COOK/USDTBased on the daily chart for COOKUSDT on Bybit, here's a concise analysis:
MLR vs. SMA: The MLR (blue) is above the SMA (pink), indicating a bullish trend.
MLR vs. BB Center: The MLR is above the BB Center Line (orange), suggesting bullish momentum.
PSAR: The PSAR dots (black) are under the price, confirming a bullish trend.
Exception: There is no 200-period SMA available to guide us on the long-term trend, so proceed with caution.
Current Strategy: Since all entry conditions for a long position are met (MLR above SMA, MLR above BB Center, PSAR under price), you might consider entering a long position.
Stop Loss (SL): Set the stop loss at the current level of the PSAR dots to manage risk.
Monitor My Idea: Keep monitoring my idea for any changes in trend or for potential profit-taking opportunities.
Thank you1

BTCUSD: Is it possible to reach 160k by May?Bitcoin remains neutral on its 1D technical outlook (RSI = 50.148, MACD = -503.300, ADX = 40.137), consolidating under the 1D MA50. This neutral state indicates that it is still a buy opportunity, as long as it stays under the 1D MA50. The similar consolidations (Rectangle patterns) of January 2024 and March 2023 indicate that when the 1D MA50 is reclaimed, Bitcoin gives a bullish breakout signal that targets the 4.0 Fibonacci extension. As you notice, thos phase since November 2022 are cyclical and replicate the price action over and over again. Go long, TP = 160,000 potentiall by end of April beginning of May.
## If you like our free content follow our profile to get more daily ideas. ##
## Comments and likes are greatly appreciated. ##

Can #JOE Bulls Continue this Bullish Momentum? Key Levels Yello Paradisers! Is #JOE about to break out of this falling wedge, or will the bears take full control? Here's why the next move could be massive for #JOEUSDT:
💎#JOEUSD has been trading within a falling wedge formation, consistently rejecting from its descending resistance. This pattern is typically bullish, but we need a confirmed breakout before expecting an explosive move. Currently, JOE is holding above a strong support zone at $0.1390 - $0.2099, where buyers have previously stepped in.
💎A bullish divergence is forming on the MACD histogram, suggesting weakening bearish momentum. However, for bulls to take charge, #JOE must break through the descending resistance and reclaim $0.3709 as support. If this happens, we could see a strong rally toward the $0.60+ zone, where major resistance awaits.
💎The major support zone sits at $0.209 because the bulls have stepped here to defend this level. However, if it fails, the last line of defense is at the $0.139 strong support level. As long as support holds, buyers have a chance to push #JOE higher.
💎If the support at $0.139 fails, the bearish scenario could unfold, driving #JOEUSD into a deeper correction phase. The structure remains intact for now, but a breakdown would trigger further downside risk.
Stay focused, patient, and disciplined, Paradisers🥂
MyCryptoParadise
iFeel the success🌴

Long KAVAUSDT (D1). X2Long KAVAUSDT on D1
Entry : current price (0.49-0.5)
TP : 1 (x2)
Exit : confirmation on D1 below PoC & MA200 (0.4).
RR = 5:1
Duration: from 2 weeks to 1.5-2 moths probably.
Why?
After the great capitulation we witnessed yesterday (more than 2bln liquidations of 700k traders) KAVA shows unprecedented signs of strength.
Bounced on big volume from PoC and MA200 (which are also above multi-month consolidation in july-nov 2024).
Haven't done a thorough research on project's fundamentals. So, in case you DYOR'ed it please leave a comment if there's red flags from this perspective.
But regarding TA, that's exactly that I wanted to see.

BITCOIN: Bull Flag. Will it break upwards?Bitcoin has just turned bullish on its 4H technical outlook (RSI = 56.545, MACD = -0.190, ADX = 38.441) but remains neutral on 1D. The reason is that the price is now at the top of the 2 week Channel Down, having crossed and closed over the 4H MA100 for the first time since January 31st. On the larger timeframes this Channel Down could be a Bull Flag to continue the bullish trend but of course the price needs to cross over it, otherwise a technical rejection will prevail. If it breaks upwards, go long targeting the 4H MA200 (TP = 99,500). Until it does, keep a tight SL short targeting the top of the S1 Zone (TP = 95,750).
## If you like our free content follow our profile to get more daily ideas. ##
## Comments and likes are greatly appreciated. ##
