Cryptotrading

RDNT Trading Idea ( 1H)RDNT is testing the red resistance zone 🔴. If it breaks out successfully, the next target is the green line level 🎯

Long Entry Signal for MEMEFI/USDT
Based on the daily chart for MEMEFIUSDT on Bybit, here's a concise analysis:
MLR vs. SMA: The MLR (blue) is above the SMA (pink), indicating a bullish trend.
MLR vs. BB Center: The MLR is above the BB Center Line (orange), suggesting bullish momentum.
PSAR: The PSAR dots (black) are under the price, confirming a bullish trend.
Exception: There is no 200-period SMA available to guide us on the long-term trend, so proceed with caution.
Current Strategy: Since all entry conditions for a long position are met (MLR above SMA, MLR above BB Center, PSAR under price), you might consider entering a long position.
Stop Loss (SL): Set the stop loss at the current level of the PSAR dots to manage risk.
Monitor My Idea: Keep monitoring my idea for any changes in trend or for potential profit-taking opportunities.
Thank you1

#EOS Ready for a Bullish Reversal | Key Levels to Watch Yello Paradisers! Is #EOS gearing up for a massive breakout, or is there another trap ahead? This #EOSUSD setup demands your full attention:
💎#EOSUSDT is forming a textbook falling wedge pattern, a bullish reversal structure that often precedes explosive moves. The price is currently squeezing inside this pattern, facing strong descending resistance, while the descending support has been holding steady.
💎For a bullish breakout, #EOSUSD must break above the descending resistance. If this happens, expect a sharp rally toward the $0.80 level, followed by a potential surge into the strong resistance zone around $1.40. Bullish divergence spotted on the RSI and MACD suggests that momentum is shifting. This could be the early signal of a breakout, but confirmation is crucial! Without a clean breakout, #EOS remains at risk of further consolidation or a fakeout.
💎The major support zone sits at $0.573 because the bulls have stepped here to defend this level. However, if it fails, the last line of defense is at the $0.402 strong support level. As long as support holds, buyers have a chance to push #EOS higher.
💎If the support at $0.4023 fails, the bearish scenario could unfold, driving EOS into a deeper correction phase. The structure remains intact for now, but a breakdown would trigger further downside risk.
Stay focused, patient, and disciplined, Paradisers🥂
MyCryptoParadise
iFeel the success🌴

BTCUSD: The magic of the .618 Fib signals $165k.Bitcoin is about to turn neutral again on its 1D technical outlook (RSI = 44.436, MACD = -739.700, ADX = 52.589) in an attempt to form a new bottom for February on its 2 month consolidation phase. This consolidation phase is technically no different than all others since the 2023 Bull Cycle started. We have had three such consolidation phases, two longer, one shorter but all started after market tops on a +1.0 Fibonacci progression: 1st on the 1.618 Fib, then on the 2.618, the 3.618, which brings us to the current ATH on the 4.618 Fibonacci extension. Technically the next one should be on the 5.618 Fib (TP = 165,000) then only thing that's open is whether it will follow the 2023 longer consolidation or 2024 shorter. If it follows the longer, then the 165k target may coincide with the Cycle Top towards September.
## If you like our free content follow our profile to get more daily ideas. ##
## Comments and likes are greatly appreciated. ##

Long S/USDT (h4-d1). x3-4 probably.Long Sonic on H4-D1.
Entry : current level or limit order @ 0.48
TP : 1.5 and 2
Exit : confirmation on D1 below 0.38 (2nd test on Feb,8 of local lows)
FA:
Sonic - EVM L1-chain with high performance (10k TPS with subsec finality)
Previously it was Fantom but recently rebranded.
CTO - Andre Cronje.
Trades on all major CEX.
Top-21 among Chains (Defillama) by TVL - $393mln
1/ Strategic angel investors: Michael (Curve), Stani (Aave), Robert (Compound), Tarun (Gauntlet), and Sam (FRAX), as well as our venture partners Hashed, Signum Capital, and UOB Venture Management (source: soniclabs).
2/ FDV = MCap!!!
3/ Massive airdrop on June around $100mln (current TVL - $393mln, so it's 25% profit on you locked capital if the price remains the same)
4/ 90%-revenue sharing with dApps built on Sonic
TA:
1/ EMA21 and 55 cross on H4
2/ strong bounce on high volume above PoC and MA-cross
3/ capitulation on Feb,3 (weak hands shakeout)
Can repeat that SUI did.

#PEPE Bulls Ready for a Momentum Shift? Key Levels to Monitor Yello Paradisers! Is #PEPE about to break out of this falling wedge, or will the bears drag it lower? Here's why the next move could be game-changing for #PEPEUSD:
💎#PEPEUSDT has been trapped inside a falling wedge formation, steadily rejecting off its descending resistance. This pattern is historically bullish, but a breakout confirmation is still needed. Currently, PEPE is hovering near a key support zone between $0.0000060 and $0.000012, where buyers have previously stepped in.
💎A bullish divergence is forming on the histogram, signaling a potential shift in momentum. But for bulls to take control, PEPE must break above the descending resistance and reclaim $0.0000152 as support. If this level is cleared, we could see an explosive rally toward $0.000030, where strong selling pressure is expected.
💎However, if #PEPE fails to hold the $0.0000060 - $0.000012 support range, the bullish setup could get invalidated. A breakdown below this zone would expose lower levels and increase downside risk, potentially leading to a deeper sell-off.
The next few weeks will be crucial—will the bulls step up, or will PEPE break below and give the bears full control? Be patient and trade smart, Paradisers!
MyCryptoParadise
iFeel the success🌴

DOGE Long Swing Trade Opportunity Market Context:
DOGE is trading in a major support zone, signaling a potential opportunity for a swing trade if the level holds and bullish momentum returns.
Trade Details:
Entry Zone: Around $0.25
Take Profit Targets:
$0.28 - $0.31
$0.34 - $0.37
Stop Loss: Just below $0.235
This setup aims to capitalize on the support zone for a potential upside move. 📈

Crypto Total Market Cap Consolidation: Imminent Breakout Ahead?Key Observations:
1. Symmetrical Triangle Pattern:
The price is consolidating inside a symmetrical triangle, with lower highs and higher lows.
A breakout in either direction is imminent.
2. Exponential Moving Average (EMA 200):
The 200-period EMA is at 3.26T, currently acting as resistance.
A breakout above this level could indicate a bullish trend continuation.
3. Relative Strength Index (RSI 14):
Current RSI: 49.34, slightly below the neutral 50 level.
This suggests neutral momentum, with no clear overbought/oversold signals.
A move above 55-60 could indicate increasing bullish momentum.
Potential Scenarios:
1. Bullish Breakout:
If TOTAL breaks above the triangle resistance and EMA 200, the next targets could be 3.3T - 3.5T.
Confirmation requires high volume and RSI above 55.
2. Bearish Breakdown:
A break below the triangle support could push TOTAL toward 3.0T or lower.
RSI dropping below 40 would confirm bearish momentum.
Conclusion:
The market is in a consolidation phase, awaiting a breakout. Watch for volume confirmation and EMA 200 reaction to determine the next move.

TONUSDT: Bearish Setup or Bulls' Last Stand?
Hey, traders! 😱📉 BINANCE:TONUSDT.P is in a high-risk zone, and the market is tense. We see the price testing support at *3.6191 USDT*, while resistance at *3.6891 USDT* is keeping the pressure on.
The classic scenario: if support fails, we could see a sell-off. But what if the whales are lurking, ready to turn the price around?
🔑 *Key Levels:*
*Support:*
*3.6191 USDT* – bulls are defending this level aggressively.
*3.0087 USDT* – deep liquidity zone, where the price could drop if support breaks.
**Resistance:**
**3.6891 USDT** – if sellers hold this level, the downtrend continues.
**3.8000 USDT** – a breakout above here could mean a bullish reversal.
🚩 *Trading Strategy:*
*Short Entry:* After breaking *3.6191 USDT* with a retest.
*Stop-Loss:* Above *3.6891 USDT* – if bears are wrong, it's time to exit.
*Profit Targets:*
*3.5000 USDT* – quick scalp target.
*3.3000 USDT* – solid take-profit zone.
*3.0087 USDT* – full breakdown potential if panic selling intensifies.
📈 *Technical Analysis Insights:*
Sellers are dominating – market structure remains bearish.
Volume shows liquidity accumulating in this range.
If we see a bounce from *3.6191 USDT*, a short squeeze could trigger a sharp move up.
💡 *What to Watch For?*
*Manage risk!* A downtrend doesn’t mean going all-in.
*Wait for confirmation!* No clear break = possible liquidity grab.
*Watch volume!* False breakouts are common without strong volume support.
Is BINANCE:TONUSDT.P about to dump, or will bulls hold the line? Share your thoughts below! 🧐🔥

I Turned Crazy Strategy Into a Python Program & It’s RunningAfter years of refining my AI Harmonic Fibonacci strategy, I’ve fully automated it into a Python-based trading system, and it’s now LIVE on Binance Copy Trading. The results? 773 trades in just 7 days with an insane 98% win rate!
📊 Why Is This Strategy So Powerful?
✅ AI-driven precision – No emotions, just math.
✅ High-frequency trading – More trades, more wins.
✅ Zero risk approach – Built-in smart risk management.
✅ Fully automated – Profits while you sleep.
🔥 And the best part? You can access it right now.
🔍 Search "아몰랑" on Binance Futures Copy and see it in action!
sorry I accidentally made with a Korean nickname,
#Binance #CopyTrading #PythonTrading #AITrading #TradingBot #CryptoTrading #HarmonicPatterns #HighWinRate
www.binance.com

SOLUSD: Libra crash is a buy in disguiseSolana is suffering heavy losses these past few days due to the prevailing news regarding Libra and has turned oversold on its 1D technical outlook (RSI = 30.523, MACD = -8.449, ADX = 53.479). Since the long term pattern is a Channel Up and the price is headed for its bottom, while the 1D RSI is at 30.000, which has been a buy signal for over 1 year, this is technically a buy opporutnity in disguise. The similar buy signal of June 23rd targeted the R1 level at the top of the corrective Channel. Go long, TP = 260.00.
## If you like our free content follow our profile to get more daily ideas. ##
## Comments and likes are greatly appreciated. ##

#IPUSDT is gaining strength—expecting further upside!📈 LONG BYBIT:IPUSDT.P from $2.0510
🛡 Stop Loss: $2.0235
⏱ 15M Timeframe
✅ Overview:
➡️ BYBIT:IPUSDT.P is showing strong bullish momentum, trading near $2.0510, which could serve as a breakout entry point.
➡️ POC (Point of Control) at $1.8626 confirms the highest liquidity area below the current price, indicating strong buyer support.
➡️ The price is holding local support levels and is approaching $2.0510, a breakout of which could trigger further upside movement.
➡️ If the price holds above $2.0510, an upward push toward $2.0795 and $2.1155 is expected.
⚡ Plan:
➡️ Enter long on a confirmed breakout above $2.0510.
➡️ Risk management via Stop-Loss at $2.0235, limiting potential downside.
🎯 TP Targets:
💎 TP1: $2.0795
🔥 TP2: $2.1155
🚀 BYBIT:IPUSDT.P is gaining strength—expecting further upside!
📢 BYBIT:IPUSDT.P maintains bullish momentum. If the price holds above $2.0510, we expect further gains toward $2.0795 and $2.1155. However, a drop below $2.0235 may trigger a short-term pullback.

Can #FXS Bulls Make a Comeback? Key Levels to Watch Yello Paradisers! Is #FXS gearing up for a massive breakout? Or will the bears take full control? Here’s what’s happening right now with #FraxShare (FXSUSDT) and why this next move could be crucial:
💎#FXSUSDT has been stuck in a descending triangle pattern, consistently rejecting off its downward resistance line. This structure suggests a squeeze is coming, and a decisive break will set the tone for the next big move. Currently, #FXS is hovering near a strong support zone at $1.53, where buyers are stepping in.
💎A bullish divergence on the histogram is forming, hinting at a potential momentum shift. But for bulls to take charge, #FXSUSD must break above the descending resistance and reclaim $3.32. If this level is flipped into support, we could see a strong rally toward the $5.32 resistance zone, where heavy selling pressure might re-emerge.
💎However, if #FXS fails to hold above $1.53, the bullish setup will weaken, increasing the risk of further downside. A breakdown below this level would expose the next major support at $0.36—a level where panic could set in, leading to a sharp sell-off.
💎The battle between bulls and bears will reach a climax at $0.36 because if it fails, the bears will be in total control, invalidating the bullish setup.
Stay focused, patient, and disciplined, Paradisers🥂
MyCryptoParadise
iFeel the success🌴

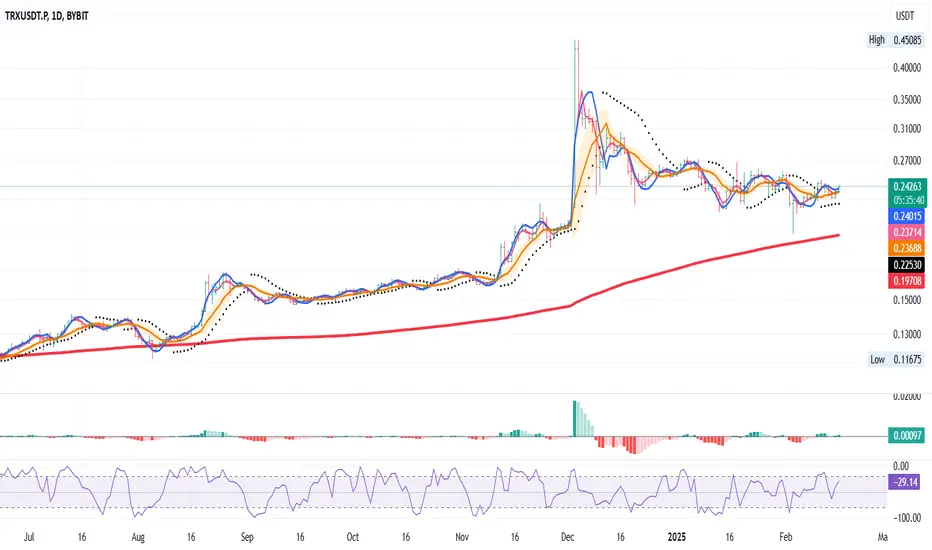
Long Entry Signal for TRX/USDT - Trading System Confirmation
Based on our custom trading system rules, we have a confirmed entry signal for TRX/USDT today:
MLR Crosses SMA: The Moving Regression Line (MLR) in blue has crossed above the Simple Moving Average (SMA) in pink, indicating a shift towards a bullish trend.
MLR Crosses BB Center Line: The MLR has also crossed over the Bollinger Bands Center Line in orange, further confirming the bullish momentum.
PSAR Flips: The Parabolic SAR (PSAR), shown by black dots, has flipped to green, signaling a bullish trend as it follows the MLR.
Price Above 200-period MA: The current price is above the 200-period Moving Average in red, confirming a long-term bullish trend.
Entry Strategy:
Action: Enter a long position on TRX/USDT based on these signals.
Risk Management:
Trailing Stop: Immediately set your trailing stop at the current PSAR level, which will adjust dynamically with price movements.
Standard Exit Strategy:
Exit: Monitor for when the MLR crosses back below the SMA. This crossover will signal a potential end to the bullish trend and an opportunity to exit the position.
This signal presents a potential trading opportunity according to our system's parameters. Remember, always consider additional analysis and risk management practices before making trading decisions.
That is it
Disclaimer: This idea is for educational purposes only and should not be considered financial advice. Always do your own research or consult with a financial advisor before trading.
MKRUSD: Channel Down bullish wave starting.Maker has just turned neutral on its 1D technical outlook (RSI = 46.979, MACD = -66.220, ADX = 40.770) as it hit the bottom of the 1 year Channel Down and bounced. The 1D RSI shows that we are on a similar rebound as on the October 25th 2024 bottom but needs to be validated by a crossing above the 1D MA50.
The two bullish waves before that have posted a price increase of +127.15%, so there is no reason to expect otherwise if the 1D MA50 is crossed. Be ready to go long (TP = 1,780).
## If you like our free content follow our profile to get more daily ideas. ##
## Comments and likes are greatly appreciated. ##

ADA Long Position OpportunityMarket Context:
ADA is showing strong buyer activity around $0.50 and holding above the 200-Day EMA. A reclaim of $0.84 could signal a medium-term structural shift, offering a solid entry for upside potential.
Trade Details:
Entry Zone: Around $0.84 on a confirmed reclaim
Take Profit Targets:
$0.98
$1.15
Stop Loss: Below $0.75
This setup provides a favorable risk-to-reward ratio, with potential for upside if the reclaim holds. 📈

#CRV Ready for a Major Comeback | Bulls Making Their MoveYello Paradisers! Are you watching #CRVUSDT? If not, you might be missing out on a major move that’s about to unfold in the #CurveDAOToken ecosystem:
💎#CRV is currently trading within a descending channel, forming a classic A-B-C correction after its explosive five-wave rally (1-2-3-4-5). The price has reached a key support level around $0.40, which could act as a potential reversal zone if buyers step in. Indicators like RSI are showing signs of exhaustion, but confirmation is needed. If bullish divergence starts forming, it could trigger the next leg up.
💎Key resistance to watch is at $0.61. A breakout above this level will be the first confirmation that bulls are taking control, potentially leading to a strong rally toward the $1.20-$1.30 resistance zone. However, failure to reclaim this level could keep #CRVUSD stuck in consolidation, with further downside risks.
💎The $0.40 support is crucial because the bulls have stepped here multiple times to defend it. If #CRV finds support here and forms a strong bounce, we could see the beginning of a new bullish impulse. The next line of defense for the #CurveDAOToken sits around $0.219.
💎However, a daily close below $0.219 would invalidate the bullish setup, opening the door for a deeper drop toward lower lows. The bears would be in total control and would drag the price to lower support levels.
Stay focused, patient, and disciplined, Paradisers🥂
MyCryptoParadise
iFeel the success🌴

$ACS Analysis ACS Analysis 🚨
ACS is currently testing the red resistance zone. If a successful breakout occurs:
🎯 First Target: Green line level

TOSH/USD Long Setup: OTE + Fake Supply zone reclaimed I've spotted a great long opportunity on TOSH/USD using a combination of advanced market analysis techniques:
1️⃣ Liquidity grab below recent lows, clearing out impatient buyers.
2️⃣ Entry at the OTE zone (Optimal Trade Entry) between 61.8% and 78.6% Fibonacci retracement, a key area for strong rejections.
3️⃣ A fake supply zone has been reclaimed, signaling bullish intent.
🎯 Trade Details:
Entry: 0.0006900 (validated in the OTE zone).
Context: Liquidity sweep below support followed by a bullish re-entry.
Confirmation: Clean reclaim of the fake supply zone with momentum.
Stop Loss: Below the last swing low for proper risk management.
Take Profits:
TP1: Previous Higher High (HH). 🚀
📊 Plan:
I’m watching for strong confirmation in the OTE zone and increased volume as the fake supply zone is reclaimed. Risk management is key—position sizing is based on capital and stop-loss placement.
This is not financial advice, just my personal setup idea based on market structure. What’s your take? Let me know below! 👇"

#DOGE READY TO EXPLODE OR BREAKDOWN? KEY LEVELS TO WATCHYello Paradisers! Are you paying attention to #DOGEUSDT? This setup looks too good to ignore. #Dogecoin is sitting at a make-or-break level:
💎#DOGE is currently in a corrective phase following its impulsive five-wave rally (1-2-3-4-5). The price has been consolidating inside a broadening descending channel, forming a classic A-B-C correction pattern. Right now, #DOGE is hovering around a major support zone between $0.1444 and $0.2024—a crucial area where buyers need to step in.
💎For bulls to take control, we need to see a breakout above the descending resistance. If #DOGEUSD manages to break out convincingly, the first target is $0.30, followed by a potential rally toward the strong resistance zone at $0.48-$0.60. But remember, if there is no breakout, there will be no bullish confirmation.
💎The support zones between $0.20-$0.14 are very important. What if #DOGE fails to hold support? The bullish setup will become invalid if the price breaks below the $0.14 level. This could open the door for a deeper drop, potentially pushing DOGE below $0.10, where the market would need to find fresh buyers to avoid a complete breakdown.
💎If RSI and MACD show bullish divergence near the support zone, this could signal the end of the correction and the start of a new impulse wave. But without this confirmation, the risk of further downside remains.
Stay focused, patient, and disciplined, Paradisers🥂
MyCryptoParadise
iFeel the success🌴

BTCUSD: Crossing of 4H MA100 brings enormous rally.Bitcoin has turned neutral on its 1D technical outlook (RSI = 50.096, MACD = -559.600, ADX = 41.025) as it is rising aggressively today and just hit the 1D MA50. This is its major Resistance level, which when crossed has caused the two main rallies of 2025 so far. The first (Dec 30th-Jan 7th) crossed the 0.618 Fibonacci before pulling back, while the second (Jan 9th-Jan 20th) made a full +20% rally. As you realize, if we do get a 1D candle close over the 1D MA50, the target for the modest scenario of Fib 0.618 is TP1 = 103,500 and if it continues (which as some point it will since the Bull Cycle has at least another 6-9 months more) for the good case scenario of +20%, the target will be TP2 = 113,000.
See how our prior idea has worked out:
## If you like our free content follow our profile to get more daily ideas. ##
## Comments and likes are greatly appreciated. ##

BITCOIN (BTCUSD): Deep Consolidation
Many of the members asked me to provide the updated analysis for Bitcoin.
The main problem with BTC is that the market is currently in a deep
consolidation.
Since the beginning of the month, the market is barely moving,
forming candles with tiny bodies and long tails.
The price is currently stuck within a narrow range on a daily.
For now, the best signal that you should wait for is the breakout
of one of the boundaries of the range, and a candle close below/above that.
The side of the breakout will accurately indicate the future direction of
the market and a real sentiment.
Be patient and wait for the signal.
❤️Please, support my work with like, thank you!❤️
