#GMXUSDT at a Key Level: Reversal Up or Further DropThe BYBIT:GMXUSDT.P price is consolidating after a sharp decline and is currently hovering around $19.870. A breakout above resistance or a drop below support will define the next move.
Two possible scenarios:
🔵 Bullish scenario: Holding above $20.480 activates a long setup towards $22.025.
🔴 Bearish scenario: Losing $19.220 confirms a short setup towards $18.040.
⚡ Best approach – place both scenarios in your watchlist and wait for confirmation.
⚡ This allows traders to avoid guessing and enter only after confirmation.
⏱ 1H Timeframe
━━━━━━━━━━━━━━━━━━━━━━
📈 LONG BYBIT:GMXUSDT.P from $20.480
🛡 Stop Loss: $19.870
✅ Overview:
➡️ BYBIT:GMXUSDT.P is stabilizing around $19.870 - $20.065 (POC), the key liquidity zone.
➡️ The price is attempting a recovery but hasn’t broken $20.210 yet.
➡️ A confirmed breakout above $20.480 would open the way toward $21.250 and $22.025.
⚡ Plan:
✅ Bullish confirmation requires a breakout above $20.480 and consolidation.
✅ Monitor reaction at $20.065 (POC) – the key volume zone.
✅ If the breakout is weak, a pullback to $19.770 is possible.
📍 Take Profit targets:
🎯 TP1: $21.250 – local resistance.
💎 TP2: $22.025 – main profit-taking zone.
🚀 BYBIT:GMXUSDT.P is testing a key level — waiting for a breakout signal!
━━━━━━━━━━━━━━━━━━━━━━
📉 SHORT BYBIT:GMXUSDT.P from $19.220
🛡 Stop Loss: $19.770
✅ Overview:
➡️ If the price fails to break $20.065 and starts dropping, a test of $19.220 is expected.
➡️ A breakdown below $19.220 could trigger a move toward $18.655 and $18.040.
➡️ Volume indicators suggest possible distribution, increasing bearish pressure.
⚡ Plan:
✅ Bearish confirmation requires a break below $19.220 and consolidation.
✅ Watch reaction at $19.770 – if it holds, a reversal could form.
✅ If selling pressure increases, the drop could accelerate.
📍 Take Profit targets:
🎯 TP1: $18.655 – intermediate support.
💎 TP2: $18.040 – deep correction.
🚀 BYBIT:GMXUSDT.P is at risk of a breakdown — expecting a move to $18.040!
Cryptotrading

#FARTCOINUSDT remains weak — expecting further downside📉 SHORT BYBIT:FARTCOINUSDT.P from $0.4570
🛡 Stop Loss: $0.4865
⏱ 1H Timeframe
✅ Overview:
➡️ BYBIT:FARTCOINUSDT.P remains under selling pressure, forming a downtrend. The price is testing the $0.4570 level, which previously acted as support, but the market remains weak.
➡️ POC (Point of Control) at $0.5449 indicates the main liquidity zone, far above the current price. This suggests seller dominance, with major trading activity still at higher levels.
➡️ A breakdown of $0.4570 would trigger further downside, opening the way to $0.4350 – $0.4168.
➡️ The $0.4168 level is a key support, where buyers previously showed interest.
⚡ Plan:
➡️ Enter SHORT from $0.4570 after confirming a breakdown.
➡️ Stop-Loss at $0.4865, placed above the nearest resistance.
➡️ Key downside targets: $0.4350 and $0.4168.
🎯 TP Targets:
💎 TP 1: $0.4350
🔥 TP 2: $0.4168
🚀 BYBIT:FARTCOINUSDT.P remains weak — expecting further downside!
📢 The market structure remains bearish. Volume continues to decline, confirming the weakening buying interest.
📢 However, a short-term bounce at $0.4168 is possible. If significant volume appears at this level, a brief return to $0.4350 could occur, but the overall movement remains downward.
📢 BYBIT:FARTCOINUSDT.P is in a bearish structure, and unless $0.4570 is reclaimed, we are likely to see further downside movement. A short-term bounce at $0.4168 is possible, but the overall trend remains weak.

BNBUSD: Massive breakout targeting 950.Binance Coin is on excellent bullish levels on its 1D technical outlook (RSI = 62.807, MACD = -6.290, ADX = 39.595) as it is trading inside a 6 month Channel Up. Yesterday it crossed over the LH trendline, confirming the continuation of the bullish wave. The last breakout hit the 1.618 Fibonacci extension. The trade is long (TP = 950) aiming for the new 1.618 Fib.
## If you like our free content follow our profile to get more daily ideas. ##
## Comments and likes are greatly appreciated. ##

BADUSDT Breakout: Is a Massive Rally Coming or a Sudden crash?
Yello, Paradisers! Are you keeping an eye on #BADUSDT? Because what’s unfolding right now could either ignite a powerful rally or trigger a sharp drop that catches many traders off guard. Let’s break down the current situation.
💎#BAD has shown a strong breakout above the previous resistance zone at $1617, which has now turned into a key support level. Following this breakout, the price experienced a pullback and is currently testing this critical support. This level will be decisive in determining the next move.
💎If the $1617 support holds, we could see a period of consolidation before an upward continuation. A successful rebound from this zone may lead to a retest of the $2400 resistance level, and in the case of sustained bullish momentum, we could be looking at an extended target around $3100. However, if the price fails to maintain this support, we will shift our focus to the lower support zones. There is juicy liquidity down there, which increases the probability of a bullish reversal. But if a daily candle closes below this lower support zone, it could indicate the start of bearish momentum, leading to a significant price drop.
💎Monitoring price behavior at the current support zone is critical, as it will determine whether #BADUSD sustains its bullish momentum or shifts into a corrective phase.
Strive for consistency, not quick profits.
Discipline and patience are the keys to navigating volatile setups like this. Play it smart, Paradisers, and always wait for the highest probability opportunities if you want to stay in the game long-term.
MyCryptoParadise
iFeel the success🌴

#APEUSDT remains bullish📈 LONG BYBIT:APEUSDT.P from $0.7715
🛡 Stop Loss: $0.7640
⏱ 1H Timeframe
✅ Overview:
➡️ BYBIT:APEUSDT.P is showing strong upward momentum, breaking through resistance levels and heading toward a new liquidity zone.
➡️ POC (Point of Control) at $0.6958 – a key volume area that acted as an accumulation zone before this move.
➡️ The price has broken out of consolidation and is approaching $0.7820 – $0.7910, where resistance was previously observed.
⚡ Plan:
➡️ Enter long after a breakout above $0.7715, confirming the bullish movement.
➡️ Stop Loss at $0.7640 – placed below the nearest support level.
🎯 Take Profit Targets:
💎 TP 1: $0.7820
🔥 TP 2: $0.7910
🚀 BYBIT:APEUSDT.P remains bullish – expecting further upside movement!
📢 BYBIT:APEUSDT.P is showing strength but approaching key resistance levels. At $0.7820 – $0.7910, watch for price reaction.
📢 If volumes support the breakout, further growth is likely.
📢 However, partial profit-taking is a wise approach.

BTCUSD: 4H Bull Flag targeting 103,000Bitcoin is neutral on its 1D technical outlook (RSI = 44.119, MACD = -816.800, ADX = 35.629) as it may have reached the 4H MA50 today but remains ranged inside a Channel Down since February 4th. According to the 4H RSI, this is technically a Bull Flag pattern like the one on Dec 26th-30th that was also formed during a 4H Death Cross. The Bull Flag bottomed and rebounded to the 1.382 Fibonacci extension. We can be bullish (TP = 103,000) at least on the short term.
## If you like our free content follow our profile to get more daily ideas. ##
## Comments and likes are greatly appreciated. ##

#AVAAIUSDT looks ready for further gains📈 LONG BYBIT:AVAAIUSDT.P from $0.05800
🛡 Stop Loss: $0.05170
⏱ 1H Timeframe
✅ Overview:
➡️ BYBIT:AVAAIUSDT.P shows strong bullish momentum, breaking key resistance levels.
➡️ The price is holding above $0.05730, confirming buyer control.
➡️ Trading volumes are increasing, signaling rising market interest.
➡️ POC at $0.05189 acts as solid support, reinforcing the long scenario.
⚡ Plan:
➡️ Wait for a confirmed hold above $0.05800 before entering.
➡️ Stop-Loss at $0.05170 to minimize downside risk.
➡️ Main target $0.06938, with intermediate take profits at $0.06165 and $0.06640.
🎯 Take Profit Targets:
💎 TP1: $0.06165
🔥 TP2: $0.06640
🚀 TP3: $0.06938
📢 Monitor $0.05730 – a breakout above strengthens the bullish case.
📢 Volume increase supports upward movement, confirming buying interest.
📢 Risk management – closing the trade if $0.05170 is broken down.
🚀 BYBIT:AVAAIUSDT.P looks ready for further gains, expecting a move towards targets!

#ALPHA: Will the Bulls Take Over or Is Another Shakeout Coming?Yello, Paradisers! Is #ALPHAUSDT ready for a major breakout, or will weak hands get liquidated before the real move begins? Let’s dive into the latest setup of #Stella:
💎#ALPHA is trading within a falling wedge, a classic bullish reversal pattern. This setup often signals a strong breakout once the price breaks above the descending resistance. The probability of a bullish breakout is high due to the bullish divergence on the MACD.
💎The immediate resistance is at $0.0659. A decisive break and close above this level could trigger a bullish rally toward the next target at $0.0934. But the real game-changer will be the strong resistance zone around $0.12. If ALPHA pushes through that, you can expect fireworks.
💎The bullish divergence on the MACD further strengthens the bullish outlook. This indicates potential momentum building up for a reversal. However, don't rule out a possible liquidity grab—we might see the price dip towards the $0.0368 or even the $0.0245 strong support zone to shake out weak hands before the real move happens.
💎The $0.0368 support level is crucial. A breakdown below this could lead to a retest of the $0.0245 zone. If #ALPHAUSD falls below $0.0245, the bullish setup would be invalidated, and we might see a deeper correction towards $0.01. Stay vigilant and manage your risk carefully.
Stay focused, patient, and disciplined, Paradisers🥂
MyCryptoParadise
iFeel the success🌴

Market Situation for #MOODENGUSDT📊 Market Situation for BYBIT:MOODENGUSDT.P
The asset is in a phase of uncertainty, consolidating between key levels. Price is forming an accumulation zone, where the next move will depend on reactions. A breakout from this range will determine direction – either a rally towards $0.07472 or a drop to $0.05624.
✅ The best approach in this situation is to add both scenarios to the watchlist and monitor price action.
✅ This allows traders to avoid premature entries and only enter after confirmation.
👉Two possible scenarios BYBIT:MOODENGUSDT.P
━━━━━━━━━━━━━
Bullish scenario
🔵 LONG BYBIT:MOODENGUSDT.P from $0.07060
🛡 Stop Loss: $0.06877
⏱ 1H Timeframe
Overview:
➡️ BYBIT:MOODENGUSDT.P is showing signs of reversal after testing support at $0.06376.
➡️ Volume is increasing, suggesting possible accumulation by buyers.
➡️ A breakout above $0.06920 and confirmation could push the price toward $0.07315 and $0.07472.
Take Profit targets:
💎 TP1: $0.07315 – first resistance level.
💎 TP2: $0.07472 – main profit-taking zone.
Plan:
➡️ Bullish confirmation requires a solid breakout above $0.06920.
➡️ Entry is preferred after a retest or with increasing volume.
➡️ If the breakout happens on low volume, it might be a false move.
━━━━━━━━━━━━━
Bearish scenario
🔴 SHORT BYBIT:MOODENGUSDT.P from $0.05914
🛡 Stop Loss: $0.06054
⏱ 1H Timeframe
Overview:
➡️ If the price fails to break $0.06376 and starts dropping, further downside is likely.
➡️ Sellers are active, and a loss of $0.05962 could trigger a selloff.
➡️ Support at $0.05624 could be reached if the downtrend continues.
Take Profit target:
💎 TP1: $0.05624 – support test.
Plan:
➡️ Bearish confirmation comes with a breakdown below $0.05962.
➡️ If volume increases on the drop, expect an accelerated decline.
➡️ If the price rebounds sharply, the short position should be reconsidered.
🚀 BYBIT:MOODENGUSDT.P Waiting for the Signal!

#SUSHI Holders, Beware: A Major Move Is Brewing in the EcosystemYello Paradisers! Have you been watching #SUSHIUSDT? If not, now’s the time to pay attention. #SushiSwap is approaching a critical point that could spark a bullish breakout:
💎#SUSHI has completed a classic 5-wave impulsive structure, with Wave 5 peaking at around $2.80. What followed is an A-B-C corrective wave, bringing #SUSHI down to its current levels. Right now, we’re seeing Wave C testing the descending support near $0.92. The key question: Will this be the end of the correction, or is there more downside ahead?
💎For the bulls to regain control, #SUSHIUSD needs to break above the $1.356 resistance. A solid breakout here could trigger a rally towards $1.80, and if momentum holds, a push into the strong resistance zone between $2.60 and $2.80. However, if #SUSHI fails to clear this hurdle, expect more sideways action or even a retest of lower levels.
💎On the downside, we have strong support at $0.70. This strong support has held many times more and we believe buyers will setup in to defend this level. The next line of defense for the bulls is present at $0.60.
💎If a candle closes below this level, the bullish setup is invalidated, and we could see a sharp decline towards $0.40 or even lower. This would mark a failure of the corrective structure, leading to a deeper bearish trend.
Stay focused, patient, and disciplined, Paradisers🥂
MyCryptoParadise
iFeel the success🌴

#SWELLUSDT longsignal📉 LONG BYBIT:SWELLUSDT.P from $0.01928
🛡 Stop Loss: $0.01890
⏱ 1H Timeframe
✅ Overview:
➡️ BYBIT:SWELLUSDT.P is showing a strong upward movement after breaking out of consolidation. The price has broken key resistance levels and is now forming a retest zone, confirming bullish strength.
➡️ POC (Point of Control) is located at $0.01175, far below the current price, indicating a shift to a new accumulation phase.
➡️ Trading volumes have increased significantly, which could further strengthen the upward impulse.
⚡ Plan:
➡️ Enter LONG at $0.01928 after confirming the breakout level.
➡️ Stop-Loss set at $0.01890 to protect against false breakouts.
➡️ Primary targets – $0.01967, $0.02013, and $0.02065, where partial profit-taking is possible.
🎯 TP Targets:
💎 TP1: $0.01967
🔥 TP2: $0.02013
⚡ TP3: $0.02065
🚀 Expectation: If the current trend holds, BYBIT:SWELLUSDT.P may continue its upward movement towards $0.02065 and beyond.

#MELANIAUSDT further bearish movement!📉 SHORT BYBIT:MELANIAUSDT.P from $1.420
🛡 Stop Loss: $1.440
⏱ 1H Timeframe
✅ Overview:
➡️ BYBIT:MELANIAUSDT.P continues its bearish trend, failing multiple times to break above resistance $1.469.
➡️ POC at $1.469 indicates a strong liquidity zone, acting as resistance and reinforcing bearish pressure.
➡️ The price broke below $1.424, confirming further downside momentum.
➡️ The next key support level is $1.380, which is the primary target for this short setup.
⚡ Plan:
📉 Bearish Scenario:
➡️ Enter SHORT from $1.420 , as the price continues its decline.
➡️ Manage risk with Stop-Loss at $1.440 to protect against a potential reversal.
➡️ Main downside target:
🎯 TP Target:
💎 TP1: $1.380 — the nearest support level for profit-taking.
📢 If the price BYBIT:MELANIAUSDT.P remains below $1.424, the downtrend is likely to continue.
📢 However, a move back above $1.440 could invalidate the short setup.
🚀 BYBIT:MELANIAUSDT.P Expecting further bearish movement!

BTCUSD: Falling Wedge close to breaking to $105.5kBitcoin is marginally bearish on its 1D technical outlook (RSI = 44.917, MACD = -782.200, ADX = 41.331) but neutral on both 1H and 4H, as it is close to conclude a Falling Wedge. Today the price held the 1H MA50 for the first time after a test of the pattern's top, which increases the chances of a bullish break out. Buy only if the break out happens and target the 2.0 Fibonacci extension (TP = 105,500), which happens to be just under the R1 level.
## If you like our free content follow our profile to get more daily ideas. ##
## Comments and likes are greatly appreciated. ##

1000BONKUSDT: Ready for a Breakout?
🔥 **1000BONKUSDT.P** has been consolidating under resistance for a long time, accumulating liquidity. The price has tested **0.017630 USDT** multiple times, and whales are clearly building positions. The question is: will we see a breakout, or will there be another dip before the pump?
---
🔑 **Key Levels:**
**Support:**
**0.017630 USDT** — Major demand zone. A breakdown below this level could trigger further declines.
**0.016800 USDT** — Last defense for bulls to maintain the uptrend.
**Resistance:**
**0.018481 USDT** — Initial liquidity zone, where a local rejection may occur.
**0.019000 USDT** — Key level that, if broken, opens the way to 0.020 USDT.
**0.024379 USDT** — Ultimate target where large players might start taking profits.
---
🚀 **Trading Strategy:**
**Entry Points:**
- Long upon breakout of **0.018481 USDT**, confirmed by volume increase.
- Alternative entry on a retest of **0.017630 USDT**, provided support volumes increase.
**Stop-Loss:**
- Below **0.016800 USDT** to avoid liquidity grabs before the potential move up.
**Take-Profit Targets:**
**0.019000 USDT** — Partial profit-taking, securing position.
**0.020000 USDT** — Major target if momentum follows through.
**0.024379 USDT** — Ideal scenario if a strong impulse move occurs.
---
📈 **Market Analysis:**
Price has been consolidating near resistance, suggesting an impending breakout.
Large orders in the order book indicate whale activity.
Volume is starting to pick up, signaling a potential phase transition.
---
💡 **Conclusion:**
1000BONKUSDT.P is at a decisive moment. A confirmed breakout above **0.018481 USDT** could lead to a strong bullish move. However, if another fakeout and dump happen, it's time to reassess. What’s your take—ready for the pump? 🚀💬

#MANA Correction is Almost Concluded | Will we see a Reversal?Yello Paradisers! Are you keeping an eye on #MANAUSDT or not? If not, you might want to start now because #Decentraland is showing some textbook Elliott Wave patterns that could signal either a massive breakout or a steep drop:
💎#MANA has completed a classic 5-wave Elliott structure, peaking at Wave 5 near the $0.90 area. This was followed by an ABC corrective wave, pulling #MANA back down into the descending channel. Right now, #MANA is hovering around $0.3229, consolidating just above the strong support at $0.2531.
💎For bulls to regain control, #MANAUSD must break above the descending resistance, currently near $0.5197. A clean breakout here would likely trigger an impulsive rally, pushing towards the major resistance zone between $0.80 - $0.90—the same level as the previous Wave 5 high. But don’t get ahead of yourself. Without this breakout, the bulls remain on shaky ground.
💎On the downside, if #MANA closes below the $0.2531 support, the next critical level is the broader support zone at $0.1691. A close below this would invalidate the bullish setup and open the door for further downside, potentially dragging #MANA towards $0.10 or lower. The SH (swing low) highlighted on the chart would be the next key area to watch if the bearish scenario plays out.
Stay focused, patient, and disciplined, Paradisers🥂
MyCryptoParadise
iFeel the success🌴

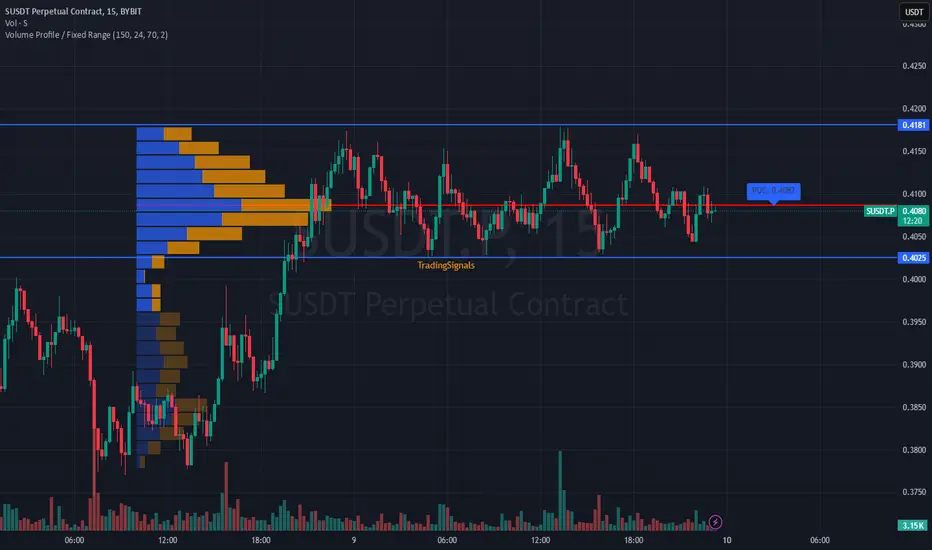
Analysis of #SUSDT – Watching for a Breakout📊 Analysis of BYBIT:SUSDT.P – Watching for a Breakout
15M TF
✅ Overview:
➡️ BYBIT:SUSDT.P is trading within a range, consolidating between $0.4025 (support) and $0.4181 (resistance).
➡️ POC (Point of Control) at $0.4087 represents the highest liquidity area, making it a key level where price could decide its next move.
➡️ A breakdown below $0.4025 could lead to further downside, as there is little strong support below this level.
➡️ If the price holds above $0.4181, we could see a push toward higher resistance levels.
⚡ Plan of Action:
📈 Bullish Scenario:
➡️ If price holds above $0.4087 (POC) and breaks $0.4181, an upward move is expected with increased momentum.
📉 Bearish Scenario:
➡️ If price drops below $0.4087 and breaks $0.4025, expect accelerated downside movement.
🚀 BYBIT:SUSDT.P is in a consolidation phase – preparing for a breakout!
📢 BYBIT:SUSDT.P is in an accumulation phase, and a breakout of key levels will determine the next trend.
📢 Watch volume closely – an increase on a breakout will confirm a stronger move.
#SPELLUSDT continuation of the downtrend📉 SHORT BYBIT:SPELLUSDT.P from $0.0009866
🛡 Stop Loss: $0.0010430
⏱ 1H Timeframe
✅ Overview:
➡️ BYBIT:SPELLUSDT.P remains in a downtrend, forming lower highs and lower lows. The price failed to hold above $0.0010000, signaling weak buying momentum.
➡️ POC at $0.0010250 suggests that major volume accumulation is above the current price, reinforcing the bearish outlook.
➡️ If the price stays below $0.0009866, a continuation towards $0.0009485 and $0.0008901 is expected.
➡️ Volume remains moderate, indicating declining demand and a likely continuation of the downtrend.
⚡ Plan:
📉 Bearish Scenario:
➡️ Enter SHORT from $0.0009866 if price confirms rejection at resistance.
➡️ Risk management with Stop-Loss at $0.0010430, above key resistance.
🎯 TP Targets:
💎 TP1: $0.0009485 — first profit-taking level.
🔥 TP2: $0.0008901 — major support zone.
🚀 BYBIT:SPELLUSDT.P Expecting a continuation of the downtrend!
📢 BYBIT:SPELLUSDT.P remains under selling pressure. If the price holds below $0.0009866, further downside movement towards $0.0009485 and then $0.0008901 is expected.
📢 However, if the price reclaims $0.0010430, the bearish scenario could be invalidated, leading to a potential upward correction.

Downtrend #BUZZUSDT📉 SHORT BYBIT:BUZZUSDT.P from $0.02640
🛡 Stop Loss: $0.03010
⏱ 1H Timeframe
✅ Overview:
➡️ BYBIT:BUZZUSDT.P is in a strong downtrend, consistently forming new lower lows. The price continues to decline after rejecting $0.03584 (POC), confirming seller dominance.
➡️ The price is currently testing the $0.02700 support level, but given the overall trend, a further breakdown is likely.
➡️ If the $0.02640 level is broken and the price holds below it, a continuation toward $0.01999 is expected.
➡️ Volume is decreasing, indicating weak buyer support and a high probability of further downside.
⚡ Plan:
📉 Bearish Scenario:
➡️ Enter SHORT from $0.02640 if price confirms a breakdown.
➡️ Risk management with Stop-Loss at $0.03010, above the nearest resistance zone.
🎯 TP Target:
💎 TP1: $0.01999 — strong support and profit-taking zone.
🚀 BYBIT:BUZZUSDT.P Expecting a continuation of the downtrend!
📢 BYBIT:BUZZUSDT.P remains under selling pressure, and if the price breaks below $0.02640, further downside movement is likely.
📢 However, if the price reclaims $0.03010, the bearish scenario could be invalidated, leading to a potential bullish correction.

Is Ethereum Ready to Rally? Critical Levels and Elliott Wave InsIf you find this information inspiring/helpful, please consider a boost and follow! Any questions or comments, please leave a comment!
Ethereum Analysis: Key Levels and Market Structure
Ethereum has been moving in tandem with Bitcoin, but there are some distinct levels and market structures developing that are worth paying attention to. While most of the focus has been on BTC, ETH has been presenting some solid trade setups as well. Here’s my breakdown of where we stand and what I’m watching next.
Holding the Low: 2563 as a Double Zig-Zag
Ethereum has been working through a potential 2xZZ (double zig-zag) pattern, and 2563 stands as a key level to maintain that structure. If this low holds, the bullish case remains intact. However, we aren’t currently sitting in a Golden Zone (GZ) or a major discount level based on the recent dump, which adds some caution to aggressive entries.
Bullish Steps: 2665 & 2800 as Critical Resistance
For any bullish momentum to materialize, the first step is 2665—this level needs to break for buyers to start taking control. From there, 2800 is the larger resistance level that Ethereum must break and hold to show real strength. A rejection at this zone could lead to another corrective leg downward.
Confirmation of the Double ZZ: 2900 Break
The completion of the double zig-zag pattern will be officially confirmed with a break of the 2900 pivot. This is the critical point where bullish structure would be fully validated, signaling further upside potential. Until that happens, Ethereum remains in a make-or-break zone.
Until then, I’ll be watching how price action (PA) prints before making any major decisions. What do you think—will ETH break through or are we looking at more downside? Drop your thoughts below!
Trade safe, trade smart, trade clarity.

ETHUSD: Replicating Bitcoin's past Cycle to $14,000?Ethereum is almost oversold on 1D and straight bearish on its 1W technical outlook (RSI = 41.942, MACD = 3.920, ADX = 30.130) struggling to find bullish momentum and get detached from the consolidation it's been inside since March 2024. The whole Cycle however is technically much like Bitcoin's 2018-2021 Cycle. As the 1W MA200-1M MA50 zone supported Bitcoin on the Cycle bottom and later during the COVID crash, it is doing so on Ethereum for the past 2 years and most recently this week. If it holds, we may see a massive rally starting to the 1.618 Fibonacci extension (TP = 14,000).
## If you like our free content follow our profile to get more daily ideas. ##
## Comments and likes are greatly appreciated. ##

BTCUSD: Is it about to explode while the Dollar tanks?Bitcoin remains bullish on its 1W technical outlook (RSI = 62.733, MACD = 8478.500, ADX = 61.463) but neutral on 1D, which suggests that it is a buy opportunity long term. What can really help the price explode from this point onwards though, is a strong drop on the DXY, which has already shown signs of peaking. Based on the last 2 Cycles, it is out of the Accumulation Phase and is has completed the fake-out, which traps investors into thinking that higher prices are coming. This is where a bearish reversal has taken place in the past, lasting 399 days until its bottom, which is where BTC tops. Get ready for a full 2025 Bitcoin rally.
## If you like our free content follow our profile to get more daily ideas. ##
## Comments and likes are greatly appreciated. ##

The Moment We've Been Waiting Prime Opportunity on $TOSHIUSDA golden long opportunity has emerged as COINBASE:TOSHIUSD taps into a fresh daily demand zone, aligning perfectly with an M15 demand zone. This setup signals a high-probability bullish move from a key liquidity area.
🔥 Key Levels to Watch:
✅ M15 Demand Zone – Fresh liquidity, strong potential for an impulsive move.
✅ Daily Demand Zone – Higher time frame confluence for added confidence.
✅ H1 Demand Zone – For those who prefer extra confirmation, waiting for the H1 zone may provide additional confluence for a safer entry.
With market momentum shifting, this could be the perfect time to enter a long position on $TOSHIUSD! 📈 Keep an eye on price action and manage your risk accordingly.
#TOSHUSD #CryptoTrading #Forex #SupplyAndDemand #LongOpportunity #TechnicalAnalysis

Solana Coin Do Not Miss This Long for 50% potential Gains In this video I have outlined a plan to buy Solana coin Using a suite of Fibonacci tools I have all the levels you need marked out . Follow for future videos and ensure to BOOST my Idea . Thankyou
