SOLUSD Solano - 24 full chart pattern -i tried the Publish video idea and recorded the whole process but i must have done something wrong. I saw someone yesterday who had used it successfully so i will try again. This is the chart i created for that video. Im going to zoom in and try the video again at smaller levels. Im interested in buying more of this coin. I am just curious about its sustainability. The internet seems mixed. Any ideas out there please join in. Yes i chart weird. I am an artist, this is a process i sed to examine closely the details and patterns emerging. Right now i am marking the anticipation of the FED, I want to see what pattern they create, if they are smart they are making money on their own waves. But that remains to be seen, technically their current solution is spend more and devalue the dollar with inflation . Archaic systems are not changing properly, the correction may need to be physical shifts.
Crytpo

Alts are on the brink of melting faces.As you can see Total 3 is in a descending broadening wedge and was most recently rejected at the upper diagonal line of resistance.
Assuming BTC continues it's bullish reversal we can expect Alt's to do likewise.
Could we come back down and test the recent lows again? Yes. But there's also a good probability that we hold the 720B area as support and attempt at breaking out of the descending line of resistance. A break above would finalize an inverse head and shoulder pattern with a breakout target at the .786 fib level which is approximately at 1 trillion.
I think we could see this break out around mid-late February with a run towards 1 trillion ending at around mid-March.

ETHUSD - 24 hour chart pattern study with notesI don't see how the rhythm is not detectable, but it is up to the masses to choose the path. i just think when they adopt something, it seems to be the algorithms used for trading that set the patterns and you see the ripple of that in all stocks and crypto. Even the successful social media pump and dumps use the same approach. Find the most common heuristic and manipulate it. it does however add to the survival of the fittest approach and the adoption of those survival techniques.

MATIC Polygon - 15 MIN CHART PATTERNS EXPLORATIONTaking a closer look at MATIC on the 15 min scale and measuring that against the next post which will be at the 4 hour scale.

MANA 15 min charting patterns. Quick time frames.Trying to bring the fractal patterns all the way down to the lowest point. It is amazing the percentage of major transactions to minor transactions and these fluctuations. This is the adoptive strength governments are concerned about. I say We might be moving to a world where countries are defined by the price tag
and the service. It's 2022. Why squabble over land and religion. there is plenty.

Polygon Future casting. The three paths.Matic is less rigid in its geometrical path through time. Its fluid. more curves. This seems like an advance in function. I will keep an eye out for it.

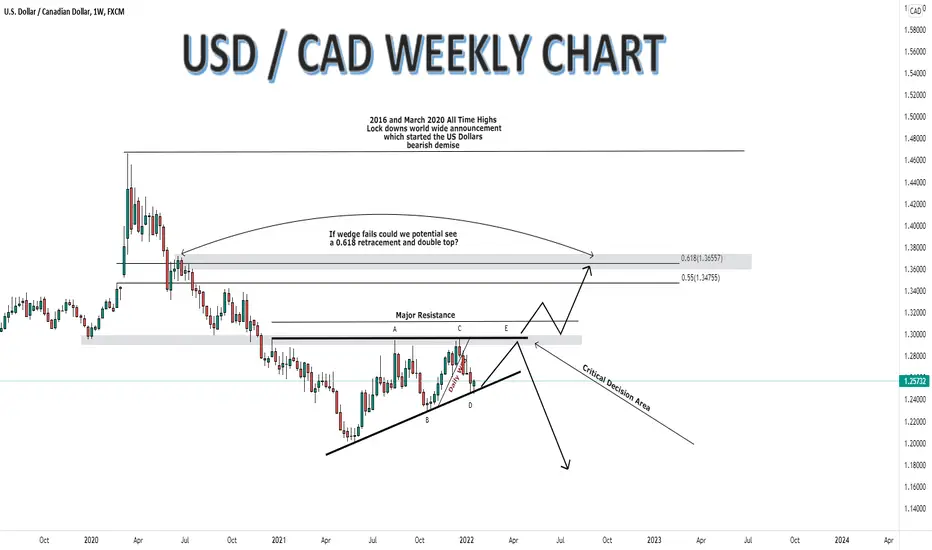
USDCAD FURTHER UPSIDE COMMENCING 🙌🏻🙌🏻🙌🏻 Hi Traders
I hope you have managed to get a little down time in over the weekend and are refreshed and ready to go for another week in the markets, lets have a profitable week!
Here we have an ascending triangle on the weekly time frame.
Now the reason we are not sure if the market will break out to the upside or downside is normally we see this pattern after a bullish impulse and then we see a further break to the upside. However we are seeing this after a bearish run which means we will be monitoring this critical level to see which direction we will be breaking.
In the weeks ahead we still expect to see some more bullish movement as the US Dollar is getting stronger and the Canadian Dollar is starting to show signs of weakness.
As always let me know in the comments below what you think of this set up and what your thoughts are ?
As always all and any likes and comments are greatly appreciated.
Lets manifest a profitable and safe trading week!
The Fx Chartist
One more pump for DOTBTC before a dump?Of course this is conjecture but given BTC's market dominance I could see this scenario playing for DOTBTC.
I could see DOTBTC having a decent pump to test the top of the rising channel trend line. Which depending on where BTC is at the moment could put it between $30-$33 USD and retesting the DOTUSD local high range.
If we assume that BTC dominance has bottomed and will turn around over the next few weeks then I think it's reasonable to see DOTBTC dump to the bottom of it's macro trend line before reversing and eventually breaking out of its macro symmetrical triangle.
To me this is the bullish scenario if we assume that BTC dominance is going be reversing sometime soon. If BTC dominance crashes and we go into an alt season then everything changes and we reevaluate.

ETH may be close to mid term bottom I´m more cautious in ETH I can see more downside but for now AVWAP from 28 Feb 21´swing low is holding as support, I want to see confirmation this week, if we break this VWAP then 2.8K looks like next potential area of demand, it was back in sept 21´
I see constructive action in some altcoins and still see relative strength and bull markets around e.g NEAR.

Sellers losing control and AVWAP since COVID lows $BTCUSD
My style is minimalistic and over the years I´ve cleaned up my chart progressively. My most important indicator is PRICE action, I ask myself WHO IS IN CONTROL BUYERS OR SELLERS? I look for evidence before pulling the trigger, support and resistance are confirmed only after the fact. I use VWAPS from relevant days in the market swing highs and swing lows are relevant.
Based on those principles I see sellers are losing control in BTC right at 40K ish and on COVID lows AVWAP, if demand doesn´t step up with conviction and sellers counter-attack BTC may lose 40K and mid 30K will be next target.
Based on this hypothesis I´m taking some longs with half my usual risk in MATIC, ALGO and LINK. I´m a swing trader and I always use stops, risk MGMT is priority # 1 for me. If I see weakness in the next coming days I will hedge with some ETHDOWN.
Good luck to everyone.

SHORT BTC STILL BEARISHBTC FAILED TO HIT AND SURPASS 53K AREA BUT IS HOLDING A SUPPORT AROUND 45-48K RANGE. We could see a 20-30k bitcoin in 2022. Other networks are proving to be stronger use cases than Bitcoin with way faster transaction speeds and larger capacity + cheaper fees. Bitcoin is the daddy of all cryptos but it is not the most advance network or most powerful. SOLONA XRP AVAX i would prefer those for transactions for time and convenience. Please leave your likes and comments. Thanks

LONG ZILLIQA METAPOLISIm very bullish on zilliqa as the network is working to launch a metaverse called metapolin. Im whale-ing zilliqa in my cryptowallet and staking it to eran daily interest on my holdings. WIN WIN. I believe we could see a higher all time high in the month of jan 2022 if they launch successfully and on time. Thanks please like and comment.

Total Crypto Market Capitalization Things are getting fun and exciting. The gift that keeps on Giving...Inflation... Crypto is the Solution... Steady she goes mate...

KNCUSDT SHORTSuper strong down trend in play supported by our favorite indicators ichimoku and macd. looking foward to a new low.
NOT A FINANCIAL ADVICE

Ethereum [ ETH ] - Nice Dip Buy Area! It looks like Bitcoin and ETH both sold off a little but, however we are at the Support Zone now for ETH. Looking like a good Dip Buy!
AVAX long#AVAX broke through the resistance level which was also the ATH. After the retest of level confirmed the breakout, bullish movement will likely continue up to 126$

Pfizer-PFE Swing trade-10-30-2021PFE swing trade into earnings. decent risk to reward ratio as displayed in the red/green diagram.

LUNA SenarioPrice is still in a descending channel and testing 40-41$ support level,
So if price can hold the support zone it may form a hidden divergence which could lead price up to 42-43 zone
Otherwise price drops till 39$ Zone

Strong Support for Litecoin!!Litecoin has dipped past support at $169. But it quickly found further support in the $160's, just above our level at $165, as identified by green triangles on the KRI. If support does not hold, the next level down is $158. If we see more bull momentum come through, we should be able to establish the $170's again, with the first target at $174. If so, we will regain the previous value area between $174 and $184.

$BTC Updated #BitcoinBitcoin updated chart. Want to see some consolidation here in the $54-59K zone for bullish thesis of $100K by December. Good accumulation and then it's next leg up to ATH in my opinion. Good MOMO


AGIX - BEWARE OF SOPHIE THE ANDROID Long term hold, AGIX or Singularity.Net
Hidden gem for future pump has had a 87% increase of over 135 days.
Market low to market high (candle) 181% increase across 81 days.
Short to long term hodlers
From current price at time of writing (0.00000775 btc),
By End of Oct 2021 a predicted increase of 7.3%.
By the next small local top mind Nov at 18%.
By the next all time high could be as early as mid oct by 50% (based on current W pattern trend. Or following the trendline this will hit some time in January 2022.

FINANCIAL MARKETS FOREX WEEKLY UPDATE SEPTEMBER 19 2021Hey Traders just wanted to give a weekly update on what I see happening in the markets this week. This could be a big week for the Forex, Stocks, Bitcoin, gold and oil.
This week will be big for the forex, s&p 500, bitcoin, gold and oil. This week we have a FED meeting on WED and if they mention inflation risk I believe we could see stocks start to sell off more. The US Dollar should rally on the FED being hawkish but if they say the opposite we could see current trends reverse. I still think the US dollar is bullish for now and it could be about to enter a strong up move on more positive news for US dollar. Watch for alot of volatility on WED! Also Bitcoin still showing signs of bull market.
Enjoy,
Trade Well,
Clifford
