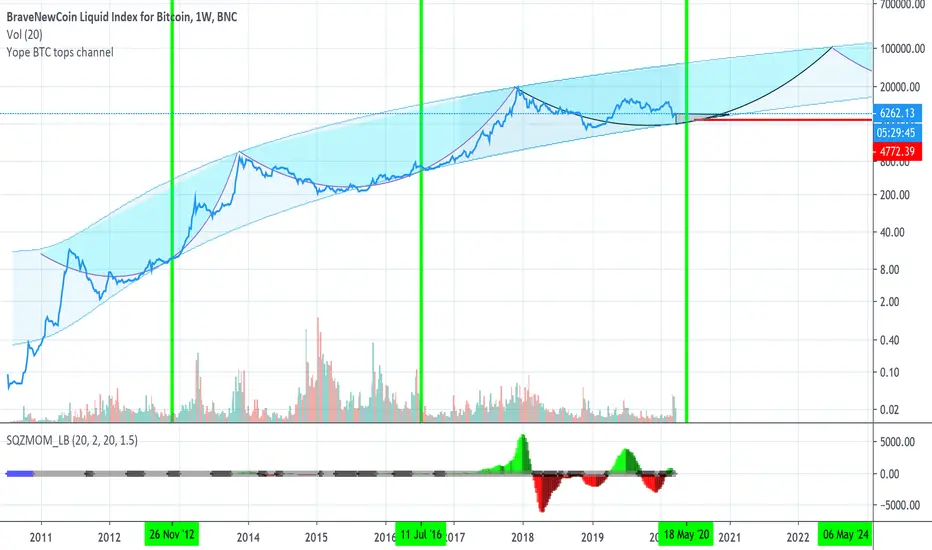
Long Term BTC: Cash is still kingUnpopular opinion here. I can definitely see this testing the other end of this channel. In fact, I think it has to.
Crytpocurrency

Money-Maker, staring down loaded gun!By the mistake, Bitcoin has been updated in Indian Streaming!
This is the link :
I am going to correct something in this post for more clear vision of BITCOIN . Look at the chart, there are two scenario.
Whole Crypto siting on ticking 💣 Bomb 💣...! Bitcoin.
Don't forget to give LIKES and Comments.
We have enjoyed below Short Selling PLAN A and B:
Trade setup on 💰Bitcoin for "Swing Trader".

bitcoin dominance at resistance level 68.if bitcoin able to close above 68 level than very bad for alts we will have really bad fall in altcoin.
yes i am bullish

If Price Stay Above 8200$ Then BULLISH TOWARDS 10,200$ to 13k$Daily Candle Bullish = Target 10k to 13k
Weekly Bullish same trend towards 13k
If price break 8200$ then we can see support level 7200$ and 6600$ but this Dump Good to next bull run.
Wait for some correction downside 8200$ for long and Halving event might different this time, due to uncertainty of market possible DUMP hard and later on-trend towards ALL time high 20k coming months
🛑SUPPORT/RESISTANCE
✅S1= 8200
✅S2=7400
✴️R1=10200
✴️R2=13000
Please like, share, comments and follow me to get daily base analysis
Thank you for your support, I appreciate it.

BITCOIN AT CRITICAL LEVEL OF RESISTANCE BITFINEX:BTCUSD rejecting $7200 area after its sudden spike (you can identify it by its temporal choppy range within the zone) which may lead to a possible drop to $6700. Liquidations around my identified resistance area further battress the possibilities of a reversal.


TRON/BTC - two shopping zones.1 zone buy: after the breakdown of dynamic resistance. Attachment above it.
2 zone buy: Fibonacci correction to 61.8% and middle channel testing.
Friends, thanks for your likes and comments!
Good luck with trading!


Nano Buying Opportunity.A small pullback to the 200MA and some support might turn out to be a good buy opportunity for Nano.

Alternative Bullish Elliott Count! (8100)Hi guys,
As I've told some of you already, I woke up this morning with some doubts about my previously shared Bearish Idea (linked below), as the Elliott structure on the lower time frame didn't really seem to make sense. I had to come up with an alternative, and had 2 possibilities, so I went with the one that made most sense to me, which I am presenting in this bullish alternative idea. Which is in fact bullish short term, bearish mid term, and bullish long term .
As you can see by my subdivision on the lower time frame, we would only be at the 3 of the 5 at that 7300 mark , we still would need to put in the 5 after all.
Do I suggest you to long here? Well, I suggest you to keep it safe, don't use high leverage, put in a stop loss and move it around, like I advise you to do each time. However, if you are keen on longing, you might want to wait for another short term leg down which could indicate a completed ABC correction and the perfect spot to long in this play.
Who's with me to long 6450-6500 and see what will happen?
Who's with me to short 8100 if we get there and see what will happen?
I am very curious and excited to what's next, I took partial profit on my short already and am still glad I took it around 7k as mentioned before.
As to how this will play out when we reach 8100, it will become very obvious that the same support structure visible in my previous idea (5400-5500) would become the golden pocket area if we finish this wave at the 8k area , so the bearish pattern in my previous Idea would be valid once again, even if this scenario is the one that plays out. Of course, I will create a new chart and update this post if we were to hit 8100 to show you what I expect this market to do and how I will be trading that.
One again FYI, the 8100 level is somewhere in the middle of the golden pocket area from the entire Corona fear move starting at 10.6k and ending at 3.8k (Coinbase) , for that reason it is very very very likely to form heavy resistance if we get a 5 that high, and I see no reason not to sell your position when we do, but I am not a financial advisor and you should make your own decisions and DYOR.
I wish all of you good luck and stay safe!
PS: This might be interesting for you if you wan to learn more about FIB and Elliott trading, I have a lot of respect for Sam from TradeDevils and have been following him for years, I suggest you do too! I am still a noob in this stuff, and I would consider him to be a professional.

Bitcoin - Potential Bitstamp Triangle Breakout So to be clear, this is only showing on Bitstamp - not other exchanges. Therefore it is probable that a breakout hasn't technically occurred. It's interesting nonetheless hence why i'm posting it.
We can see that we have closed 4 hour candles above the triangle resistance. This is good, the candle broke with volume - also good. The not so good is that the red dashed line is the other potential trend line one could use to draw the sym triangle and that's right... we have hit it and been rejected.
This likely indicates that the red dashed line is the true upper triangle resistance line and this matches up to a number of other exchanges as well.
With that in mind, you should not be trading this pattern at this point but instead wait to see if the red dashed line can be broken on a 4 hour level. Until then just hold tight and see what happens.
A very good scenario would be a pullback to the original breakout resistance, a lovely retest and bounce taking us back up to the red dashed line. From there I'd love to see us hold for a day or so before breaking through it.

xmr/btc - mirror level, stop loss, hide behind it. mirror level, stop loss, hide behind it.
the power to mirror is not enough.
We need a refill in the liquidity zone.
successful deal

This drop was duePrice always hits the bottom of the yope at halving. Too many YouTubers were using a trendline inside the channel touching bottom.
youtube bitcoin idiots are useless
Bitcoin - Bearish Scenario
The Bearish scenario looks like the downtrend of the growing channel will not keep the price drop and the value of Bitcoin will drop directly to 5000$ where we will buy Bitcoin.

ETHUSDT, SIGNS OF BULL! BULL!! BULL!ETHUSDT UPDATE: Get ready for a push on ETH, how to enter trade, either a buy at 131 or 140. Or you wait for the patter to break and buy the strong bullish break. Stoploss level would be 102- 114 level, tp is 178 - 191 level.

MASSIVE BITCOIN SELL-OFF. WHERE AM I LOOKING TO GO LONG? So Bitcoin ploughed through all supports like they were nothing and totally rekt any breakout traders who traded that triangle breakout above 9200.
Anyway, here we are. So what now?
I think we are still at the mercy of global markets and are highly correlated to them. In the short term i think we still head lower into the monthly levels at around 7560 and then ultimately around 7150 ish before we see a substantial bounce and possible reversal into the halving.
I will start scaling into a long in the box area on low leverage for a long term swing into and beyond the halving.

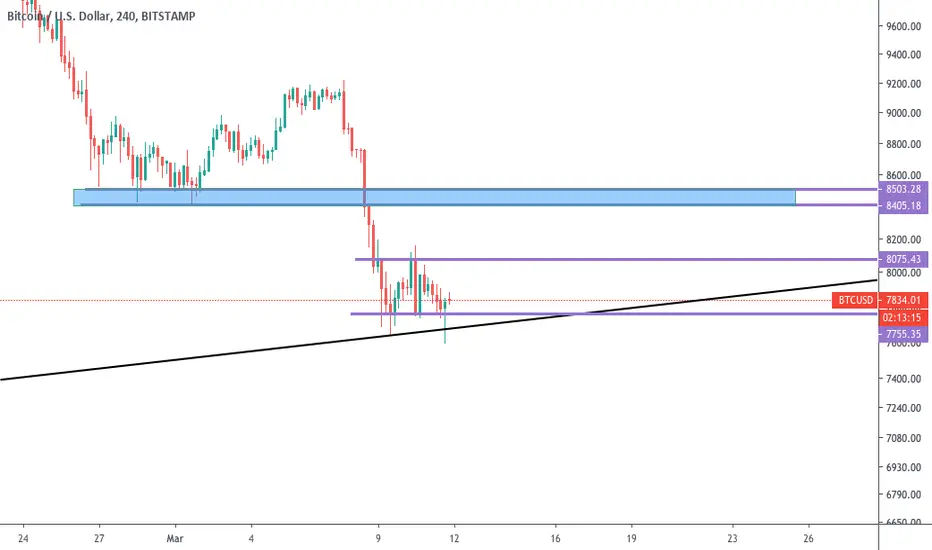
A safe and sensible way to play this... Look - nobody knows what's going to happen. As bold and confident as some may seem with their "ideas" here, they have no way of knowing how the market is going to behave or what will happen over the next month, or which of the handful of potential patterns/scenarios will play out, so let's go on what we DO know to be true right now:
1. Bitcoin is moving pretty much in tandem with the stock market, and we can't expect a Bitcoin recovery until the stock market recovers, which we know isn't going to have a chance of happening until the virus is at least somewhat contained globally and cases start to go down, which is probably many many months away.
2. We are close to losing the logarithmic trendline that has supported Bitcoin's price since 2013. Closing any higher time frame candle under 7550 would pretty much destroy that trend and cause a panic sell down to lower 7ks/upper 6ks.
3. Since our calamitous plunge from the 10k area over the weekend we've been oscillating between a resistance of 8070 and a support of 7750 (on Bitstamp).
So - what's the best way to play this?
People who shorted from anywhere above 8.5k are sitting pretty right now and are really safe. If you are one of them, you can simply wait for a higher time frame candle to close above 8070 and once that happens, take some profit and layer in profitable stops for the rest of your position.
If you didn't short from above 8.5 and are looking for a way in, you can wait for a 4-hr or higher candle close under 7750. That would almost certainly incite a move down to the 7500 area at a minimum. It's a nice trade even if it stops there. You can take profit but leave a decent portion of the position open in case it keeps going.
Alternatively, Bitcoin does love to go back and test breakout areas, so a market maker-driven move back up to the 8400 resistance area would not be unheard of at all. If we get a 4hr or higher candle close above the 8070 resistance, it will almost certainly incite a move back up to 8400-8500 - another nice trade.
Cheers and happy trading and stay healthy!
Bitcoin, could drop to $7k if price will break down key levelWe can open Sell on Bitcoin below 7600
- The global trend is Down
- The local trend is down
- Closer - re-test
Goal $7000

$BTC.X halving is coming, perspectiveThose tiny blips around the last halving are 20+% dumps before the 3000% bull run. Whales want to accumulate BITSTAMP:BTCUSD before the halving for the next bull run. The easiest way for them to do this is to cause retail traders to sell out of fear . Of course our trading bot was signalling to sell the last top for day trading purposes but that is beside the point here. Take a step back and look at the big picture, it's going to take something very dramatic to refute the trendline which has existed for years. Currently any purchase under $8500 is an excellent deal and by the summer any purchase under $10000 would have been an excellent deal.

BTCUSD LONG Its now or never for BTC. I think there is a strong chance we are going to bounce from here. Also Dominance market structure looks wonderfully bearish.
God Speed,
Mr. Lucifer


Bitcoin is following this pattern currentlyBitcoin is in a healthy uptrend that will break resistance, pull back to the new support(previous resistance) then head higher breaking the overhead resistance of the previous move. This may sound a bit confusing but the chart makes everything clearer!
Next resistance is 10900/1100 and if the trend stays the same then I expect the level of 1500 to be broken in the next few days to a run up to 10900.
If anyone is new and would like some tips/help on anything crypto related I'd love to help. I was once new and it was a lot to take in at first but with long nights and persistence I learned a thing or two and now everything is a lot easier.
Feel free to message or comment!

BTCUSD LONGA reiteration but my bias remains unchanged from 9750 long. Im glad Im not playing futures at this time because we wont need to for sometime. Alts will make some of us rich for a while.... Not all will cash out at the right time... I sure am glad I took the last three years to prepare for this. My hard work has been vindicated by my results.
God Speed Gents.
